World Journal of Engineering and Technology
Vol.03 No.03(2015), Article ID:60547,6 pages
10.4236/wjet.2015.33C043
Encapsulated Water Hammer: Theoretical/Experimental Study
Geanette Polanco1*, Muhammad Shakeel Virk1, Umair N. Mughal1, Sojo Victor2, Da Paixao José2, Vidal Antonio2, Aguillón Orlando2
1Atmospheric Icing Research Team, Industrial Engineering Department, Narvik University College, Narvik, Norway
2Industrial Department, Simon Bolivar University, Caracas, Venezuela
Email: *Geanette.PolancoPinerez@hin.no


Received 10 September 2015; accepted 15 October 2015; published 22 October 2015

ABSTRACT
Water hammer phenomenon involves the transformation of kinetic energy in pressure energy, this transformation occurs as the fluid conditions change inside the pipe in quite a short time. Industry requires to affront frequent flow interruptions in pipe systems due to the closing of valves or stopping of pumping equipment. This phenomenon can initiate serious damages like destruction of the pipe system involving leakage of the working fluid to the environment. If the system operates in a fragile environment, as in cold regions, concern about the consequences of leakage increases due to the variation of physical properties of fluid as well as the pipe material as a function of the temperature. Water hammer effects can be controlled focusing efforts on reducing the pressure increment that takes place once the phenomenon is presented. Some methods try to reduce the time of closure or the rate of change before the closure using special valves, others install additional elements to absorb the pressure surge and dissipate energy, others install relief valves to release the pressure, and others try to split the problem is smaller sections by installing check valves with dashpot or non-return valves. Splitting the pipeline into shorter sections is often used to help preventing the pipeline length of water falling back after a pump stops. In this paper the numerical results of maximum and minimum pressure values at both ends of a closed section are compared to experimental data. The numerical results follow the experimental trends.
Keywords:
Water Hammer, Encapsulated Section, Experimental Facilities, Cold Regions

1. Introduction
In theory the water hammer process involves the transformation of kinetic energy in pressure energy, this transformation occurs as the fluid condition is changing inside the pipe in quite a short time. The pressure appears as a pressure wave that is moving inside the pipe from location where the valve was suddenly opened or closed toward the downstream and also upstream that location [1]. The time that this wave needs to reach the other end of the pipe is related with the length and the sound speed in the medium of the wave that usually is considered constant.
Water hammer effects can be controlled focusing efforts on reducing the magnitude of the pressure increment that can take place once the phenomenon is presented. Some of the methods try to decrease the time of closure or reduce the rate of change before the closure through proper valve closure rates (with slow-closing valves), others try to reduce the flow in the system (establishing the flow limit for a specific system), others install additional elements as accumulators or similar to absorb the pressure surge and dissipate energy (surge chambers or diaphragm tanks), others install relief valves to release the pressure, others modified the original system using bypass sections [2] and others focused on splitting the problem is smaller sections (installation of check valves with dashpot or non-return valves). Splitting the pipeline into different sections as far as the water hammer is concern is often used on steeply rising pumping mains. They help prevent the pipeline length of water falling back onto the pump’s check valve following pump stoppage.
Managing of frequent interruptions in the flow in a pipe is a really common situation in the industry and for single flow this phenomenon has been widely studied and named the Water Hammer phenomenon. These interruptions generate abrupt changes in current flow, changes in speed and therefore changes in the pressure inside the process pipe. Often this phenomenon appears between two processes or inside an inner line due to the closing of valves or stopping of pumping equipment. Due to the relevance of the negative effects of this phenomenon assessment efforts are concentrated not only on the reduction of the effects but also to determine the reliability level of those systems [3]. In this paper, the experimental results of a closed pipe section by action of pneumatic valve at the beginning and the end of the test section will be presented and discussed.
2. Water Hammer Characteristic Parameters
Pipes installed in water supply systems, irrigation networks, hydropower stations and industrial plants are required to fulfil some requirements of reliability, safety and economical limitations. Current hydraulic systems operate over a broad range of operating regimes across their lifetime, involving changes in flow velocity, as well as, the induced changes in pressure.
Selection of the appropriate means to reduce the effect of a water hammer phenomena among several alternative possibilities is a very crucial factor to determine the reliably of a pipe system. The final choice will fulfil in the best possible way the corresponding requirements of the specific system studied. The identification of the links between the different stages of the phenomenon, starting/progress and finishing can be expressed in a cognitive way as well through mathematical tools used to develop the required calculations.
Transient calculation through the Methods of Characteristics (MOC) is based on the fact that the general momentum balance equation can be simplified along the direction of flow, and therefore a unidirectional differential equation must be solved instead of a differential equation system [4]. After the physics are applied, the momentum balance equation for a transient system looks like the formula shown by Equation (1):
 (1)
(1)
Mathematical resolution method introduces a discretization scheme that splits the differential equation into a system of linear equations for the variables: pressure and flow for a generic configuration that contains three positions “P”, “A” and “B” close each other during the time of the resolution [4]. The final set of equations allows the resolution of a real complex problem by Equations (2) and (3):
 (2)
(2)
 (3)
(3)
where: Hp is the energy at position “P”, HA is the energy at position “A”, HB is the energy at position “B”, Qp is the flow at position “P”, QA is the flow at position “A”, QB is the flow at position “B” and R is the loss coefficient.
To present the results in a standard way, it is really important to establish some reference quantities, as for example the reference time, tref, which is defined as the time needed to travel a distance equal to the length of the pipe, L; with a constant velocity equal to the theoretical pressure wave velocity, named celerity, c, as it can be seen in Equation (4).
 (4)
(4)
The celerity of the pressure wave is related to the properties of the fluid as well as the properties of the pipe material, due to the interaction between these variables in the transient process, which together will determine the elasticity of the system as shown by Equation (5):
 (5)
(5)
where  is the reference time,
  is the length of the pipe, c is the celerity of the wave, ρ is the density, K is the fluid elasticity modulus, K is the pipe material elasticity modulus, D is the inner pipe diameter, e is the pipe wall thickness, V is the velocity, p is the pressure, g is the gravity acceleration, θ is the angle of inclination of the pipe segment, f is the friction factor and B’ is the local loss coefficient of the segment. It is important to highlight the fact that fluid properties as well as pipe material properties are a function of the temperature, so if the system temperature changes then the celerity will also change.
3. Experiments and Experimental Facility
The Mechanical Energy Conversion Laboratory at the Simon Bolivar University (LABCEM-USB), Caracas, Venezuela, have developed a system able to perform measurements of transient pressure behaviour inside a pipe system. The transient condition simulated during the experiment consists of the abruptly closing of valves following different configurations. This facility, of approximately 50 m2, is housed inside the laboratory building of 800 m2, accessible to students, professors and researchers at different levels. Schematic representation of the test facility together with a picture showing part of the internal lab facilities are presented at Figure 1 h static and dynamic pressure, before and after an imminent closing of the valves are registered in addition to the temperature and flows.
A pneumatic system is connected to a manifold that feeds the solenoid valves in order to guarantee the same air pressure at both locations of the valves when closing.
Test Section
The testing section consists mainly of a pipe of “U” shape orientated with a horizontal plane parallel to the floor, where two straight parts are delimited by a valve at both ends. The pipes in this section are mostly transparent polyvinyl chloride (PVC) of 24.5 mm nominal diameter. At both ends of the “U” shape there is a development length of 1350 mm (53 diameters). Display sections located between two valves are 3850 mm long (151 times the diameter) in which it can be appreciated fully developed pattern monophasic or biphasic flow. Finally the dimension of the curved section is 1500 mm (59 times the diameter). Test section can be observed at Figure 2.
Depending of the closing valve configuration selected the system simulated an encapsulated pipe section of a typical water hammer situation [5]. The selected configuration was corresponding to both valves closed in a time equal to 0.24 s.
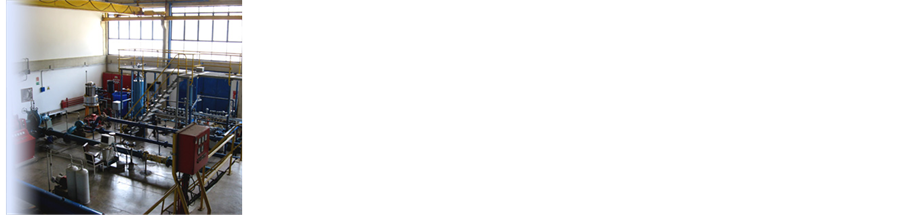

Figure 1. Versatile two-phase flow facility for transient studies in pipes of LABCEM-USB.


Figure 2. Test section indicating the location of the instrumentation. Dimensions in [mm].
4. Encapsulate Flow
Sectioning of pipeline throughout the installations of several valves along the pipeline is quite common. This sectioning can be done by control valves or one-way valves that will avoid reverse flow in rising sections, protect some mechanical elements like pumps presented on the pipeline or simply allow connection or disconnection in different locations. When closing happens the flow inside that section limited by both valves will experience a water hammer phenomenon of the section in question in an independent way from the rest of the system. This sectioning can be presented in horizontal as well vertical systems. The initial understanding of this phenomenon can be carried out in absence of the gravity effect on the system.
In this work specifically the test section corresponds to a horizontal section limited by two controlled valves operated at the same time.
5. Results
5.1. Numerical Data from MOC
The numerical calculation covers a typical case of a tank connected to a pipeline finished in a valve but having the same pressure loss along the length, including friction losses as well as the local losses presented in the section. Maximum and minimum pressure dimensionless values at both ends obtained for the numerical model of the test section are presented in Table 1. As expected the maximum pressure value at the downstream end (outlet) of the test section is larger than the maximum pressure of the upstream end (inlet). This can be explained by the fact that the transport of the pressure wave inside the pipe, in theory, will take place at the same velocity, however, the fact that the valve located at the inlet position is also closing down stops the constant pressure supplied by the tank or pump located before the studied section.
The magnitude differences between the maximum over pressure and vacuum pressure also can be related to this fact, because the wave will move in the same direction as the flow created by a larger suction area after the inlet valve.
The model includes the equivalent losses in the system through only the mechanism of friction. This assumption implies that the losses are linearly distributed along the pipe. No dependency of the results on the numbers of elements used was checked. The values to establish the celerity includes the material properties of the PVC pipes.
5.2. Experimental Data
Experimental data reported is focused on the pressure variable at different locations in the test section and both steady state and transient condition. Table 2 shows the steady state initial condition of the experiments. Figure 3 presents recorded maximum and minimum pressure achieved at both ends of the test section. Also dimension-

Figure 3. Maximum overpressure and vacuum pressure at both ends of the test section.

Table 1. Numerical relative maximum and minimum pressure at the beginning and end of the test section.
Table 2. Flow and pressure test conditions.
less pressure increments and decrements of the pressure at the inlet and outlet location. The reference quantity used to the applied dimensionless definition was the pressure at the inlet location (maximum pressure in steady state conditions) are presented at Table 3.
The data shown in Table 3 refers to the inlet pressure as the maximum pressure in the section at steady state condition. The differences between the theoretical and the experimental data can be subject to several aspects of the fact that the model for celerity assumption is that the properties and thickness of the walls are kept constant along the pipe length or the model of the valve closing does not represent accurately enough the actual valves operation. It is known that the pressure pick value is inversely proportional to the closing time, as well as depending on the type of closing low followed by the valve [6]. Numerical results obtained by modelling the test section overestimate the actual values for pressure variation, however the calculation results follow the same trends as the experimental data.
6. Conclusion
The main conclusions from this work, demonstrate the model using MoC reproduces the situation of having a section limited by two valves at the corresponding ends of the test section. From the results it can be observed that the maximum increment in pressure is located at the downstream location of the test section (outlet) meanwhile the minimum pressure is located at the upstream location (inlet) of the test section. The vacuum level when compared to the initial pressure in steady state is larger than the increment pressure when compared to the same parameter. Further studies are needed to complete the parametric study of this phenomenon.
Table 3. Experimental relative maximum and minimum pressure at the beginning and end of the test section.
Acknowledgements
The work reported in this research paper was carried out by Atmospheric Icing Research Team at Industrial Engineering Department of Narvik University College and was funded by Research Council of Norway, project no. 195153 (ColdTech RT3 and RT5) and Norwegian Centre for International Cooperation in Education, project number- HNP-2014/10023.
Cite this paper
Geanette Polanco,Muhammad Shakeel Virk,Umair N. Mughal,Sojo Victor,Da Paixao José,Vidal Antonio,Aguillón Orlando, (2015) Encapsulated Water Hammer: Theoretical/Experimental Study. World Journal of Engineering and Technology,03,290-295. doi: 10.4236/wjet.2015.33C043
References
- 1. Parmakian, J. (1955) Waterhammer Analysis. Prentice-Hall, New York.
- 2. Choon, T.W., Aik, L.K., Aik, L.E. and Hin, T.T. (2012) Investigation of Water Hammer Effect through Pipeline System. International Journal on Advanced Science Engineering Information Technology, 2, 48-53.
- 3. Wang, R., Wang, Z., Wang, X., Yang, H. and Sun, J. (2014) Water Hammer Assessment Techniques for Water Distribution Systems. Procedia Engineering, 70, 1717-1725. http://dx.doi.org/10.1016/j.proeng.2014.02.189
- 4. Streeter, V.L. (1966) Fluid Mechanics. McGraw-Hill.
- 5. Alejandro, S.P.V. (2015) Redise?o y adaptación para el estudio de golpe de ariete en el banco de pruebas de flujo multifásico del LABCEM-USB. Bachelor in Mechanical Engineering Bachelor, Mechanical Engineering, Simon Bolivar University, Caracas, Venezuela.�
- 6. Polanco, G. (2014) Cognitive Selection Strategy for Rapid Closing Valves. 5th IEEE Conference on Cognitive Infocommunications (CogInfoCom 2014), Vietri sul Mare, 5-7 November 2014, 543-548. http://dx.doi.org/10.1109/coginfocom.2014.7020516
NOTES

*Corresponding author.