Journal of Water Resource and Protection
Vol.4 No.2(2012), Article ID:17427,7 pages DOI:10.4236/jwarp.2012.42012
Homogeneity and Trend Analysis of Hydrometeorological Data of the Eastern Black Sea Region, Turkey
1Department of Civil Engineering, Ege University, Izmir, Turkey
2Department of Civil Engineering, Istanbul Technical University, Istanbul, Turkey
Email: ebru.eris@ege.edu.tr, eriseb@itu.edu.tr
Received January 7, 2012; revised January 31, 2012; accepted February 13, 2012
Keywords: Homogeneity; Trend Analysis; Double Mass Curve; Mann-Kendall Test; Eastern Black Sea Region; Turkey
ABSTRACT
Eastern Black Sea Region in northeastern part of Turkey has the highest precipitation total in the country, approaching 2500 mm per a year. It is therefore an important region as it frequently encounters with flash floods due to heavy rains. For future planning of water resources, environment and urbanization, it is important to know the expected behavior of hydrometeorological processes, mainly precipitation and flow. Due to these facts, in this study, homogeneity of long-term annual precipitation and streamflow series of the Eastern Black Sea Region, Turkey is checked using double mass curve method and trends are determined by means of the Mann-Kendall test. The data network consists of 38 precipitation gauging stations and 40 flow gauging stations across the Eastern Black Sea Region. It is found that 27 precipitation stations out of 38 are homogeneous and no trend is available. Out of the remaining stations, nine are found non-homogeneous and four with trend. For annual flow data, it is found that 22 stations out of 40 are homogeneous and no trend is available. The remaining 18 stations are found non-homogeneous, among which 5 stations have trend at the same time.
1. Introduction
Use of precipitation and flow data in water resources assessment, hydrological modeling, climate change studies, and urban and environmental planning of a region is a must. Network of precipitation and flow stations is not well-distributed in undeveloped/developing countries [1] and in mountainous terrains such that even a station record is valuable. On the other hand, climate change, measurement errors, extreme meteorological events affect structural characteristics of the hydrometeorological time series such as homogeneity and possible trends. In order to use as many records as available for a region, structural characteristics of the data should be derived and evaluated.
There have been many studies regarding homogeneity and particularly trend availability of various hydrometeorological data for Turkey. The homogeneity of hydrometeorological variables such as precipitation [2,3], temperature and relative humidity [3] has been previously investigated for Turkey. Similarly, trend analysis has been performed on precipitation [4-8], temperature [6, 9-12], solar radiation [13], streamflow [6,14-17]. The results of these studies vary depending on the number of stations, record period and statistical test used. A common point is to classify a station as homogeneous or non-homogeneous and/or to determine trend availability and characteristics of the observed data mostly for evidence of climate change. However, no comparison has been made between original (observed) and homogenized and trend-removed data. Such a comparison provides one to use as many records as available, instead of ignoring any data which have inconsistency and/or trend.
Therefore, in this study, first, the homogeneity and trend availability of the precipitation and streamflow data for the Eastern Black Sea Region, Turkey are investigated. The results of the data analysis are then compared to that of aforementioned studies. Secondly, the observed data from non-homogeneous stations are homogenized and if available, trends are removed. By this way, the difference between observed and adjusted data can be evaluated.
2. Study Area and Data
The coastal part of the Eastern Black Sea Region which is located in the north east of Turkey, between 40˚31' - 41˚24'N and 38˚08' - 41˚26'E is selected as study area. This coastal part of the region covers an area bordered with the Eastern Black Sea Mountain chain to the south and the Black Sea to the north as seen in Figure 1. These high mountain ranges run parallel to the sea coast as the
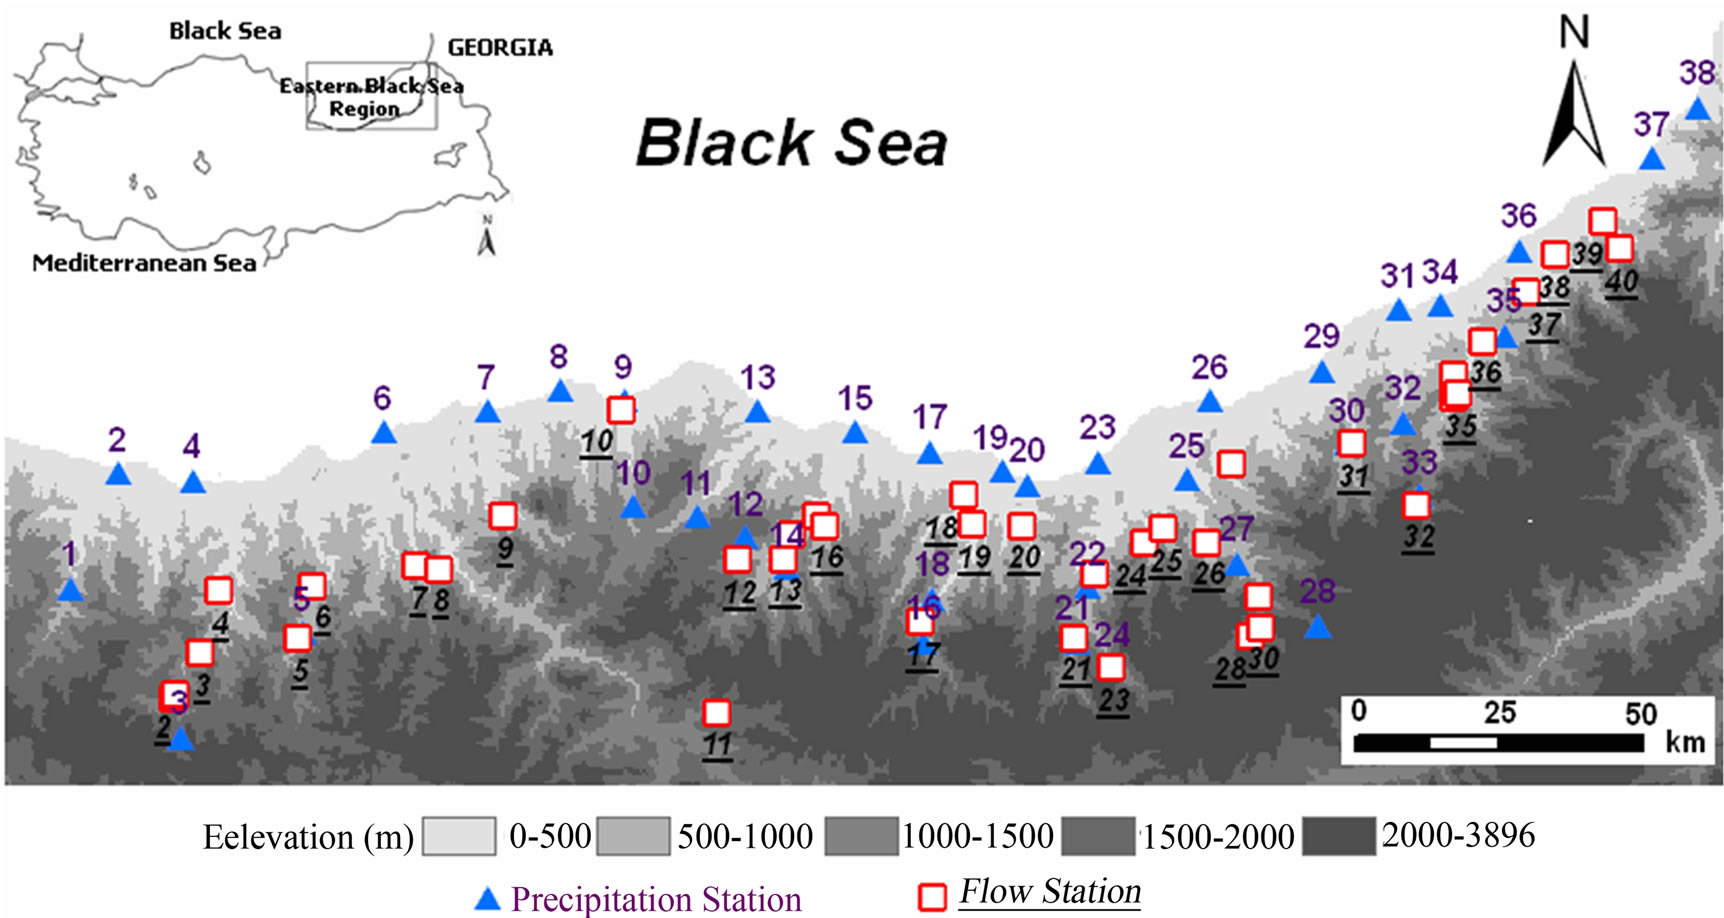
Figure 1. Study area and locations of the precipitation and flow stations.
north boundary of the study area, and rise to more than 3000 m above mean sea level (MSL). The Black Sea Region has a steep rocky coast with some rivers that cascade through the gorges of the coastal ranges.
In the coastal area of the Eastern Black Sea Region, mild and humid climate dominates. Snowfall may be seen in winter. Yearly average temperature is about 14˚C - 15˚C in the coastline, however it decreases with increasing elevation. The average precipitation of the coastal area of this region is more than 1000 mm.
Mean annual precipitation and mean annual flow observations are used in this study. Precipitation data were taken from 38 observation stations of which 19 are located on the coastline of the area. Mean annual flow observations are obtained from 40 flow stations. Locations of the stations are shown in Figure 1 where precipitation stations are numbered from 1 to 38 and flow stations from 1 to 40 starting from west to east. Characteristics of the observation stations are shown in Table 1. Numbers in the column of “No” in Table 1 corresponds to numbers on the map in Figure 1.
The length of precipitation data ranges from 10 to 46 years between 1960 and 2005, whereas the flow record length ranges from 10 to 49 years between 1944 and 2006 with some gaps in the data. To complete the gap in any station, regression equations were developed using continuous data from the neighboring stations. The observed flow is not influenced by any upstream dam or water.
3. Tests Employed
The homogeneity of precipitation and flow data is checked using double mass curve. The double mass curve is a well-known simple tool for checking and adjusting inconsistencies in hydrometeorological data caused by changes in observation methods or data processing. The theory of double mass curve is based on a graph of accumulation of one quantity against the accumulation of another during the same period. If the process is homogeneous, the graph plots a straight line. A break in slope of the line indicates a change in the constant of proportionality between the two variables [18]. In hydrological studies, double mass curve may give indefinite results such that it is unable to say which of the variables caused a break in the slope. In order to obtain more definite results, the accumulations of one of the variables can be plotted against the accumulations of a pattern composed of all similar records in a given area.
For determination of trends in precipitation and flow data for the region the Mann-Kendall test is employed. The Mann-Kendall test is a non-parametric rank-based method which does not require the normal distribution of data. It is robust to the effects of outliers and allows existence of missing data (as only ranks are used). The basic principle of Mann-Kendall test for detecting a trend in a time series is to examine the sign of all pair wise differences of observed values. The Mann-Kendall test has been widely used to detect trends in hydro-meteorologycal time series [5,14,19-23] and is well documented in the literature [24,25].
4. Results and Discussion
Results of the tests employed for the precipitation data are analyzed. It is found that 29 stations out of 38 are homogeneous with no change in the slope of the double mass curves. For the remaining 9 precipitation stations,
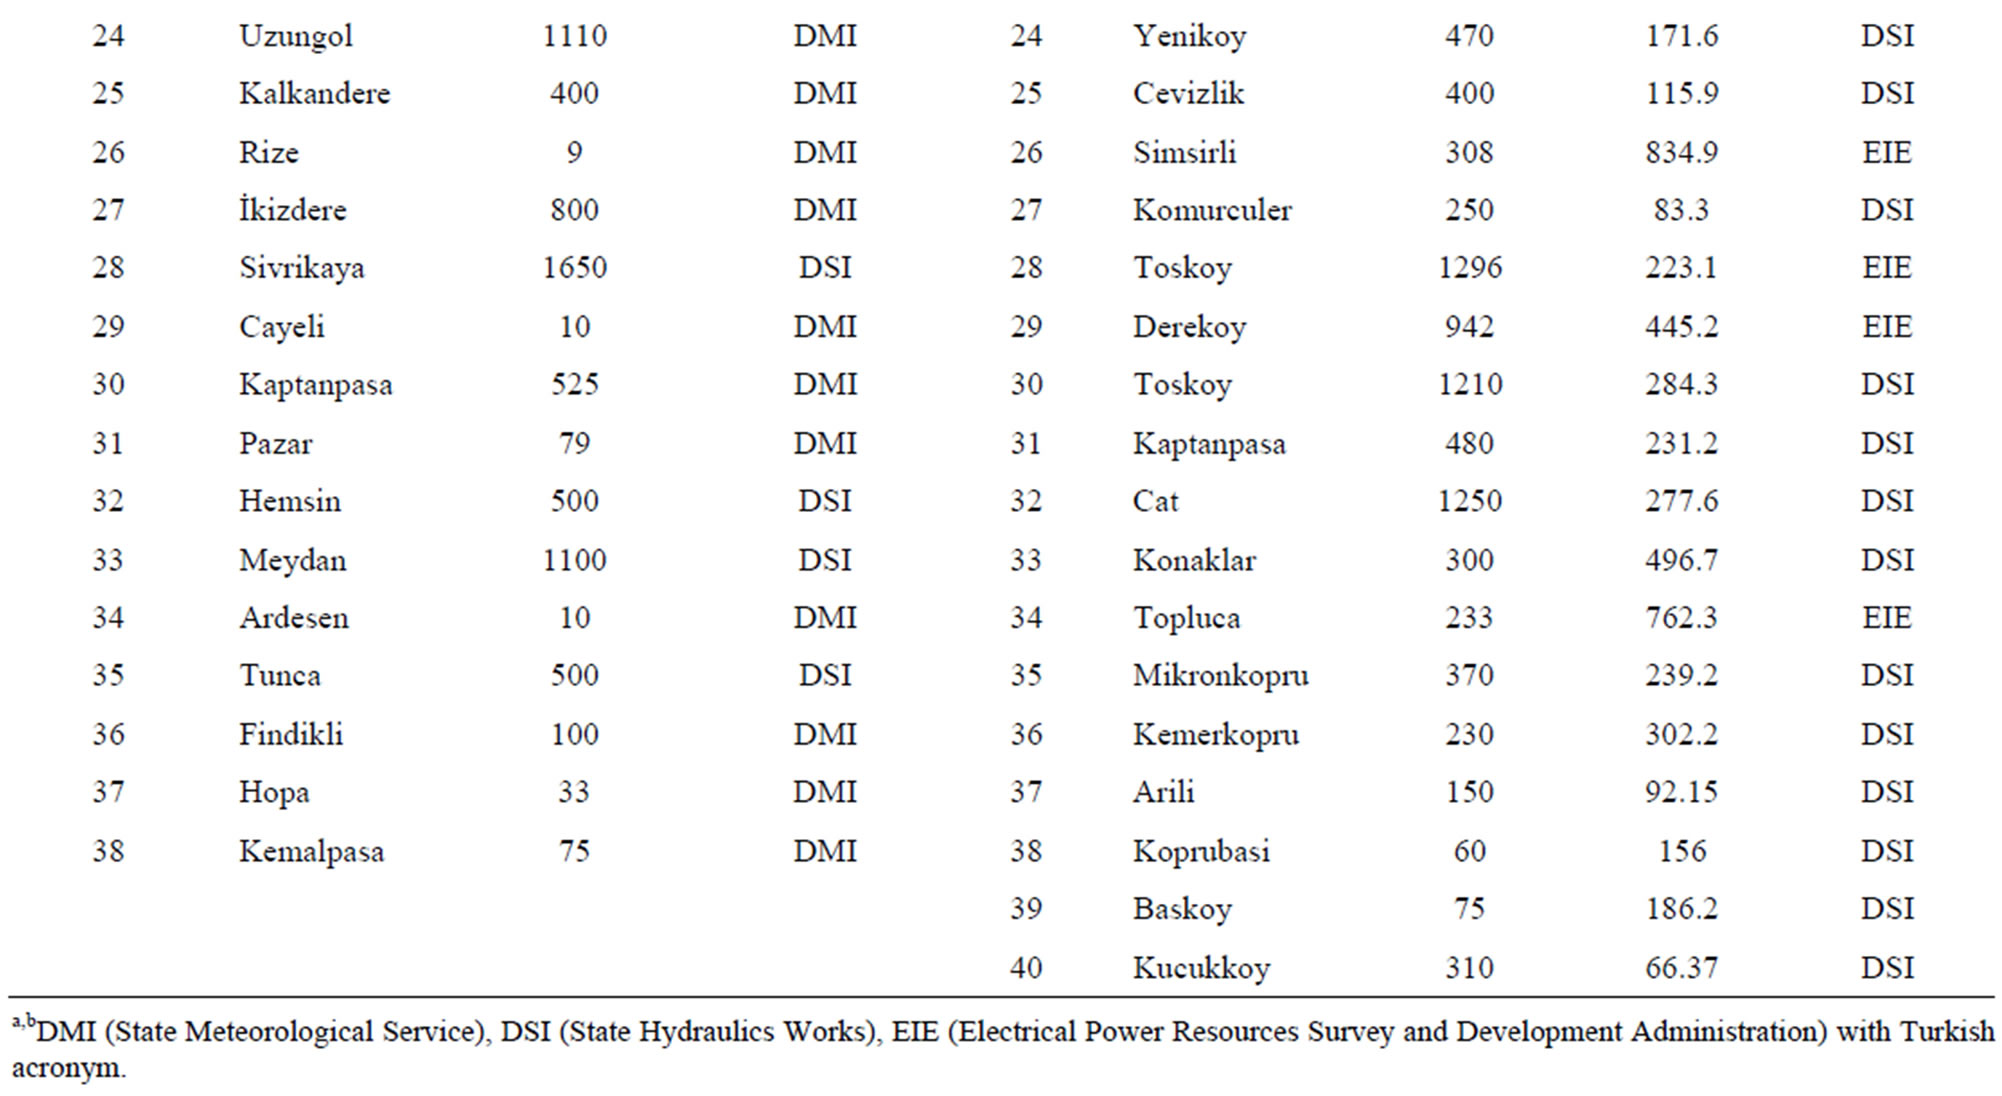
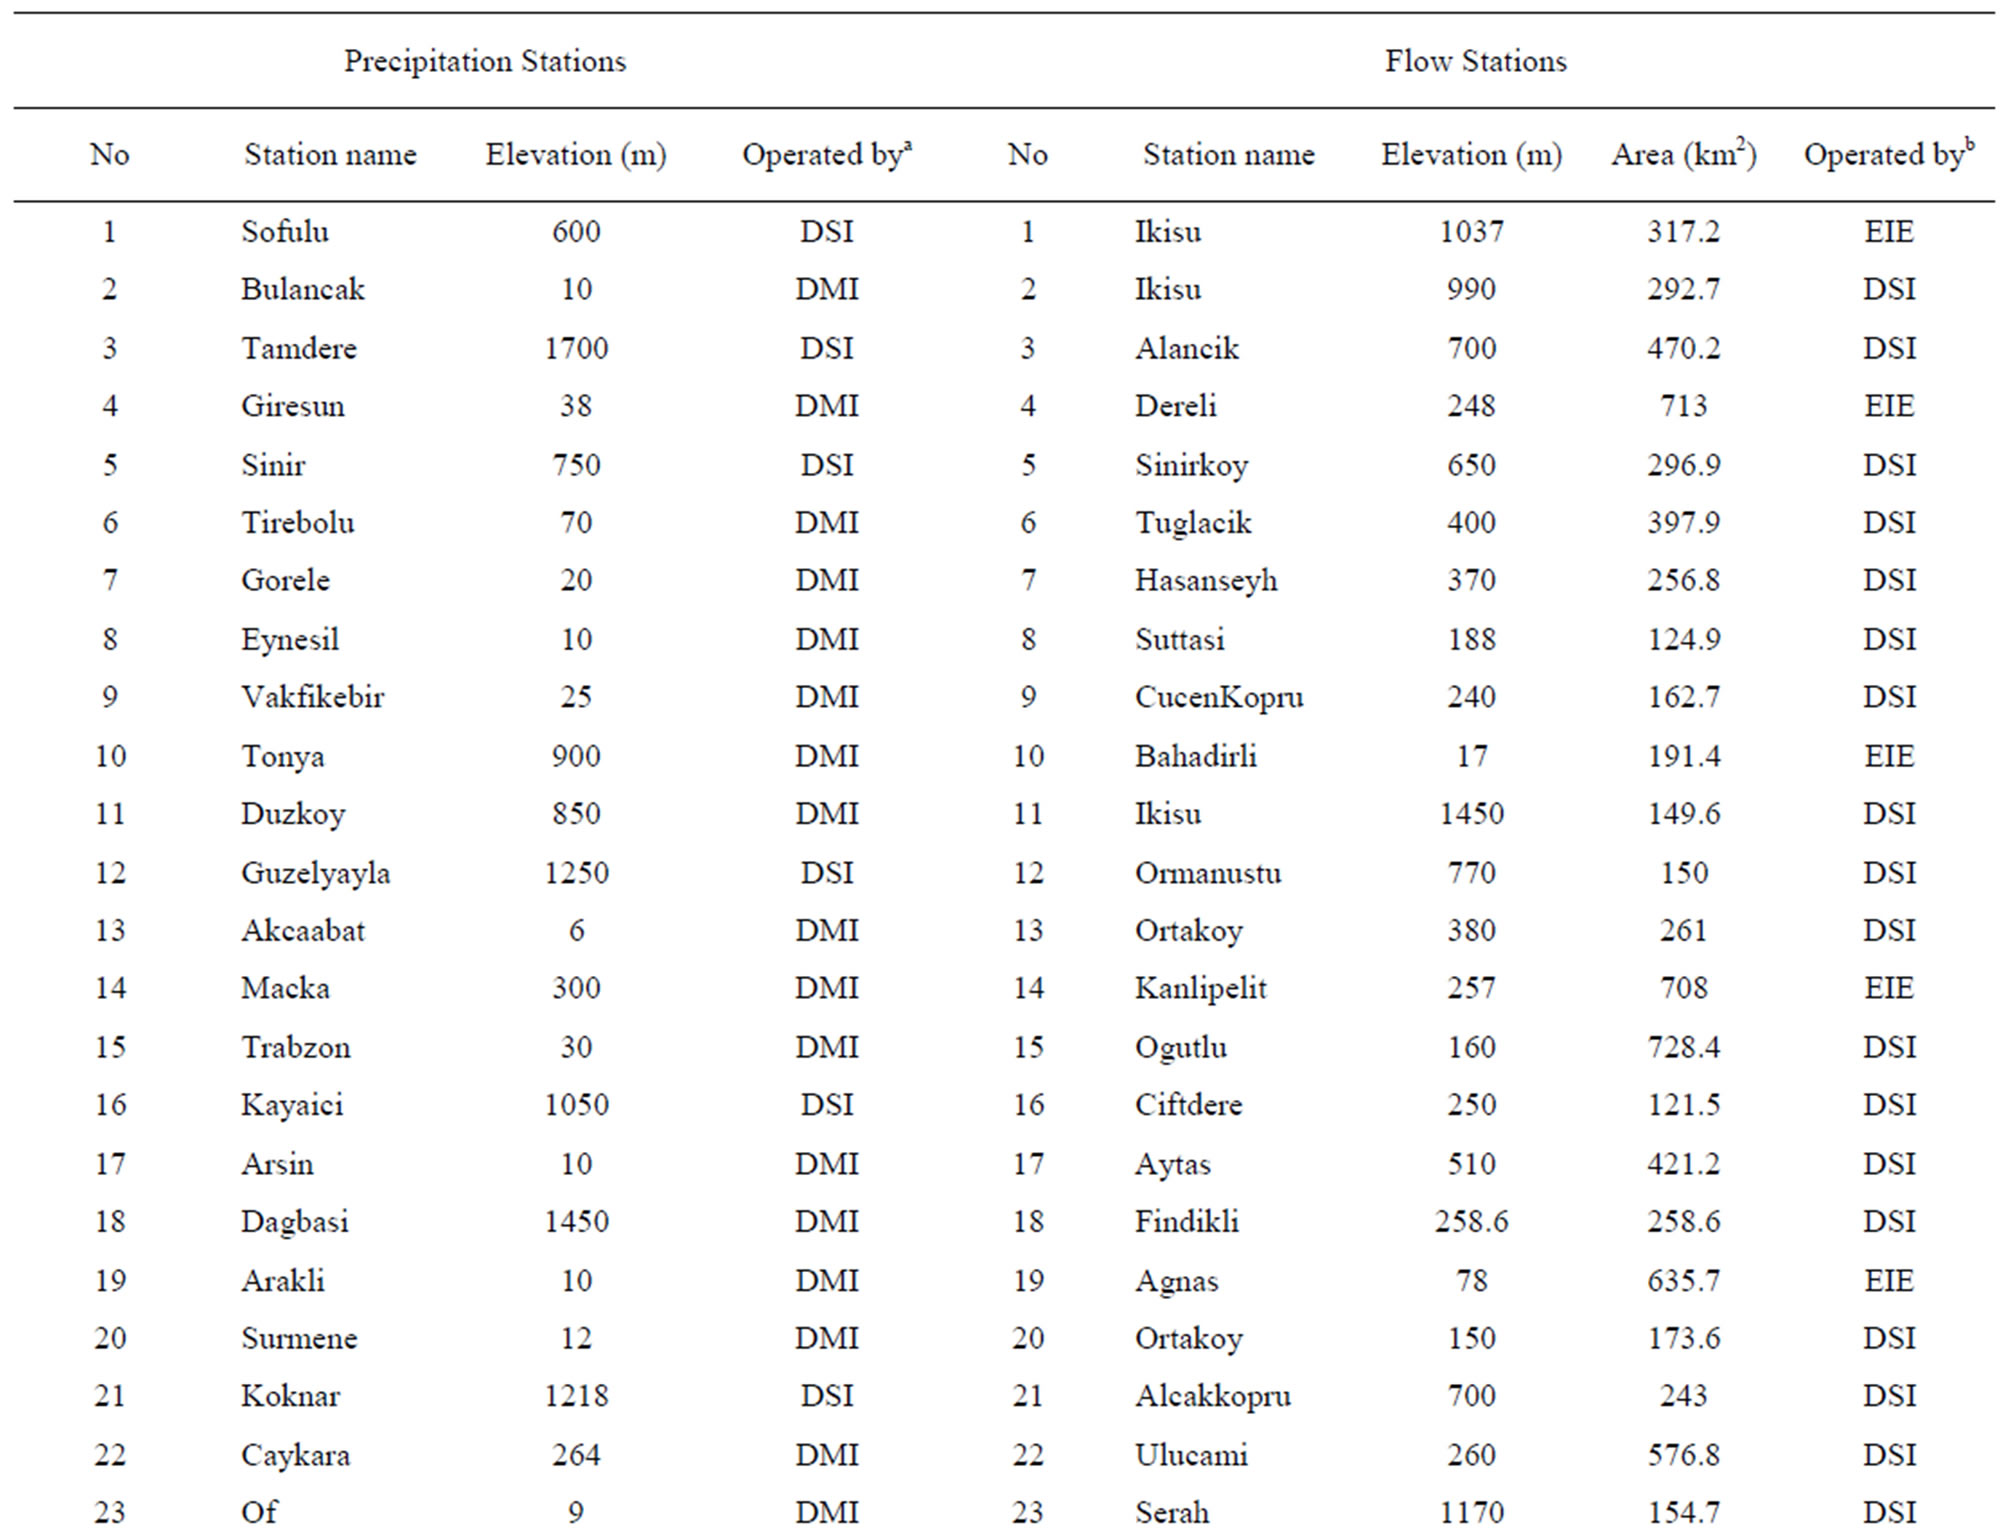
Table 1. Characteristics of precipitation and flow stations.
there are inconsistencies observed. To adjust inconsistency in any precipitation station, a correction factor is estimated by comparing cumulative annual mean precipitation data of non-homogenous stations with remaining stations, thus the precipitation data can be considered as homogenous after correction. An example of this process is shown in Figure 2 for Tamdere (3) precipitation station [Numbers in parenthesis show station number]. MannKendall trend test is then applied to the corrected precipitation data of 9 precipitation stations together with that data of 29 homogenous stations. Upward trends are found in Giresun (4) and Trabzon (15) stations whereas downward trends are observed in Tamdere (3) and Macka (14).
In a previous study [5] in which Giresun (4), Trabzon (15) and Rize (26) were used as common stations, no trend was found in Giresun (4) and Trabzon (15) whereas a trend was obtained in Rize (26). The beginning of the trend for Rize (26) was determined as 1952. Note also that the data record length in the study by [5] ranges from 1929-1993, while in this study it covers only the years between 1960 and 2005.
Giresun (4), Akcaabat (13), Trabzon (15), Rize (26), Pazar (31) and Hopa (37) stations in the Eastern Black Sea Region were used in another study [2] where precipitation data in the stations were found homogenous except for Giresun (4) and Akcaabat (13). Sahin and Cigizoglu [3] found that Trabzon had inhomogeneous precipitation data covering period from 1974 to 2002.
Comparison of the results of previous and current study are given in Figure 3 including record periods and stations used.

Figure 2. Double mass curve of Tamdere (3) precipitation station.
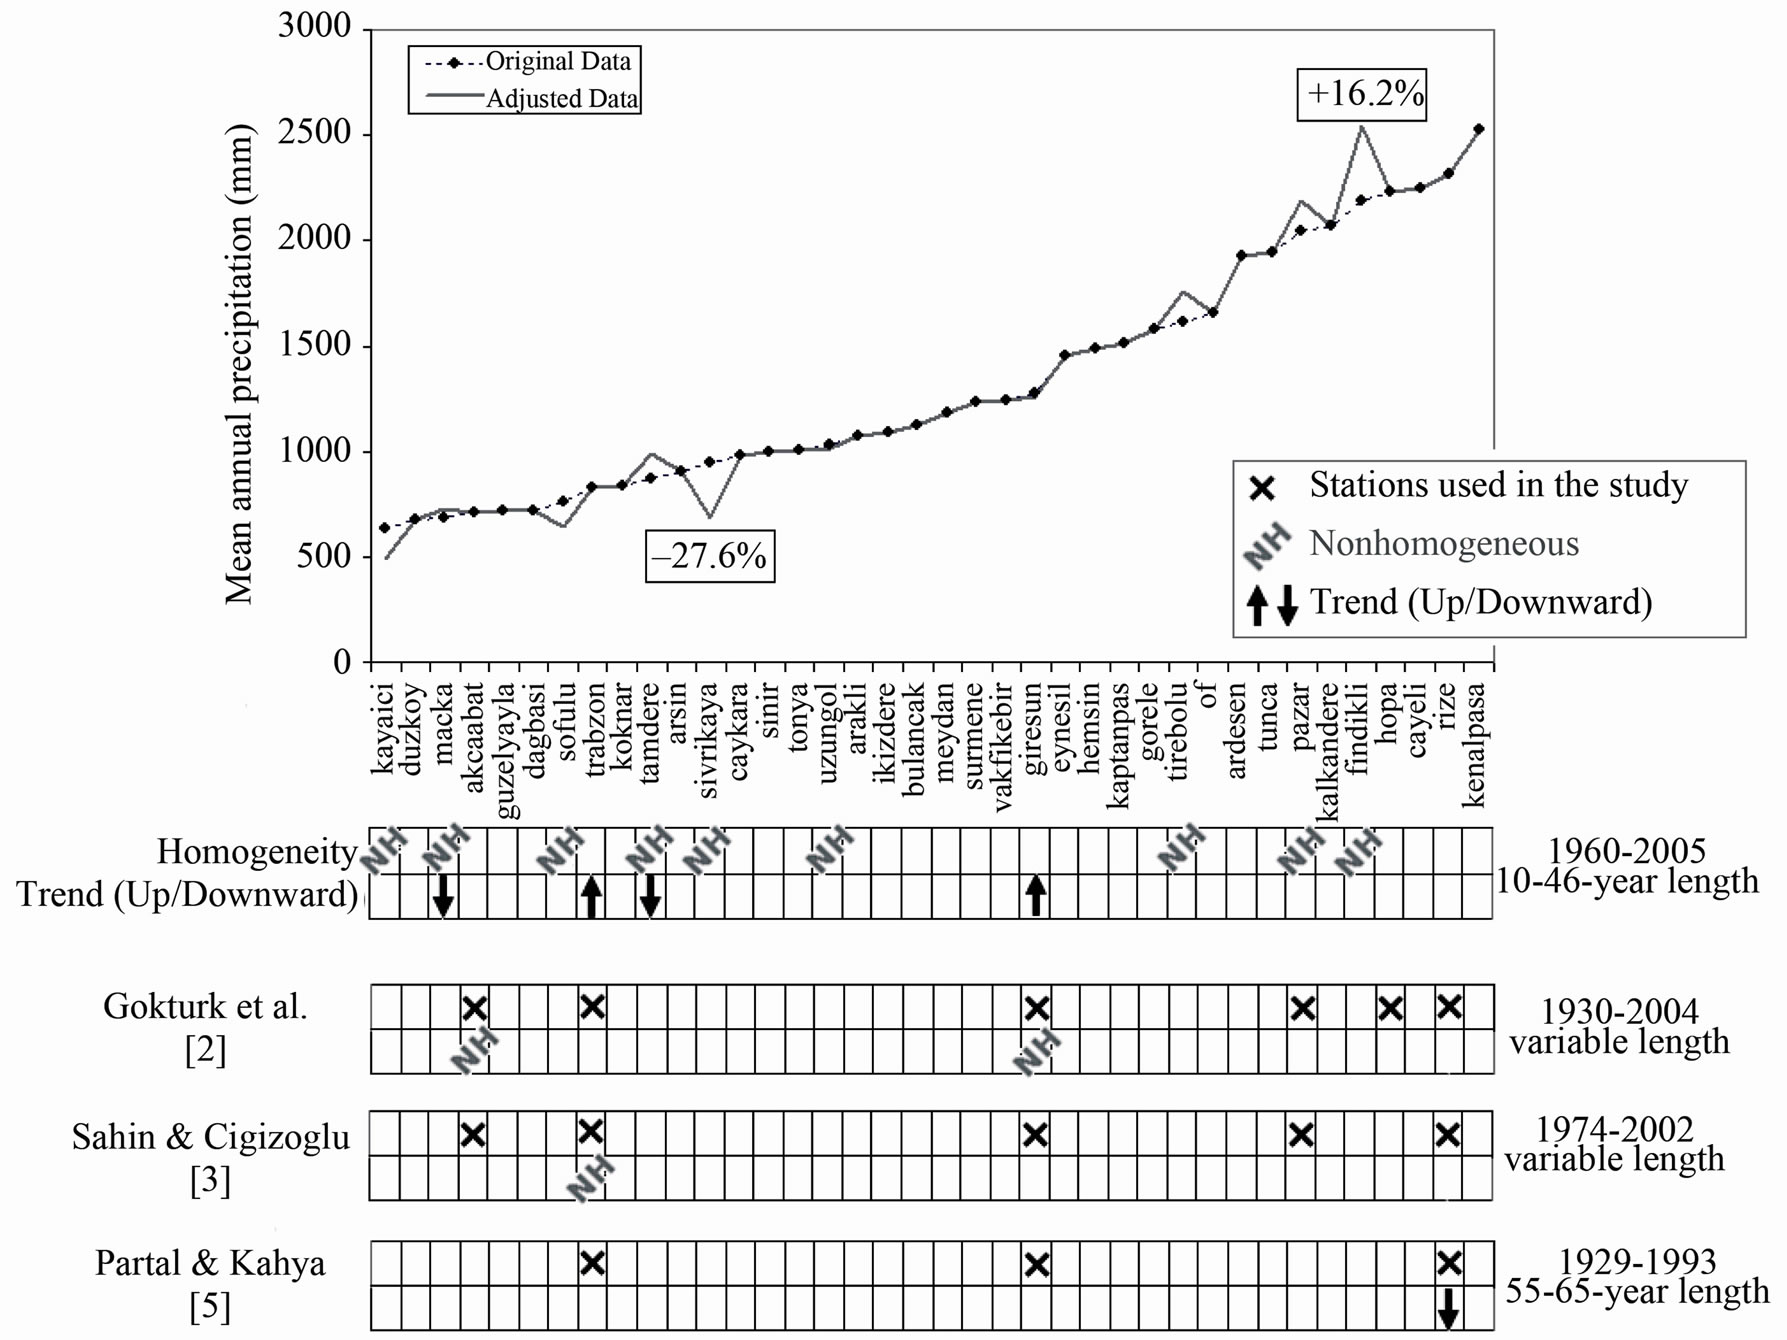
Figure 3. Results of previous and current study and the difference between original and adjusted precipitation data in percent.
Available upward/downward trends are removed from the precipitation data of 4 stations in order to compare adjusted data with observations (Figure 4). In this manner, in addition to determination of non-homogenous and/or trend-available stations, the difference between adjusted and observed data can clearly be recognized.
Positive and negative differences between adjusted and observed annual precipitation data are found as +16.2% and –27.6%, respectively. The difference between observed and adjusted data is shown in Figure 3 with the results of available upward/downward trends. In Figure 3, stations are arranged in ascending order based on their precipitation values.
For streamflow data, it was found that 22 stations out of 40 are homogeneous. For the remaining 18 stations, streamflow data are non-homogeneous. Streamflow data has been corrected using double mass curve in these 18 stations, Mann-Kendall trend test is then performed to all flow stations. Only downward trends are observed in Kanlipelit (14), Findikli (18), Agnas (19), Toskoy (28) and Topluca (34) stations.
In a previous study [15], no trend was found in the Eastern Black Sea Region according to the results of the parametric and Mann-Kendall tests applied on mean annual flow data of 12 flow stations operated by EIE with record lengths changing from 25 to 66 years.
In another previous study [14] on trend analysis of streamflow in Turkey, Dereli (4), Simsirli (26), Toskoy (28) and Topluca (34) were used as common stations, no trend was found. However, in this study a downward trend was found in stations Toskoy (28) and Topluca (34). Note that the data record length in [14] ranges from 1964 to 1994 while in this study, it covers a longer period between 1944 and 2006. From Table 1, one can realize that there are two stations named Toskoy (28 and 30) on the same stream. A trend was found in station (28) whereas no trend was available in (30). Trend was found when data in (28) was homogenized. In addition, data length is 38 years from 1965 to 2002 for station (28) and 10 years from 1986 to 2001 for (30). This shows the effect of data length on trend analysis and also depicts how controversial results can be obtained for the same region.
Reference [16] studied the trend detection over Turkey. For Eastern Black Sea Region, mean annual flow from the stations Agnas (19), Dereli (4), Simsirli (26), Topluca (34), and Toskoy (28) were used. Insignificant downward trend was found in the stations (19, 34, 28) and downward trend determined in (26) was found significant. No trend was found in (4). It should be pointed out once again that the data period is between the years of 1968- 97.
After removing available trends from the data, positive and negative differences between adjusted and observed annual mean streamflow are found as +17.5% and –8.6%, respectively. The difference between observed and adjusted data is shown in Figure 5 together with the results of available downward trends. In Figure 5, stations are arranged in ascending order based on their flow values.
5. Conclusions
In this study, homogeneity and trend-availability of mean annual precipitation and streamflow data of the Eastern Black Sea Region, Turkey were investigated by means of double mass curve method and Mann-Kendall trend test. The results are compared to previous studies on precipitation and streamflow data network across Turkey for different time periods. This comparison shows the effect of data length on trend analysis and also depicts how different results can be obtained for the same region.
Precipitation and streamflow data which have been found non-homogeneous, were first homogenized and trend, if available, was removed. The differences between observed and adjusted mean annual precipitation and streamflow data were calculated. Instead of only detection of inconsistency and/or trend in a station record, determination of difference between adjusted data and
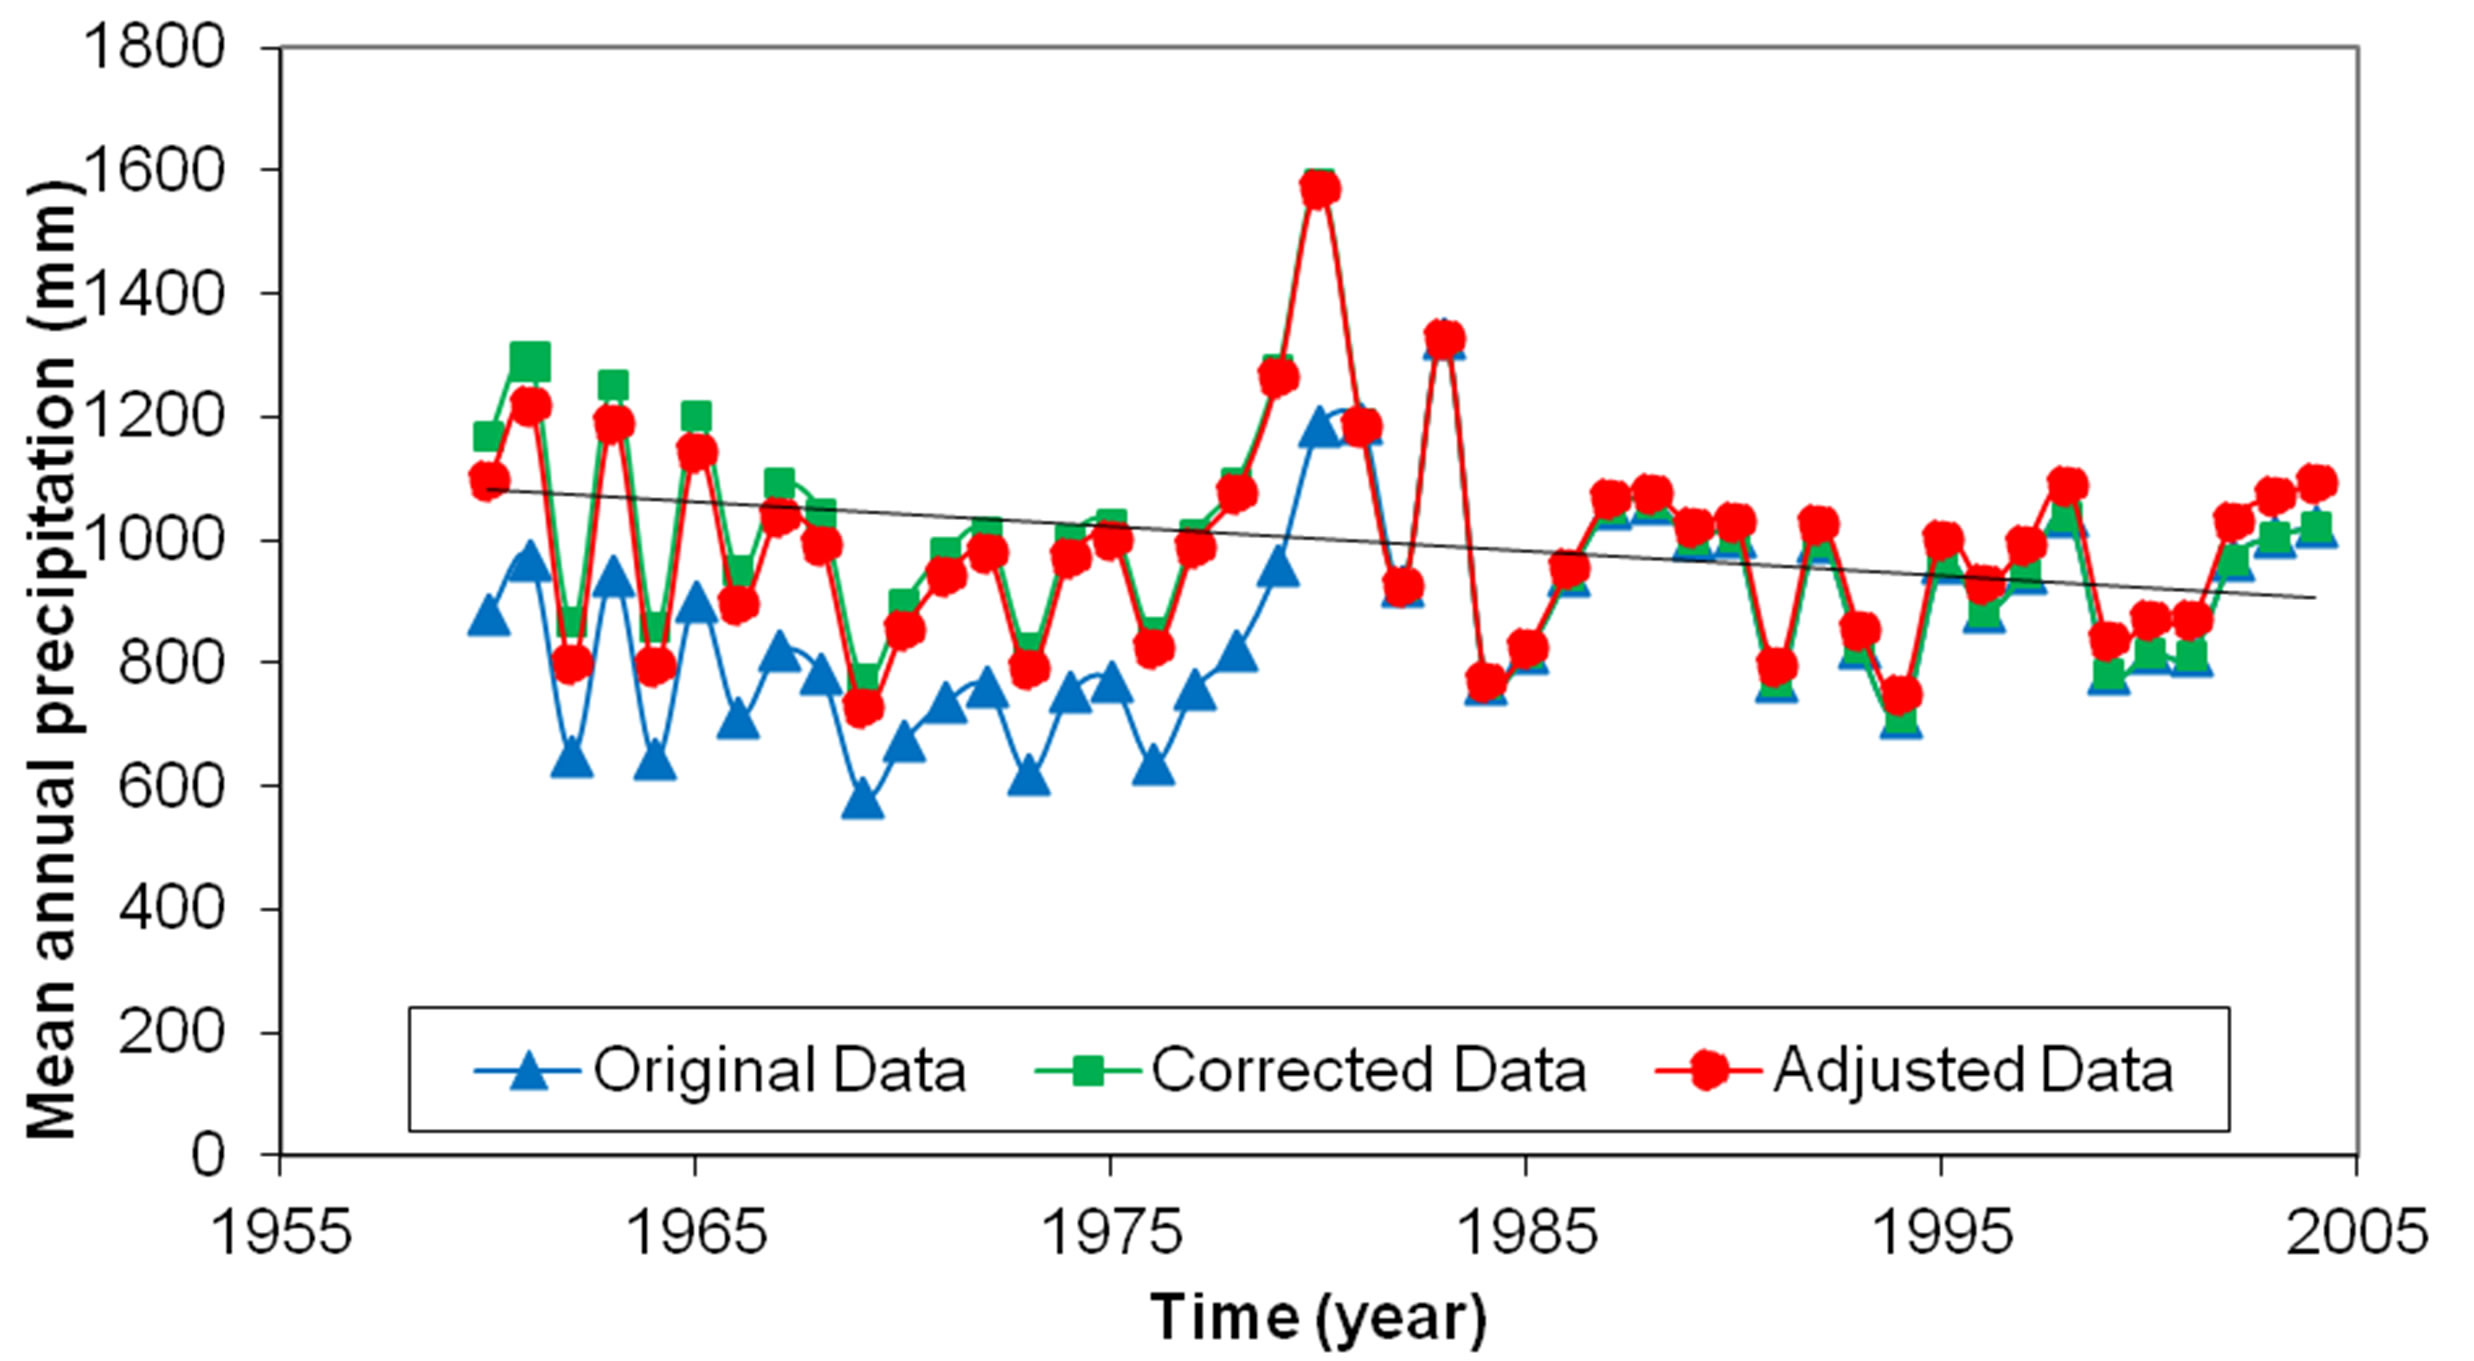
Figure 4. Original, corrected and adjusted precipitation data of Tamdere (3) station.
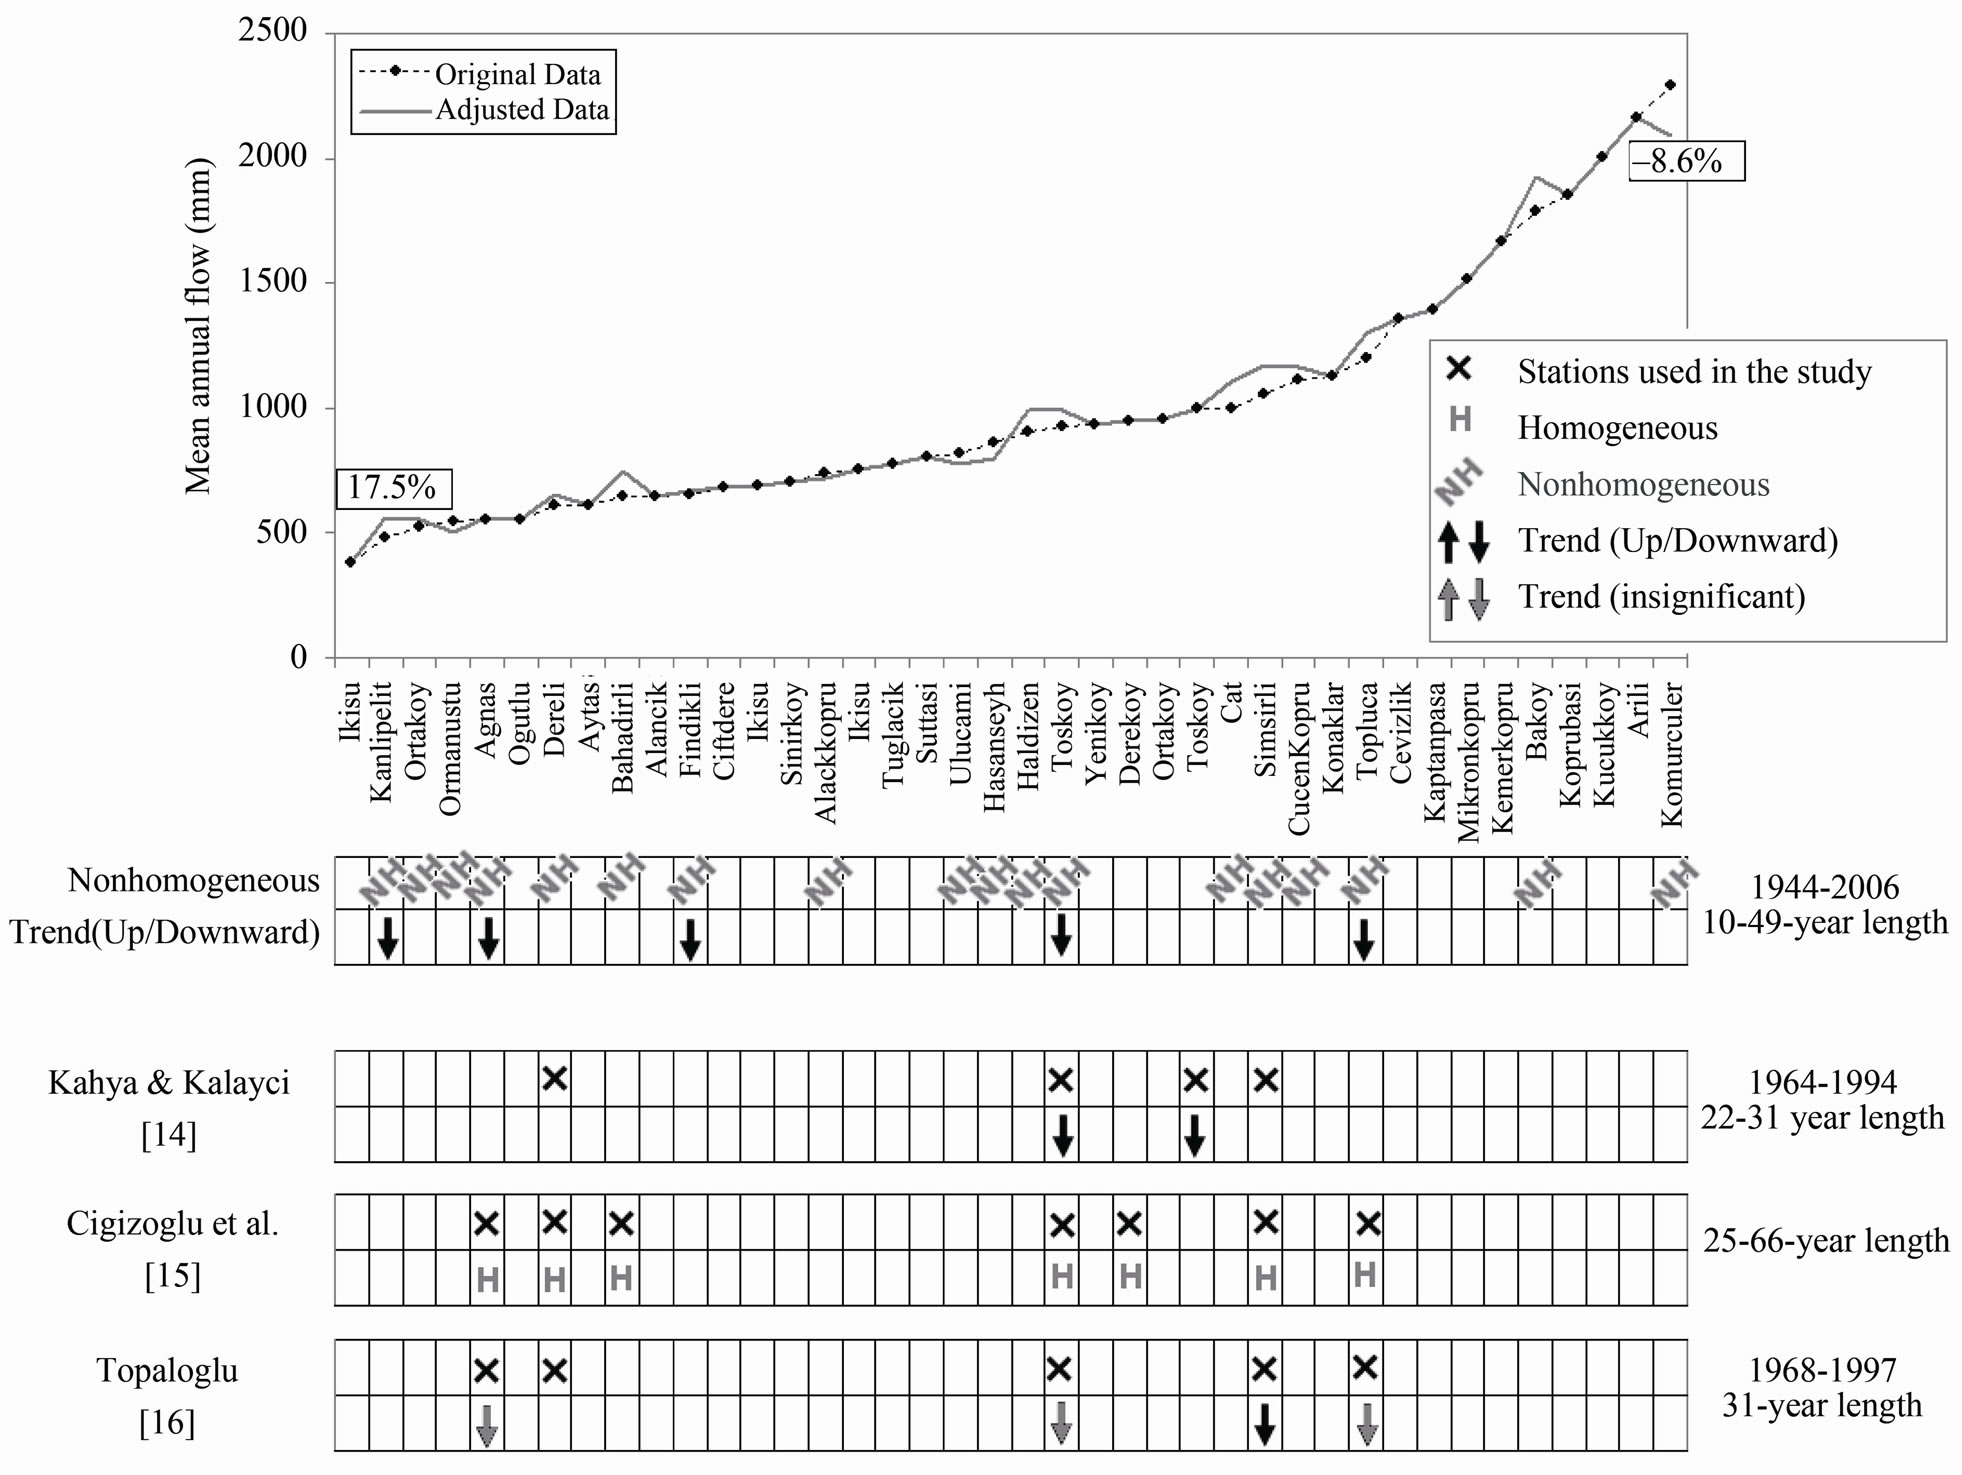
Figure 5. Results of previous and current study and the difference between original and adjusted flow data in percent.
observations is more helpful to decide which station record should be used or ignored in any hydrological and water resources application. For undeveloped and developing countries, and particularly in mountainous regions where the station network is generally inadequate, rather than ignoring any non-homogenous station record, it is suitable to follow the homogeneity and trend analysis results. When the difference between observed and adjusted data is below a specified limit, then the data set can be used with their original observation values.
REFERENCES
- IPCC, “Climate Change 2001: Impacts, Adaptation, and Vulnerability. Contribution of Working Group II to the 3rd Assessment Report of the Intergovernmental Panel on Climate Change,” Cambridge University Press, Cambridge, 2001.
- O. M. Gokturk, D. Bozkurt, O. L. Sen and M. Karaca, “Quality Control and Homogeneity of Turkish Precipitation Data,” Hydrological Processes, Vol. 22, No. 16, 2008, pp. 3210-3218. doi:10.1002/hyp.6915
- S. Sahin and H. K. Cigizoglu, “Homogeneity Analysis of Turkish Meteorological Data Set,” Hydrological Processes, Vol. 24, No. 8, 2010, pp. 981-992. doi:10.1002/hyp.7534
- M. Turkes, “Spatial and Temporal Analysis of Annual Rainfall Variations in Turkey,” International Journal of Climatology, Vol. 16, No. 9, 1996, pp. 1057-1076. doi:10.1002/(SICI)1097-0088(199609)16:9<1057::AID-JOC75>3.0.CO;2-D
- T. Partal and E. Kahya, “Trend Analysis in Turkish Precipitation Data,” Hydrological Processes, Vol. 20, No. 9, 2006, pp. 2011-2026. doi:10.1002/hyp.5993
- H. Aksoy, N. E. Unal, V. Alexandrov, S. Dakova and J. Yoon, “Hydrometeorological Analysis of Northwestern Turkey with Links to Climate Change,” International Journal of Climatology, Vol. 28, No. 8, 2008, pp. 1047- 1060. doi:10.1002/joc.1599
- M. Turkes, T. Koc and F. Saris, “Spatiotemporal Variability of Precipitation Total Series over Turkey,” International Journal of Climatology, Vol. 29, No. 8, 2009, pp. 1056-1074. doi:10.1002/joc.1768
- F. Saris, D. M. Hannah and W. J. Eastwood, “Changes in Precipitation and River Flow in Northeast Turkey: Associations with the North Atlantic Oscillation,” Proceedings of the 6th World FRIEND Conference, Fez, 25-29 October 2010, IAHS Publ.340.
- M. Turkes, U. M. Sumer and G. Kilic, “Variations and Trends in Annual Mean Air Temperatures in Turkey with Respect to Climatic Variability,” International Journal of Climatology, Vol. 15, No. 5, 1995, pp. 557-569. doi:10.1002/joc.3370150507
- M. Kadioglu, “Trends in Surface Air Temperature Data Over Turkey,” International Journal of Climatology, Vol. 17, No. 5, 1997, pp. 511-520. doi:10.1002/(SICI)1097-0088(199704)17:5<511::AID-JOC130>3.0.CO;2-0
- M. Tayanc, H. N. Dalfes, M. Karaca and O. Yenigun, “A Comparative Assessment of Different Methods for Detecting Inhomogeneities in Turkish Temperature Data Set,” International Journal of Climatology, Vol. 18, No. 5, 1998, pp. 561-578. doi:10.1002/(SICI)1097-0088(199804)18:5<561::AID-JOC249>3.0.CO;2-Y
- M. Turkes, U. M. Sumer and G. Kilic, “Re-Evaluation of Trends Changes in Mean, Maximum and Minimum Temperatures of Turkey for the Period 1929-1999,” International Journal of Climatology, Vol. 22, No. 8, 2002, pp. 947-977. doi:10.1002/joc.777
- B. Aksoy, “Variations and Trends in Global Solar Radiation for Turkey,” Theoretical and Applied Climatology, Vol. 58, No. 1-2, 1997, pp. 71-77. doi:10.1007/BF00867433
- E. Kahya and S. Kalayci, “Trend Analysis of Streamflow in Turkey,” Journal of Hydrology, Vol. 289, No. 1-4, 2004, pp. 128-144. doi:10.1016/j.jhydrol.2003.11.006
- H. K. Cigizoglu, M. Bayazit and B. Onoz, “Trends in the Maximum, Mean and Low Flows of Turkish Rivers,” Journal of Hydrometeorology, Vol. 6, 2005, pp. 280-290. doi:10.1175/JHM412.1
- F. Topaloglu, “Trend Detection of Streamflow Variables in Turkey,” Fresenius Enviromental Buletin, Vol. 15, No. 7, 2006, pp. 644-653.
- H. Aksoy, “Hydrological Variability of the European Part of Turkey,” Iranian Journal of Science and Technology, Transaction B, Engineering, Vol. 31, No. B2, 2007, pp. 225-236.
- J. K. Searcy and C. H. Hardison, “Double Mass Curves. Manual of Hydrology: Part 1. General Surface Water Techniques,” US Geological Survey, Water-Supply Paper 1541-B, 1960.
- R. M. Hirsch, J. R. Slack and R. A. Smith, “Techniques of Trend Analysis for Monthly Water Quality Data,” Water Resources Research, Vol. 18, No. 1, 1982, pp. 107- 121. doi:10.1029/WR018i001p00107
- R. M. Hirsch and J. R. Slack, “Non-Parametric Trend Test for Seasonal Data with Serial Dependence,” Water Resources Research, Vol. 20, No. 4, 1984, pp. 727-732. doi:10.1029/WR020i006p00727
- D. P. Lettenmaier, E. F. Wood and J. R. Wallis, “HydroClimatological Trends in the Continental United States, 1948-1988,” Journal of Climate, Vol. 7, 1994, pp. 586- 607. doi:10.1175/1520-0442(1994)007<0586:HCTITC>2.0.CO;2
- X. Zhang, L. A. Vincent, W. D. Hogg and A. Niitsoo, “Temperature and Precipitation Trends in Canada during the 20th Century,” Atmosphere Ocean, Vol. 38, No. 1, 2000, pp. 395-429. doi:10.1080/07055900.2000.9649654
- S. Yue and M. Hashino, “Temperature Trends in Japan: 1900-1996,” Theoretical and Applied Climatology, Vol. 75, No. 1-2, 2003, pp. 15-27.
- D. R. Helsel and R M. Hirsch, “Statistical Methods in Water Resources,” Techniques of Water Resources Investigations, Book 4, Chapter A3, US Geological Survey, 2002.
- D. S. Wilks, “Statistical Methods in the Atmospheric Sciences,” Elsevier, New York, 2006.