Journal of Water Resource and Protection
Vol.4 No.1(2012), Article ID:16735,9 pages DOI:10.4236/jwarp.2012.41006
Groundwater Quality Analysis of Safidon and Julana Blocks of District Jind, Haryana, India
1Department of Urban and Regional Planning Haryana Space Applications Centre (HARSAC)-CCS, Haryana Agricultural University, Hisar, India
2Department of Physics, S.D. College Ambala Cantt., Ambala, India
3Department of Chemistry, Singhania University, Pacheri Bari, India
4Department of Environmental Studies, Haryana College of Technology and Management (HCTM), Kaithal, India
Email: *pspundir1@gmail.com
Received October 17, 2011; revised November 22, 2011; accepted December 24, 2011
Keywords: Groundwater; Physio-Chemical; Water Quality; Jind; Safidon; Julana
ABSTRACT
We present an extensive investigation of physico-chemical parameters of water samples of Julana and Safidon blocks of District Jind, Haryana, India. Water samples were collected from different localities in cleaned polythene bottles and were analyzed for the different physico-chemical parameters like pH, electrical conductivity, total dissolved solids (TDS), total hardness (TH), calcium, magnesium, total alkalinity (TA), carbonate, bicarbonate, sodium, potassium, chloride, sulphate and fluoride. The analyzed parameters were compared with the standard desirable limits prescribed by World Health Organization (WHO), Bureau of Indian Standard (BIS) and Indian Council of Medical Research (ICMR) standards of drinking water quality parameters. For the identification of the highly correlated and interrelated water quality parameters, the correlation coefficients were calculated between different parameters and the t-test was applied for checking significance. The results showed significant variations in water quality parameters in the study areas.
1. Introduction
Water quality is an important factor in determining the human welfare. Water quality means the description of the chemical, physical and biological characteristics of water. Water is essential to life and for the harmonious development of our bodies, as it is involved in a number of biological processes. Water is used for drinking, irrigation, sanitation and many other human needs. It affects our lifestyle and economic well-being. More than three quarters of the earth’s surface is made up of water and only 2.8 percent of the earth’s water is available for human consumption and the rest 97.2 percent is in the oceans. Rapidly increasing population, rising standards of living and exponential growth of industrialization and urbanization have exposed the water resources and has degraded the water quality. The major sources of water pollution are domestic waste and industrial wastes, which are discharged into natural water bodies [1-3]. Pollutants such as herbicides, pesticides, fertilizers, hazardous polychlorinated biphenyls and synthetic organic chemicals can also make their way into water supply. Polluted ground water is a major cause for the epidemic and chronic diseases in human beings. Many investigations have found a correlation between cardiovascular deaths and water composition [4,5]. The disorder of teeth and bones is due to consumption of fluoride-rich water [6]. Carbonate and bicarbonate may originate from microbial decomposition of organic matter also. Alkalinity is big problem for industries also, as if alkaline water is used in boilers for steam generation, it may lead to precipitation of sludge, deposition of scales and causes caustic embrittlement [7]. The residential waste is discharged into the pits, ponds due to which the waste migrates down to the water table [8] and moreover there is a possibility of dissolution of rocky materials in the area.
Due to less availability and non-acceptance of surface water, people of Haryana have to depend upon groundwater resources to a large extent. In many areas of the state, ground water is the only source for drinking water. The main sources of drinking water in rural areas are fresh water body such as wells, tube-wells and hand pumps. In urban areas the municipal supply water is available only for short periods and for limited time while in rural areas the supply water is even after 4 - 5 days. Therefore, people are compelled to use ground water for drinking and cooking purposes both in rural and urban areas. The groundwater is used for the irrigation purpose as well and the irrigation schemes play a vital role in the economy of any region, state or country [9]. The problem of higher fluoride concentration, high TDS, high cation and anion concentration in groundwater has now become one of the most important toxicological and geo-environment issues in India. Recently, various groups [10-12] have analysed groundwater samples for their physiochemical parameters.
The Jind district is in the North of Haryana state of India between 29.03' and 29.51' North latitude and 75.53' and 76.47' East longitude. Panipat, Karnal and Kaithal districts, respectively, are on its East and North-East. In the West and South-West it has a common boundary with district Hisar and Fatehabad and in its South and SouthEast lie the district of Rohtak and Sonipat, respectively. Its boundary line on the North forms the inter-state Haryana-Punjab border with Patiala and Sangurar districts of Punjab. Safidon and Julana are tehsils in District Jind of Haryana state of India. Safidon is the centre of Panipat and Jind districts. It is situated on the bank of the Hansi branch of the Western Yamuna canal, 35 km northeast of Jind. Julana is located in the middle of the Rohtak and Jind districts. Entire drinking water supply to all rural as well as urban parts of the Julana and Safidon blocks of Jind district is based on groundwater from hand pumps, tube wells or by canals. The objective of this study is to present the quality of drinking water supply sources in some of the locations of Safidon and Julana blocks in District Jind, Haryana, India.
2. Sampling and Physio-Chemical Methods of Analysis
Groundwater samples from thirty six locations of Safidon block and thirty five locations of Julana block in District Jind, Haryana, India, were analyzed for their physiochemical parameters. Water samples were collected from different localities in the cleaned polythene bottles. The bottles were well rinsed before sampling and tightly sealed after collection and labelled in the field. Sampling was carried out without adding any preservative. The sampling locations are given in Table 1. The physio-chemical analysis of water samples was carried out for various quality parameters such as pH, electrical conductivity (EC), total dissolved solids (TDS), total alkalinity (TA), total
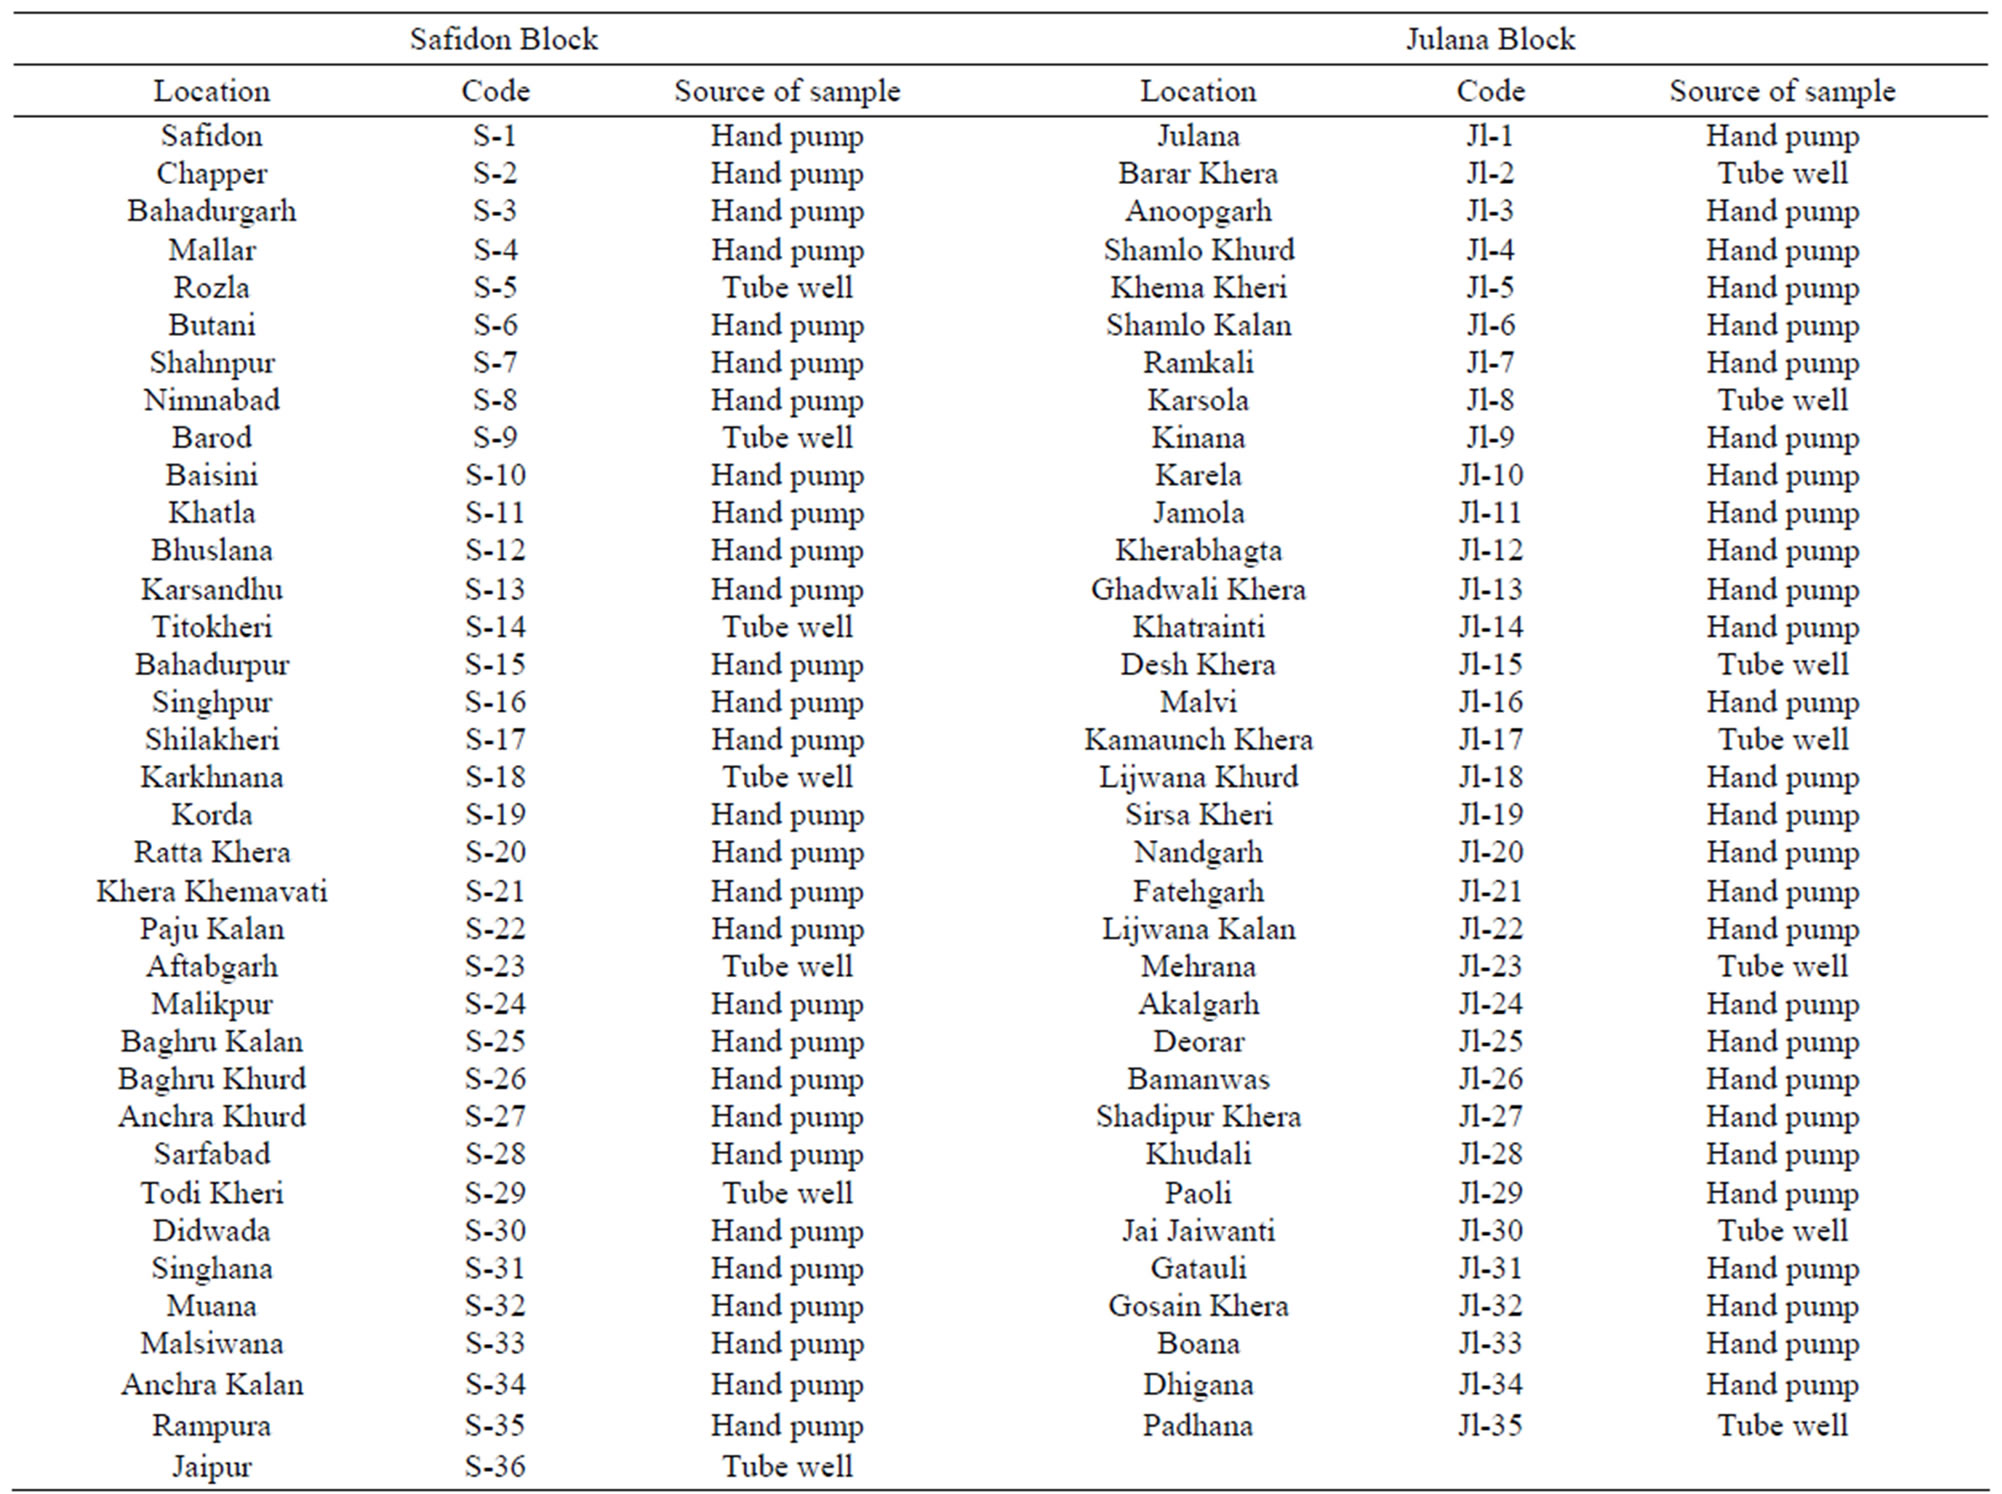
Table 1. Sampling locations of Safidon block and Julana block in District Jind, Haryana, India.
hardness (TH), sodium (Na+), potassium (K+), calcium (Ca2+), magnesium (Mg2+), carbonate  , bicarbonate
  , chloride (Cl–), sulphate
  and fluoride (F–) as per the standard procedure described by the “Standard Methods For The Examination of Water and Wastewater American Public Health Association (APHA)” [13]. The pH, EC, TDS and salinity of all the water samples were determined using digital portable kit (Electronics India, Panchkula, India). Calcium (Ca2+), Magnesium (Mg2+) and total hardness (TH) were determined by the Ethylene Diamine Tetra Acetic Acid (EDTA) titration method, Chloride (Cl–) by Argentometric titration method. The total alkalinity (TA) was determined using the titration method. Fluoride (F–) was determined using Alizarin spectrophotometer.
3. Results and Discussion
Characterizations of the physio-chemical parameters of different locations in Safidon block and Julana block of District Jind, Haryana, India are reported in Tables 2 and 3, respectively. The experimental results of the Safidon block and Julana block are compared in Tables 4 and 5, respectively, with the standard limits recommended by the World Health Organization (WHO) [14] and ISI [15]. Considerable deviations are observed in the water quality parameters from the standard limits.
3.1. pH
The permissible limits for drinking water are 7.0 - 8.5. In absence of any alternate source, water with pH 6.5 - 9.2 can be used. The pH values of the samples in Safidon block ranges from Safidon 7.2 to 9.3 with average 8.54. The pH values of the samples in Julana block ranges from 7.16 to 8.73 with average 7.84. The ground waters are slightly alkaline in nature.
3.2. Electrical Conductivity
EC of the samples from the Safidon block ranges from 1.1 mS to 5.7 mS with a mean of 2.05 mS and those of the samples from Julana block ranges from 1.12 mS to 8.07 mS with a mean of 3.46 mS.
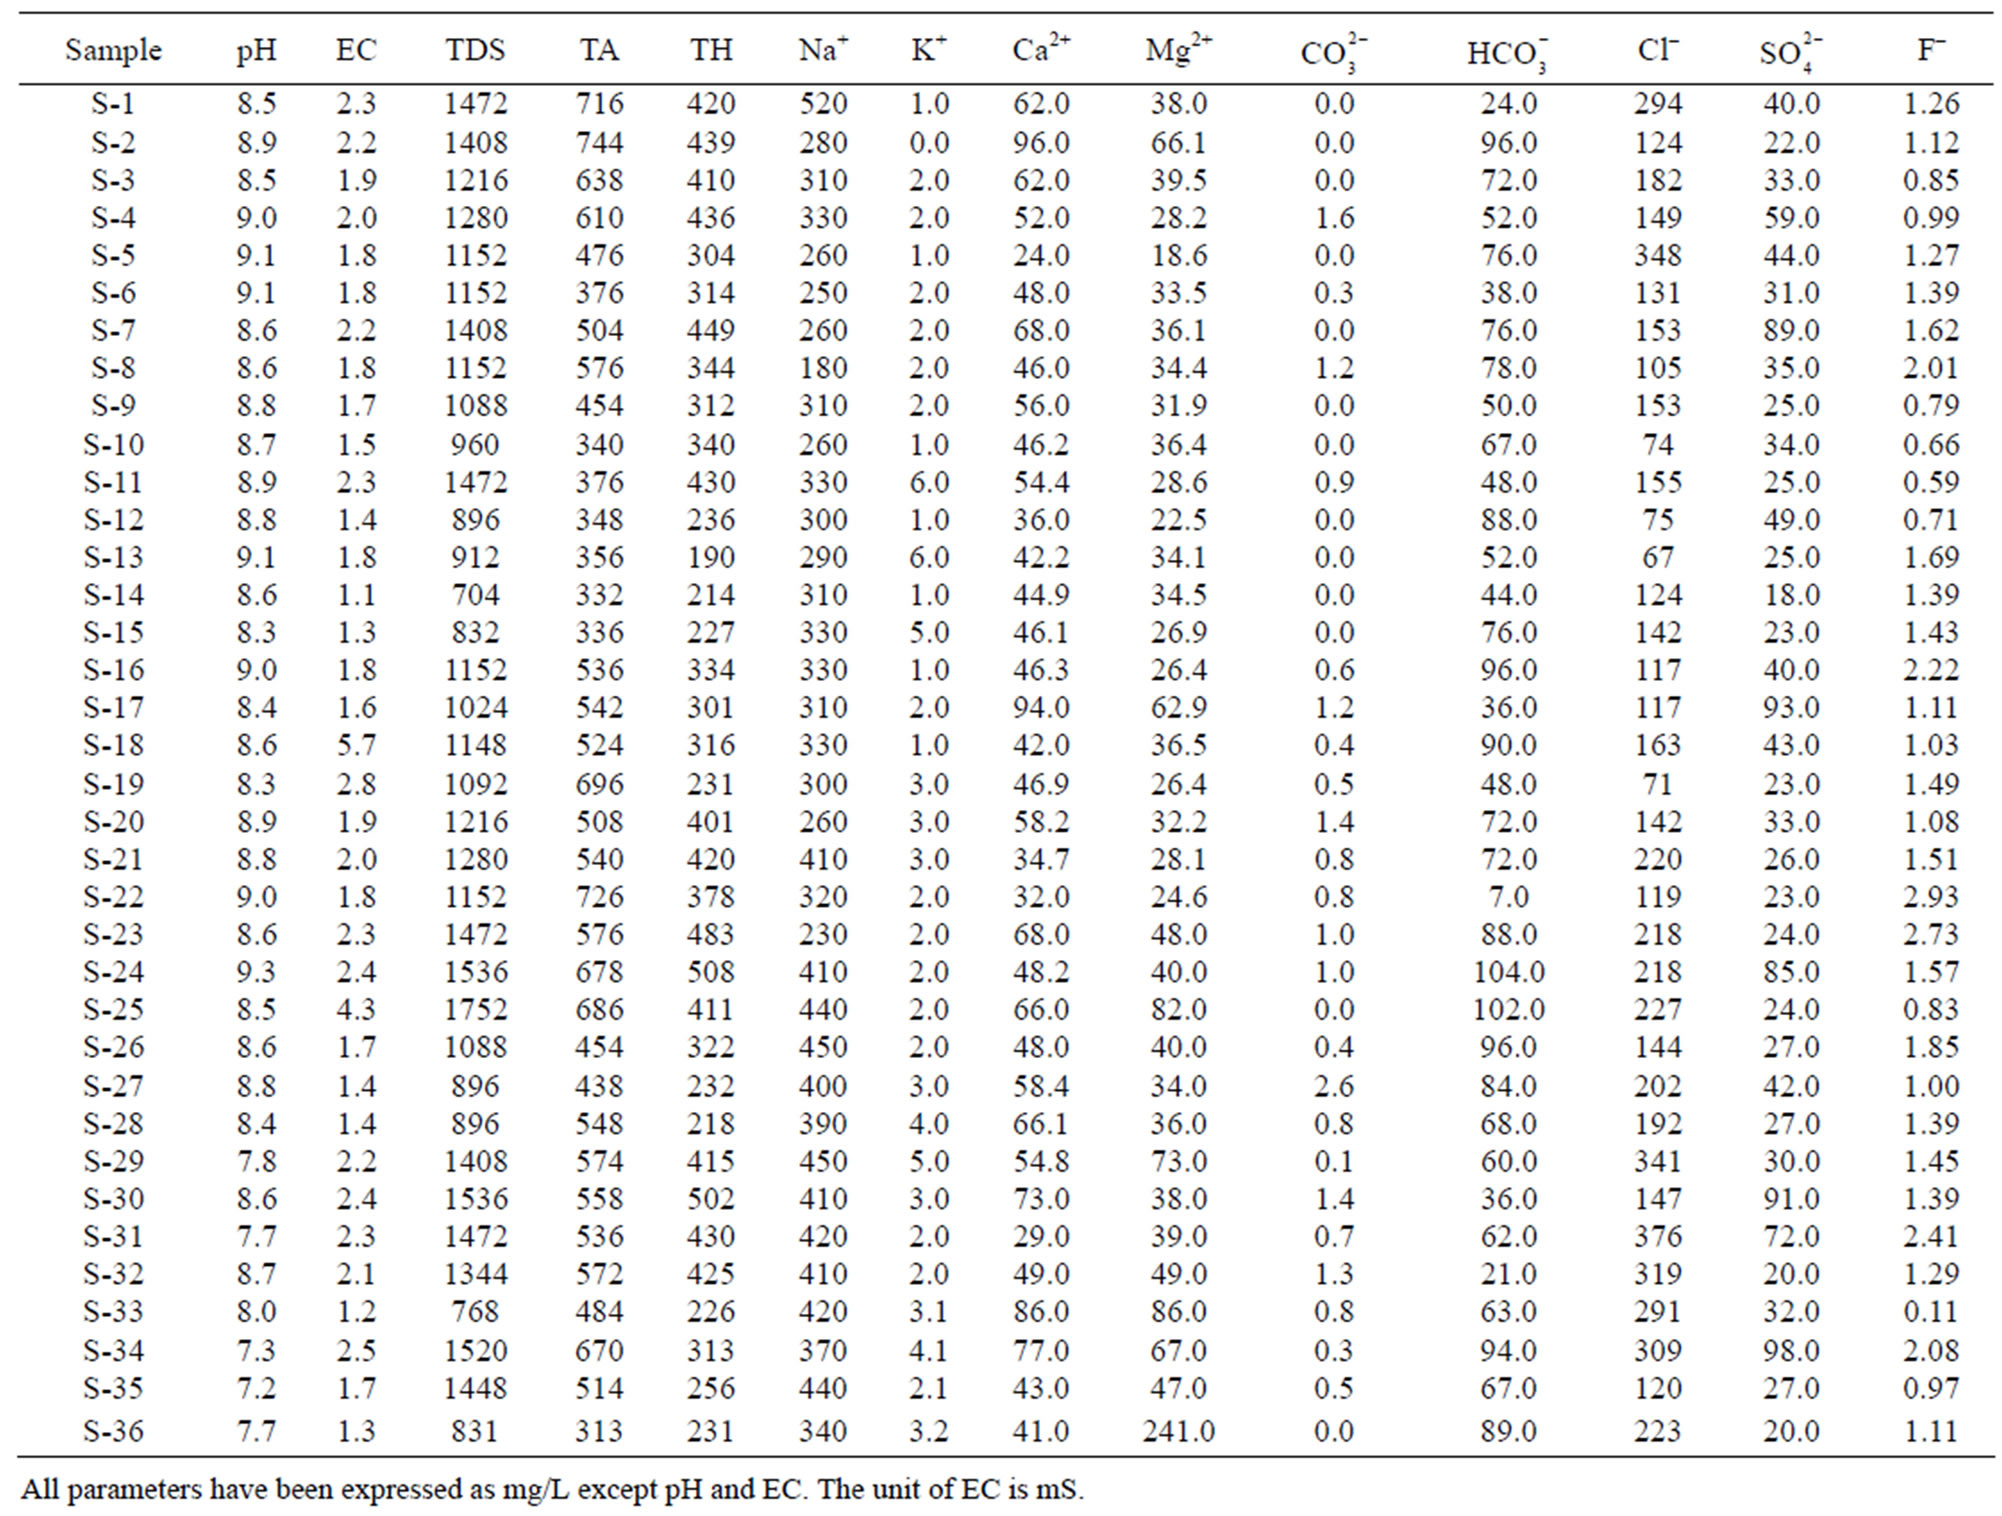
Table 2. Physico-chemical characteristics of ground water of Safidon block.
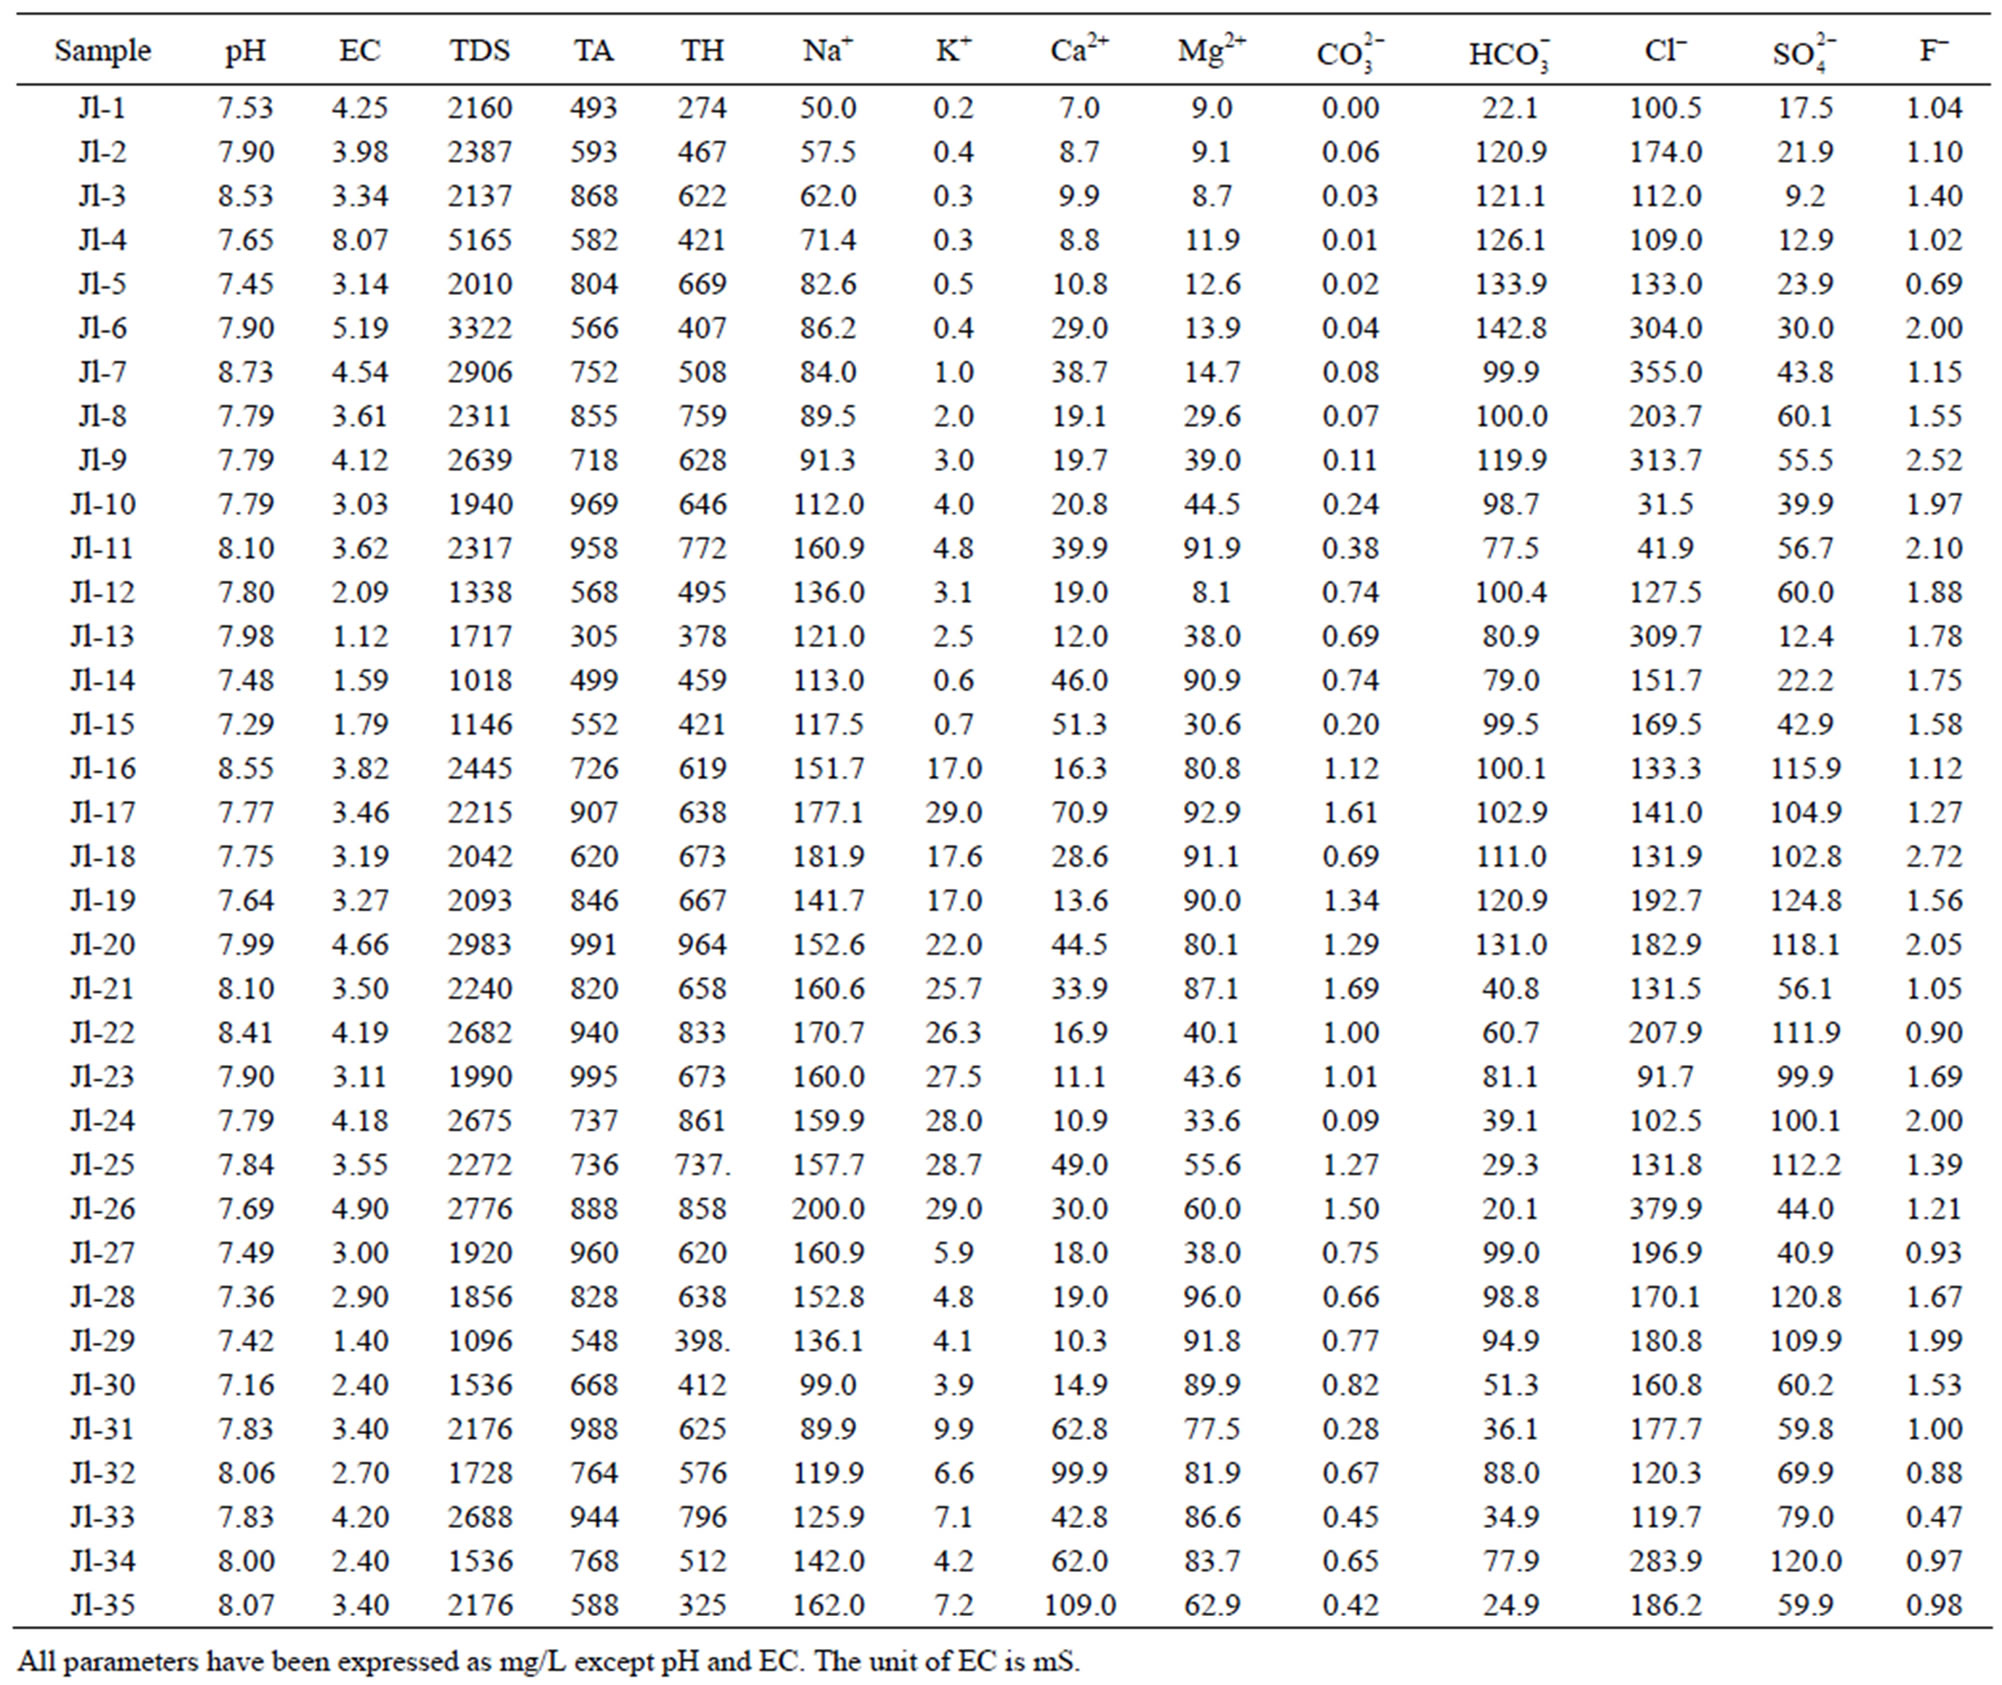
Table 3. Physiochemical characteristics of ground water of Julana block.
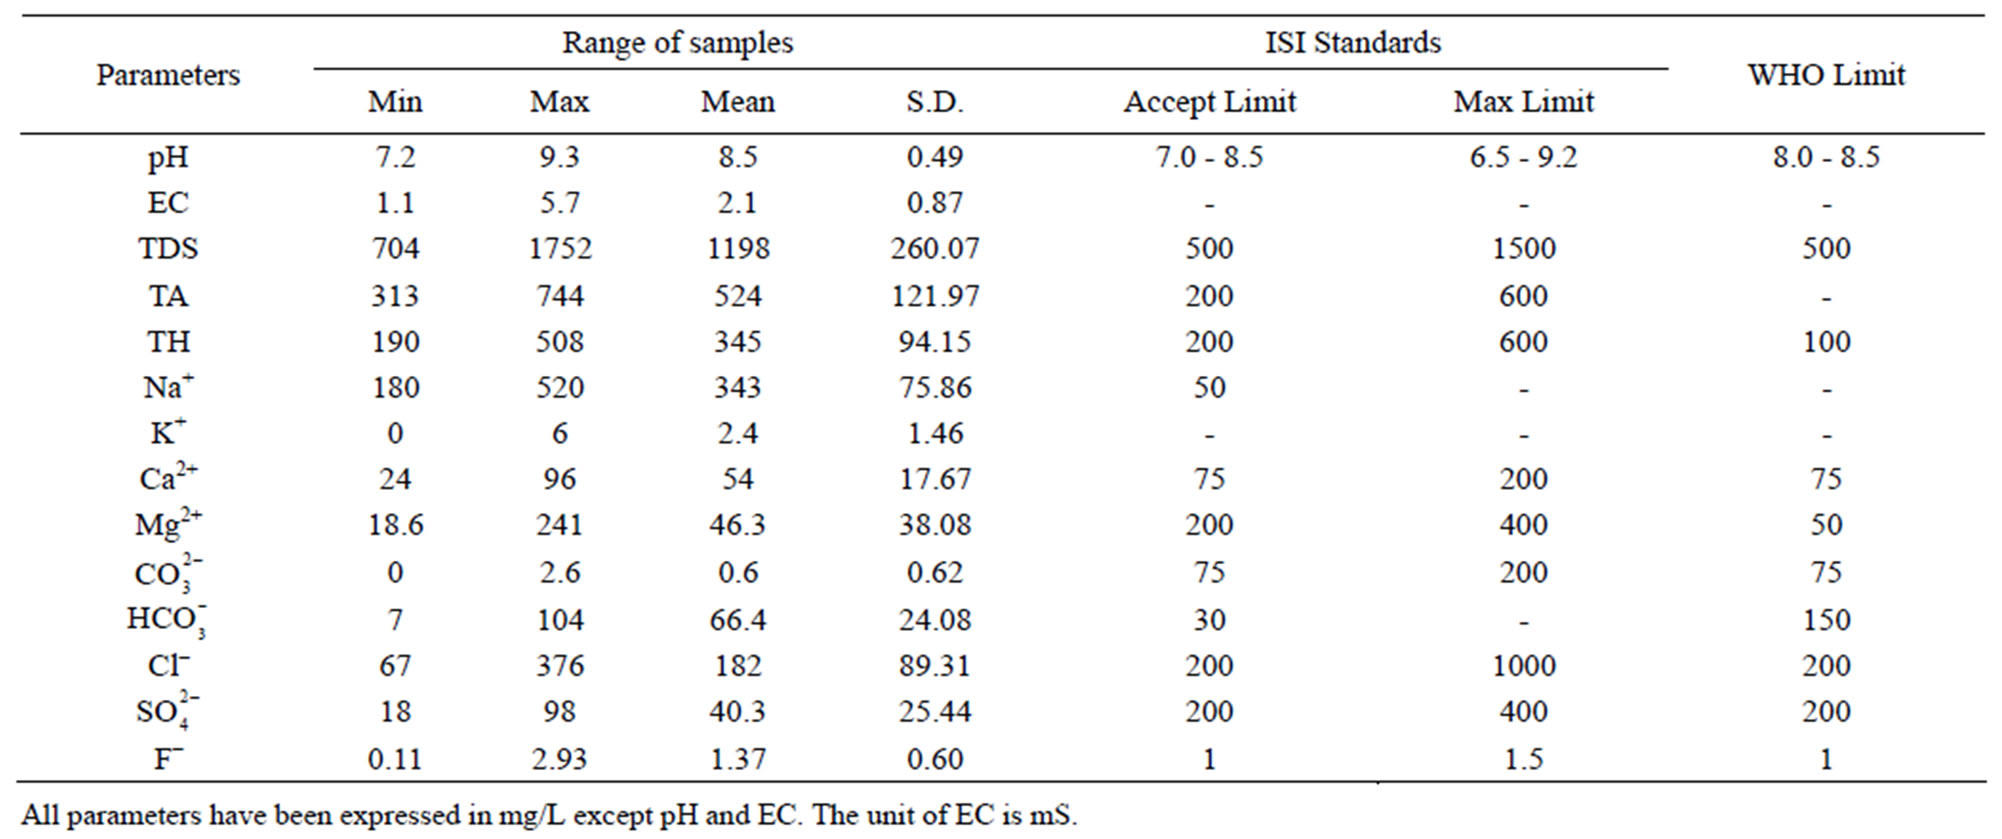
Table 4. Comparison of groundwater of Safidon block with drinking water standards (Indian and WHO).
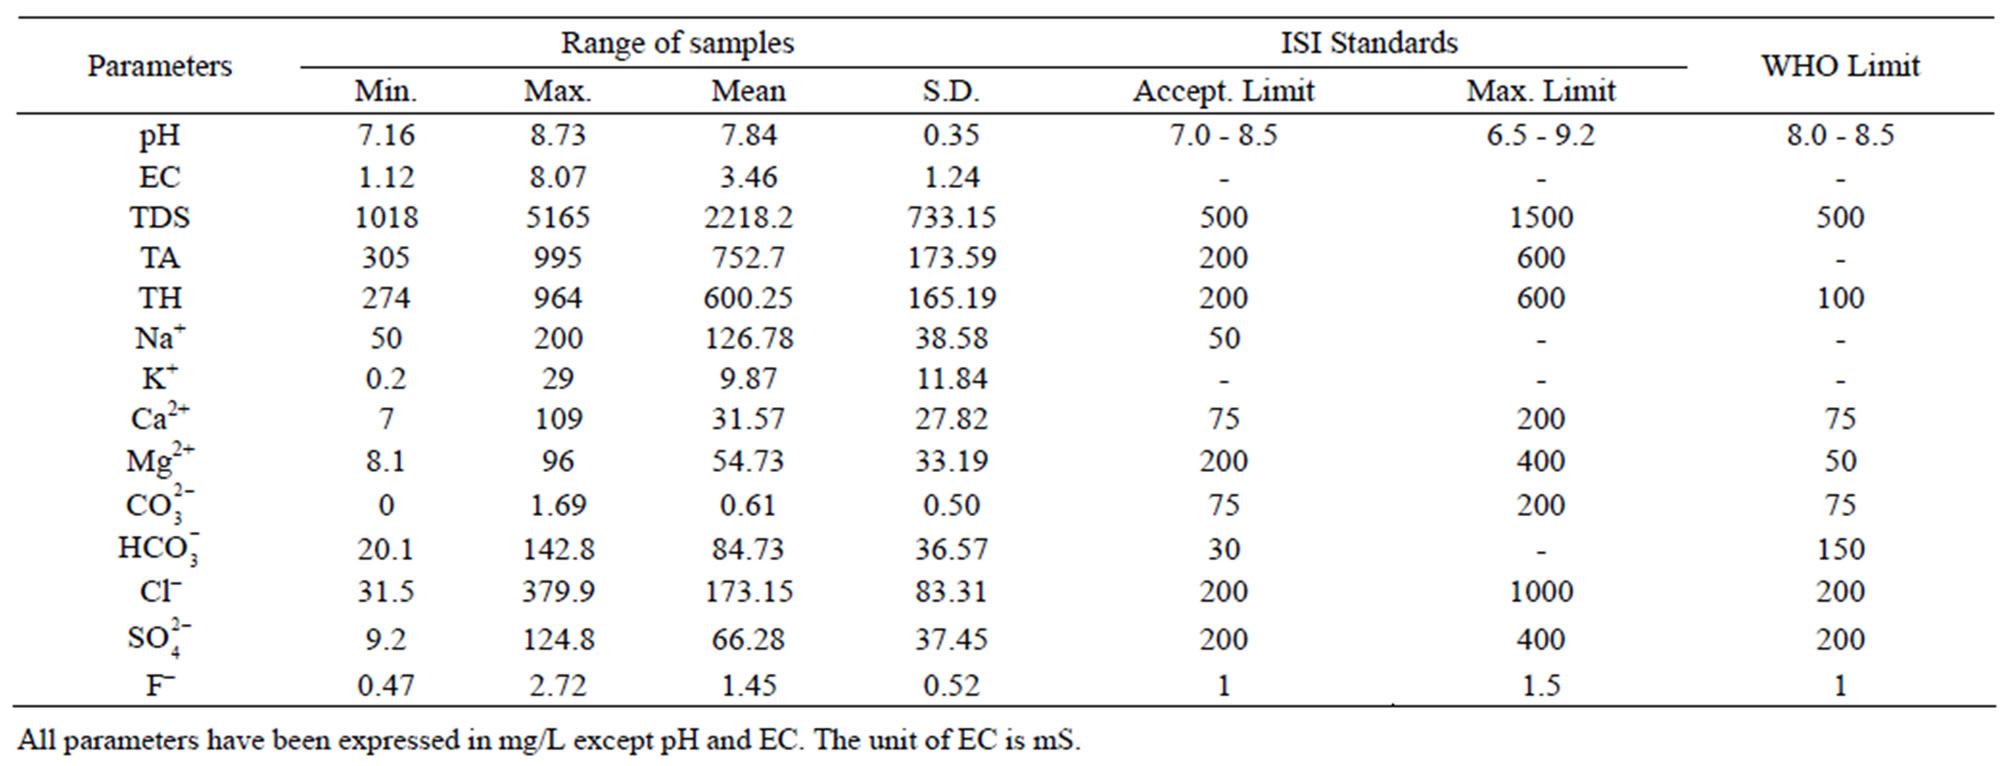
Table 5. Comparison of groundwater of Julana block with drinking water standards (Indian and WHO).
3.3. Total Dissolved Solids
According to WHO, the maximum acceptable concentration of TDS in groundwater for domestic purposes is 500 mg/L and excessive permissible limit is 1500 mg/L. TDS values of the samples from Safidon block ranges from 704 mg/L to 1752 mg/L with mean value 1198.2 mg/L. TDS values of the samples from Julana block ranges from 1018 mg/L to 5165 mg/L with a mean of 2218.2 mg/L. According to classification of drinking water on the basis of TDS values, water of 25% samples from Safidon block was found to be non-saline and water of 75% samples was found to be slightly saline. No any sample of water was found to very saline. TDS values of all samples of Julana block were greater than acceptable WHO standards (500 mg/L). Classification of drinking water of Julana and Safidon blocks of Jind district on the basis of TDS values is given in Table 6.
3.4. Total Hardness, Calcium and Magnesium
Total hardness is an important parameter of water for its use in domestic sector. Calcium and magnesium are important parameter for total hardness. The acceptable limits of Ca2+ and Mg2+ in water for domestic use are 75 and 200 mg/L respectively. In case of non-availability of alternate source of water, Ca2+ and Mg2+ limit can be extended upto 200 and 400 mg/L. In the water samples of Safidon block, the total hardness ranges from 190mg/L to 508 mg/L with a mean value 344.9 mg/L. The Ca2+ concentration ranges from 24 mg/L to 96 mg/L with a mean value of 54 mg/L. The Mg2+ value are in between 18.6 mg/L to 241 mg/L with a mean value of 46.3 mg/L. In the groundwater of Julana block, the total hardness of water samples ranges from 274 mg/L to 964 mg/L with a mean of 600.25 mg/L. Ca2+ concentration in water samples from all the locations was found to vary from 7 mg/L to 109 mg/L. Mg2+ concentration in water samples from all the locations ranged from 8.1 mg/L to 92.9 mg/L. Classification of drinking water of Julana and Safidon blocks of Jind district on the basis of TH values is given in Table 7.
3.5. Total Alkalinity, Carbonate and Bicarbonate
The acceptable limit of total alkalinity in drinking water is 200 mg/L. Beyond this limit, taste of water become unpleasant, whereas in absence of alternate water source, alkalinity upto 600 mg/L is acceptable. The values of alkalinity in the water samples of Safidon block are in between 313 mg/L to 744 mg/L. The concentration ranges from 0 mg/L to 2.6 mg/L. The concentration is between 7 mg/L to 104 mg/L. In the water samples of Julana block, the TA ranges between 305 mg/L to 995 mg/L. The average total alkalinity was 752.7 mg/L. The concentration is between 0 mg/L to 6.9 mg/L. The concentration ranges from 20.1 mg/L to 142.8 mg/L.
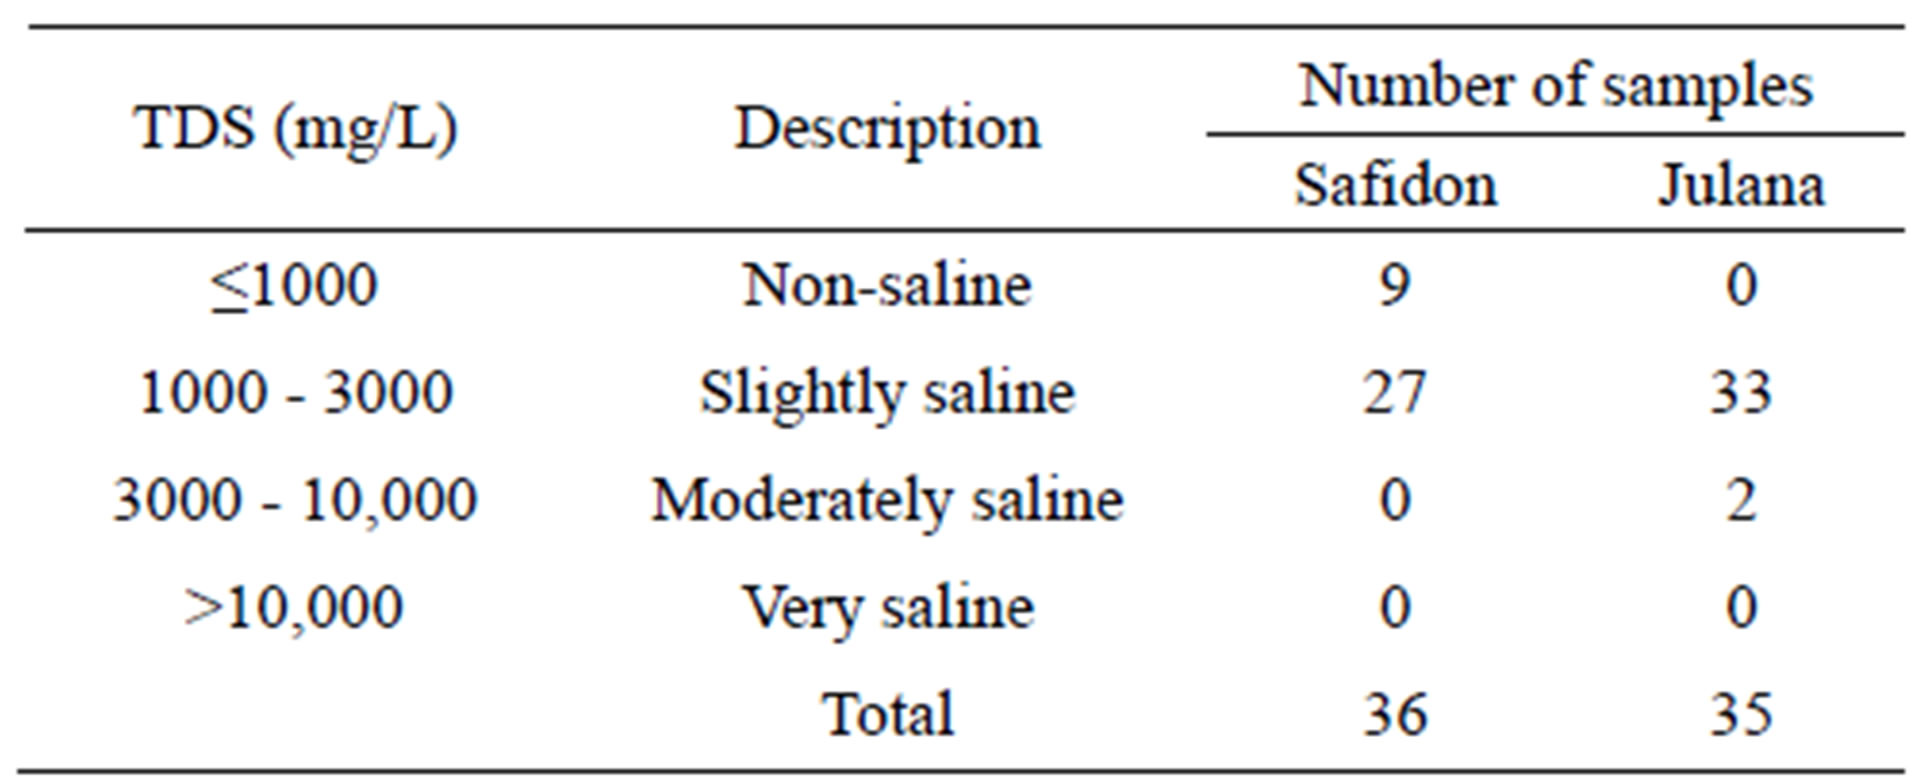
Table 6.Classification of drinking water of Julana and Safidon blocks of Jind district on the basis of TDS values.

Table 7. Classification of drinking water of Julana and Safidon blocks of Jind district on the basis of TH values.
3.6. Sodium
Sodium (Na+) concentration more than 50 mg/L makes the water unsuitable for domestic use and causes severe health problems. The Na+ concentration from all location of the Safidon block ranges between 180 mg/L to 520 mg/L with a mean value of 343.3 mg/L. In study locations of Julana block, Na+ varied from 50 mg/L to 200 mg/L. The average sodium content was 126.78 mg/L.
3.7. Potassium
The potassium (K+) concentration of the water samples from Safidon block is between 0 mg/L to 6 mg/L with a mean value of 2.45 mg/L. The K+ concentration of water samples of Julana block varied from 0.2 to 29 mg/L with an average of 9.87 mg/L.
3.8. Chloride
Maximum permissible limit of chloride in portable water is 200 mg/L, which may further be extended upto 1000 mg/L in Indian conditions. The Cl– concentration in the water samples from Safidon block is between 67 mg/L to 376 mg/L with a mean value of 182 mg/L. The Cl– content in the groundwater of Julana block ranged from 31.5 to 379.9 mg/L with a mean of 84.73 mg/L.
3.9. Sulphate
Sulphate content more than 200 mg/L is objectionable for domestic purposes. Beyond this limit,  causes gastro-intestinal irritation particularly when Mg2+ and Na+ are also present in groundwater. This permissible limit of 200 mg/L may be extended upto 400 mg/L of
  provided Mg2+ does not exceed 30 mg/L. Waters containing
  beyond 1000 mg/L have purgative effects. Sulphate may undergo transformation to sulphur and sulphur oxides depending upon redox potential of water. In the groundwater of Safidon block,
  ranged from 18 to 98 mg/L with a mean of 40.3 mg/L. The
  content at all locations was lower than maximum permissible prescribed limit. In the groundwater of Julana block
  is between 9.2 mg/L to 124.8 mg/L with a mean of 66.28 mg/L.
3.10. Fluoride
The permissible limit of fluoride in drinking water is 1.0 mg/L, which can be extended to 1.5 mg/L in case of nonavailability of other water sources. Higher fluoride level in drinking water gives rise to dental decay and physical deformation. The dreaded disease “fluorosis” is a result of intake of high fluoride laden in drinking water. In the groundwater of Safidon block, fluoride content ranged from 0.11 to 2.93 mg/L. It has been observed that ground water of 9 samples contained higher fluoride concentration than prescribed limits. The average F– content was 1.37 mg/L. In the groundwater of Julana block, fluoride content ranged from 0.47 to 2.72 mg/L. It has been observed that ground water contained higher fluoride concentration than prescribed limits. The average F‑ content was 1.45 mg/L.
3.11. Statistical Analysis
Study of correlation reduces the range of uncertainty associated with decision making. The correlation coefficient “r” was calculated using the equation

The correlation matrix for the water quality parameters of Safidon block are given in Table 8 and that for the Julana block are given in Table 9.
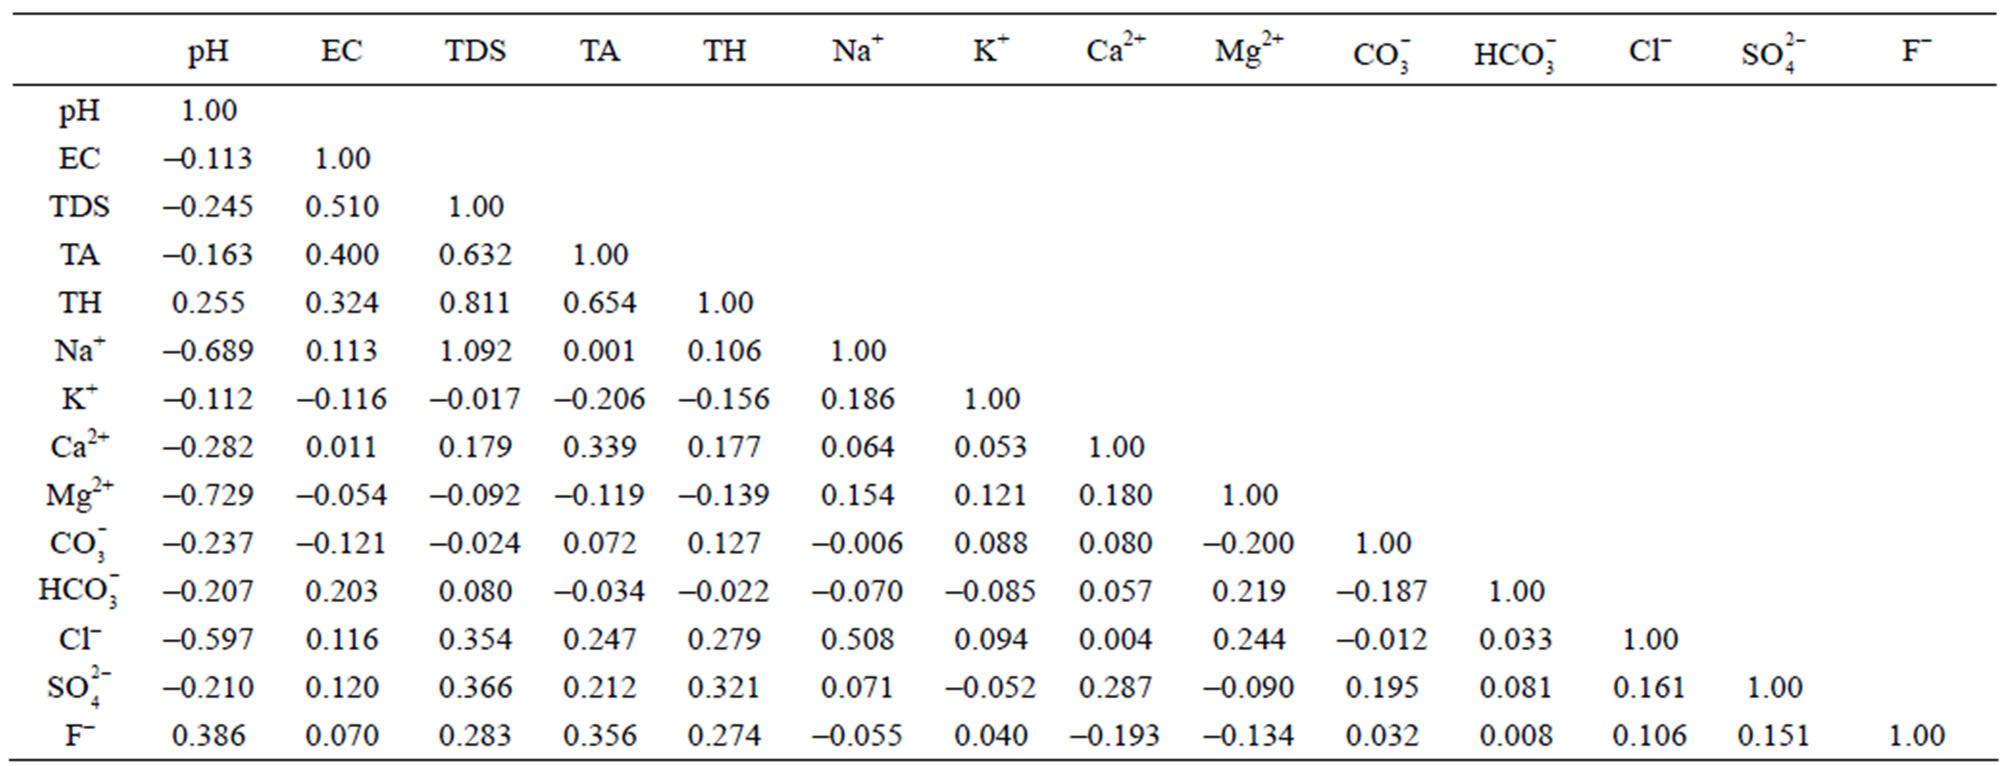
Table 8. Correlation coefficients among different water quality parameters of ground water of Safidon block.
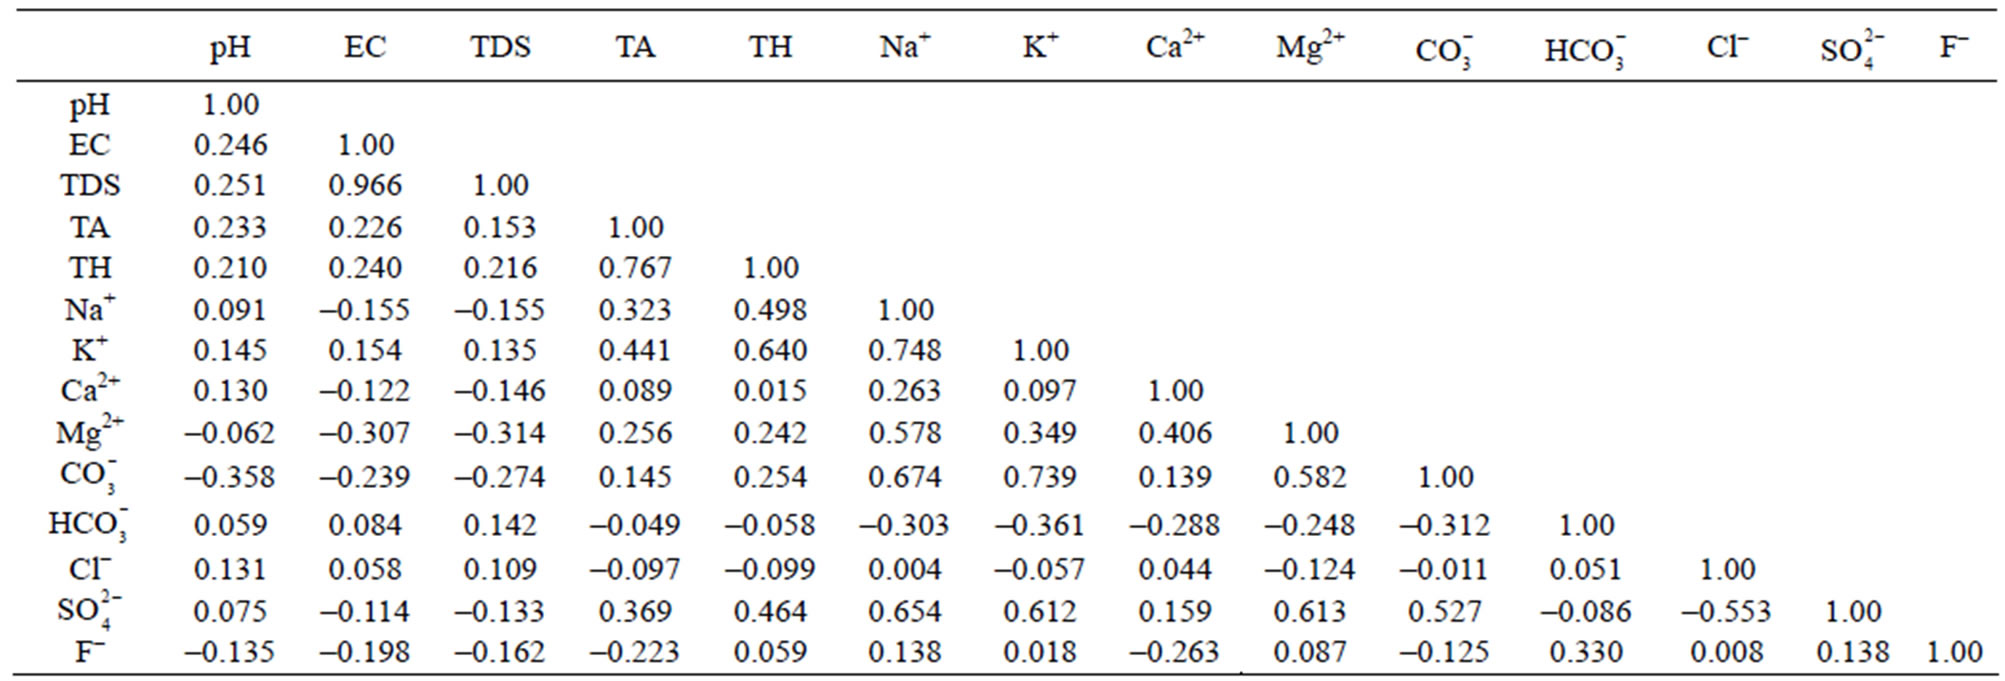
Table 9. Correlation coefficients among different water quality parameters of ground water of Julana block.
The groundwater samples of Safidon block are alkaline in pH. It is significantly but positively correlated with total hardness and fluoride. pH is negatively correlated with electrical conductivity, total alkalinity, total dissolved solids, sodium, potassium, calcium, magnessium, carbonate, bicarbonate, chloride and sulphate. Electrical conductivity is significantly but positively correlated with total dissolved solids, total alkalinity, total hardness, sodium, calcium, bicarbonate, chloride, sulphate and fluoride. It is negatively correlated with pH, potassium, magnessium and carbonate. Total dissolved solids is positively correlated with electrical conductivity, total alkalinity, total hardness, sodium, calcium, bicarbonate, chloride, sulphate and fluoride. It is negatively correlated with pH, potassium, magnessium and carbonate. Total hardness is positively correlated with pH, electrical conductivity, total alkalinity, total dissolved solids, sodium, calcium, carbonate, chloride, sulphate and fluoride. It is negatively correlated with potassium, magnessium, and bicarbonate. Total alkalinity is positively correlated with electrical conductivity, total dissolved solids, total hardness, sodium, calcium, carbonate, chloride, sulphate and fluoride. It is negatively correlated with pH, potassium, magnessium and bicarbonate. All the water samples had chloride content within the acceptable limit. The correlation matrix shows that it is positively correlated with electrical conductivity, total dissolved solids, total alkalinity, total hardness, sodium, potassium, potassium, calcium, magnessium, bicarbonate, sulphate and fluoride. It is negatively correlated with pH and carbonate. Sodium is positively correlated with electrical conductivity, total dissolved solids, total alkalinity, total hardness, potassium, calcium, magnessium, chloride and sulphate. It is negatively correlated with pH, carbonate, bicarbonate and fluoride. Potassium is significantly but positively correlated with sodium, calcium, magnessium, carbonate, chloride and fluoride. It is negatively correlated with pH, electrical conductivity, total dissolved solids, total alkalinity, total hardness, bicarbonate and sulphate. Sulphate is positively correlated with electrical conductivity, total dissolved solids, total alkalinity, total hardness, sodium, bicarbonate, calcium, carbonate, chloride and fluoride. It is negatively correlated with pH, potassium and magnessium. Fluoride is significantly but positively correlated with pH, electrical conductivity, total dissolved solids, total alkalinity, total hardness, potassium, carbonate, bicarbonate, chloride and sulphate. It is negatively correlated with sodium, calcium and magnessium.
The groundwater from different locations of Julana block is slightly alkaline in pH. The correlation matrix shows that pH is positively correlated with electrical conductivity, total dissolved solids, total alkalinity, total hardness, sodium, potassium, chloride, calcium, sulphate and bicarbonate; and negatively correlated with fluoride, magnessium, and carbonate. Electrical conductivity is positively correlated with total dissolved solids, total alkalinity, total hardness, potassium, chloride, bicarbonate and pH. It is negatively correlated with magnessium, sulphate, sodium, carbonate, calcium and fluoride. Total dissolved solids is significantly and positively correlated with total alkalinity, total hardness, potassium, bicarbonate, chloride, pH and electrical conductivity; and negatively correlated with carbonate, sulphate, fluoride, calcium, magnessium and sodium. Total hardness is positively correlated with pH, electrical conductivity, total dissolved solids, total alkalinity, magnessium, calcium, potassium, sodium, sulphate, fluoride, carbonate; and is negatively correlated with chloride and bicarbonate. At 25 locations total alkalinity was higher than maximum prescribed limit, while all other samples fall within the maximum permissible limit. Total alkalinity is positively correlated with pH, electrical conductivity, total dissolved solids, sodium, sulphate, potassium, total hardness, calcium, magnessium, and carbonate; and significantly and negatively correlated with bicarbonate, chloride and fluoride. The bicarbonate content varied from 20.1 to 142.8 mg/L. The mean bicarbonate content was 84.73 mg/L. From the results it can be concluded that alkalinity is mainly due to bicarbonate. The sodium content at all the studied sites was higher than 50 mg/L. The correlation analysis shows that sodium is significantly and positively correlated with pH, total alkalinity, total hardness, potassium, calcium, magnessium, carbonate, chloride, sulphate and fluoride. Sodium is negatively correlated with bicarbonate, electrical conductivity and total dissolved solids. Potassium is significantly and positively correlated with pH, electrical conductivity, total dissolved solids, total alkalinity, total hardness, sodium, calcium, magnesium, carbonate, fluoride, sulphate; and it is significantly and negatively correlated with chloride and bicarbonate. The chloride is positively correlated with pH, electrical conductivity, total dissolved solids, sodium, calcium, bicarbonate and fluoride. It is negatively correlated with total alkalinity, total hardness, potassium, magnessium, carbonate and sulphate. The sulphate content at four locations was higher than the prescribed maximum permissible limit. The statistical analysis shows that sulphate is significantly and positively correlated with pH, total alkalinity, total hardness, sodium, potassium, calcium, magnessium, carbonate and fluoride. It is negatively correlated with electrical conductivity, total dissolved solids, bicarbonate and chloride. The fluoride is significantly and positively correlated with total hardness, sodium, potassium, magnessium, bicarbonate, chloride and sulphate. It is negatively correlated with pH, total alkalinity, electrical conductivity, total dissolved solids, calcium and carbonate.
4. Conclusion
The investigation on survey and characterization of groundwater samples from two blocks of Jind district, Haryana, India was carried. Seventy one samples were collected from running tube wells and hand pumps. The water samples were analyzed for pH, EC, soluble cations (Ca2+, Mg2+, Na2+, K+) and anions ( ,
, , Cl–,
  and F–) following the standard procedures. The water quality parameters were compared with the standard desirable limits prescribed by World Health Organization (WHO), Bureau of Indian Standard (BIS) and Indian Council of Medical Research (ICMR) standards of drinking water quality parameters. On the basis of above analysis following conclusion have been drawn out of 36 samples of ground water from Safidon block, 19 samples of water may be used directly for drinking purpose & remaining 17 samples require one or another kind of treatment before drinking. A special attention for removal of hardness is required as all the samples are found to be of very hard category. Out of 35 samples of groundwater from Julana block, all samples require one or another kind of treatment before drinking. A special attention for removal of hardness is required as all the samples are found to be of very hard category. Taking hardness in to consideration it appears that about 93% of groundwater of Safidon block and Julana block of Jind district is not fit for human consumption.
5. Acknowledgements
One of the authors Prem Singh acknowledges the financial assistance in the form of minor research project from University Grant Commission, New Delhi.
REFERENCES
- V. K. Garg, A. Chaudhary, Deepshikha and S. Dahiya, “An Appraisal of Groundwater Quality of Some Villages of Jind District,” Indian Journal of Environmental Protection, Vol. 19, No. 4, 1999, pp. 267-272.
- P. Singh, J. P. Saharan, K. Sharma and S. Saharan, “Physio-Chemical & EDXRF Analysis of Groundwater of Ambala, Haryana, India,” Researcher, Vol. 2, No. 1, 2010, pp. 68-75.
- P. Singh and J. P. Saharan, “Elemental Analysis of Satluj River Water Using EDXRF,” Nature & Science, Vol. 8, No. 3, 2010, pp. 24-28.
- R. Pitt, M. Lalor and M. Brown, “Urban Stormwater Toxic Pollutants: Assessment, Sources, and Treatability,” Water Environment Research, Vol. 67, No. 3, 1995, pp. 260-275. doi:10.2175/106143095X131466
- M. M. Olı́as, J. M. Nieto, A. M. Sarmiento, J. C. Cerón and C. R. Cánovas, “Seasonal Water Quality Variations in a River Affected by Acid Mine Drainage: The Odiel River (South West Spain),” Science of the Total Environment, Vol. 33, 2004, pp. 267-281.
- A. K. Susheela, “Fluorosis Management Programme in India,” Current Science, Vol. 77, No. 10, 1999, pp. 1250- 1256.
- S. Sharma, “Physico-Chemical Characterization of Underground Water in Matsya Industrial Area of Alwar City and Its Comparison with Underground Water in Sanganer Industrial Area of Jaipur City,” Asian Journal of Chemistry, Vol. 16, 2004, pp. 309-313.
- C. E. Renn, “Investigating Water Problems,” LaMotte Chemical Products Company, Chestertown, 1970.
- S. M. Yidana, P. A. Sakyi and G. Stamp, “Analysis of the Suitability of Surface Water for Irrigation Purposes: The Southwestern and Coastal River Systems in Ghana,” Journal of Water Resource and Protection, Vol. 3, No. 10, 2011 pp. 695-710.
- R. Reza and G. Singh, “Physio-Chemical Analysis of Ground Water in Angul-Talcher Region of Orissa, India,” Journal of American Science, Vol. 5, No. 5, 2009, pp. 53- 58.
- K. K. Sivakumar, C. Balamurugan, D. Ramakrishnan and L. L. Hebsibai, “Study on Physicochemical Analysis of Ground Water in Amaravathi River Basin at Kakur (Tamil Nadu), India,” International Journal of Water Resources Development, Vol. 1, No. 1, 2011, pp. 36-39.
- K. S. Kumar and R. R. Kumar, “Analysis of Water Quality Parameters of Groundwater near Ambattur Industrial Area, Tamil Nadu, India,” Indian Journal of Science and Technology, Vol. 4, No. 5, 2011, pp. 660-662.
- APHA (American Public Health Association), Standard Methods for Analysis of Water and Waste Water, 18th Edition, American Public Health Association, Inc, Washington DC, 1992.
- WHO, Guidelines for Drinking Water Quality, Vol. 1, Recommendations WHO, World Health Organization, Geneva, 1984.
- BIS, Specification for Drinking water ISI: 10500, Bureau of Indian Standards, New Delhi, 1991.
NOTES
*Corresponding author.