Journal of Water Resource and Protection
Vol. 3 No. 12 (2011) , Article ID: 16401 , 12 pages DOI:10.4236/jwarp.2011.312099
Automated Watershed Evaluation of Flat Terrain
Geology Department, Technische Universität Bergakademie Freiberg, Freiberg, Germany
E-mail: sameh.wisam@web.de, merkel@geo.tu-freiberg.de
Received September 25, 2011; revised October 26, 2011; accepted November 29, 2011
Keywords: Watershed Delineation, Algorithms, Catchment, Digital Terrain Model
ABSTRACT
Catchment area and watershed delineation is a common task in hydrology. The determination of the catchment is still as a challenge considered being crucial key issues particular in flat terrains. Three concepts could be briefly identified through: the manual delineation of a catchment based on a topographic map with contour lines which is a difficult task for flat terrains, by combination of field survey or evaluation of satellite images. The present research is focus on evaluating the possibility to delineate catchments from flat and arid areas by means of DTM avoiding hard techniques like river burning or other manual hydrological DTM corrections. Three GIS packages were used (Arc Hydrotools, TNTmips and RiverTools) within two DEM: the 90 m and 30 m SRTM in addition to the ASTER 30 m, the application sample presented by western Iraq desert—Ubaiydh wadi. A brief review is given how the delineation algorithms have been developed since the 1980’s. Where result shows that automated watershed analysis of flat terrains is cannot be done without manual evaluation and correction either by using several seeding points or river burning technique.
1. Introduction
Catchment area and watershed delineation is a common task in hydrology. Accurate drainage boundaries are essential for accurate budgets and morphological characteristics are considered to be crucial key issues particular in flat terrains. The manual delineation of a catchment based on a topographic map with contour lines is a difficult task for flat terrains. However, in combination with a thorough field survey or evaluation of satellite images reliable catchment delineation will result. Using a digital terrain model and a computer algorithm has the advantage that the result is independent from human decisions and being less time-consuming. The accuracy of the result is depending on both quality and type of DTM and the computer algorithms used. The quality of the DTM is mainly controlled by the spatial solution and the precision of the altitude for each pixel. Thus it is likely that a DTM with a course resolution will have difficulties to replicate hydrological patterns in particular in flats landscapes and be the reason for a false or biased watershed. The second critical factor comes with the algorithms used for delineating the watershed. Delineation tool has been developed since the 1980’s. A brief review is given in the following paragraphs.
Developed an algorithm for defining the path of steepest slope in downstream or upstream direction by using TIN (Triangular Irregular Network) data. This algorithm allows for the definition of basin and sub-basins to any point on a river course. However, most digital terrain data are not provided as TIN but as raster based digital terrains models (DTM) [1].
Developed software tools to derive morphologic information from raster DEM that have proven to be useful in hydrologic applications. First part of the analysis is a conditioning phase that generates three data sets: a DEM with depressions filled, a data set indicating the flow direction for each cell, and a flow accumulation data set in which each cell receives a value equal to the number of cells that drain to it. The original DEM and these three derivative data sets can then be processed in a variety of ways to optionally delineate drainage networks, overland paths, watersheds for user-specified locations, sub-watersheds for the major tributaries of a drainage network, or pour point linkages between watersheds. The efficient derivation of watersheds for large numbers of stream sediment and hydrologic geochemical samples also presents an extremely useful potential application and a software development challenge [2].
Generated a set of recursive algorithms performing the actual topographic feature extraction and synthesis into a full basin model. He improved a framework for automatically watershed extracted from a DEM. The method is based on (Band, 1986) where the author presented an algorithmic approach to automatically extract the drainage lines and divide the networks of watershed from DEM. The present framework is conducted to support and serve the hydrologic models parameters for any sort of landscape investigation when topography plays an important role by using a set of recursive algorithms which describe a new implementation. This approach allows producing more details with respect to surface form in addition to manage, store and retrieve drainage area attribute. This method supports the parameterization of distributed components for runoff models and various hydrological applications [3].
Presented a set of ten algorithms to automate the determination of drainage network and sub-catchments from DEM’s. Main purpose of the algorithms named DEDNM was to parameterize rapidly drainage network and subwatershed properties from DEM’s for subsequent use in hydrologic surface runoff models. The algorithms perform DEM aggregation, depression identification and treatment, relief incrimination of certain areas, flow vector determination, watershed boundary delineation, drainage network and sub-catchment definition and systematic indexing, tabulation of channel and sub-catchment properties and evaluation of drainage network. The algorithms were developed using raster DEM’s with a spatial resolution of 30 × 30 m and 1 m in elevation, similar to those distributed by the USGS for the 7.5' × 7.5' topographic quadrangles. Even though the development of the algorithms focused on problems encountered at this DEM resolution, their application is not restricted to that resolution [4].
A major improvement with respect to single flow direction algorithms was introduced by [5] presenting a multiple flow direction techniques through distributing the upslope area among all possible directions and thus producing a more realistic picture of surface water flow.
Garbrecht and Martz [6] performed an automated extraction of channel network and sub-watershed characteristics from raster DEM by using DEDNM [4]. This model can process DEM data of limited vertical resolution representing low relief terrain. Such representations often include ill-defined drainage boundaries and indeterminate flow paths. It is similar to other models that are based on flow routing concepts, but it includes enhancements for processing low relief landscapes where the rate of elevation change. This model should be applied to subareas that are homogeneous. In general, the close agreement between the various parameters describing the overall network and sub-watershed characteristics demonstrates the ability of DEDNM to over-come the problems associated with ill-defined drainage boundaries and indeterminate flow paths in low relief terrain.
Tarboton [7] presented an algorithms based on representing flow direction as a single angle taken as the steepest downwards slope on the eight triangular facets centered at each grid point. The upslope area is then calculated by proportioning flow between two down slope pixels according to how close this flow direction is to the direct angle to the down-slope pixel. This procedure offers improvements over prior procedures that have restricted flow to eight possible directions or proportioned flow according to slope. The new procedure is more robust than prior procedures based on fitting local planes while retaining a simple grid based structure.
Martz and Garbrecht [8] presented two new algorithms which are based on a deductive, but qualitative assessment of the most probable nature of depressions and flat areas in raster DEM’s. The algorithms have proved to be robust and able to handle all types of actual and hypothetical topographic configurations. The algorithms also provide results that are intuitively more satisfactory and more realistic than other methods. The method proposed to define drainage over flat area in a DEM using information of the surrounding topography and allows for flow convergence within the flat area.
Turcotte, et al. [9] showed numerous limitations of the widely used D8 approach and highlighted that these limitations could be overcome by the proposed approach, where D8 leads to a rather coarse drainage structure when monitoring or gauging stations need to be accurately located within a watershed and it is also unable to differentiate lakes from plain areas. Therefore using a digital river and lake network (DRLN) as input in addition to the DEM has been developed allowing for the definition of a drainage structure which is in agreement with the DRLN. It also led to a better match between observed and modeled flow structure where the results of the proposed approach clearly demonstrated an improvement over the conventionally modeled drainage structure.
Jones [10] presented a new “drainage enforcement” that insures drainage continuity through flat areas and out of depressions. This algorithm is based on the priority-firstsearch weighted-graph algorithm. Relatively simple methods for defining internal basins and incorporating digitized stream data are also discussed.
Zhang [11] proposed a new delineation approach that mainly based on D8 algorithm for determination of flow field over the rugged terrain and in association with D∞ algorithm for the relative flat area to fully take the advantage of D8 and D∞ in watershed delineation. The D∞ is based on representing flow direction as a single angle taken as the steepest downwards slope on the eight triangular facets centered at each grid point.
Osma-Ruiz, et al. [12] described a new algorithm to calculate the watershed transform through rain simulation of grayscale digital images by means of pixel narrowing. The efficiency of this method is based on limiting the necessary neighboring operations which is the most expensive computation in the context to compute the transform to the outmost and in the total number of scanning’s performed over the whole image. Experiments demonstrate that the proposed algorithm is able to significantly reduce the CPU time of the fastest known algorithm without involving any loss of efficiency. It generated an about 31% improvement using various image sizes in comparison with the Sun, Yang and Ren algorithm which called SYR, where the new algorithm achieves linear running time with respect to the size of the input images.
Danner, et al. [13] presented the TERRASTREAM software package and the experimental results on real elevation point sets show that the implemented approach handles massive multi-gigabyte terrain data sets. A data set containing over 300 million points and over 20GB of raw data was processed in less than 26 hours on a system, where most of the time (76%) is spent in the initial CPU-intensive DEM construction stage. the author performed experiments on a Dell Precision Server 370 (3.40 GHz Pentium 4 processor) running Linux 2.6.11. The machine had 1 GB of physical memory.
Kenny, et al. [14] developed two separate routines, one for sinks and one for flats, for establishing flow direction in an un-filled DEM environment. Each sink and flat is analyzed in sequence and flow directions are resolved iteratively, utilizing the surrounding terrain, the morphology within an unfilled DEM and the recognized flow patterns translated from surface hydrology features. In comparative analysis with five commonly employed sink flow routing algorithms the proposed sink routing routine resulted in the least alteration to both the elevation and flow direction surfaces.
The backbone of many GIS performing watershed delineation from a raster DEM is either the D8-algrithms [15] or the D∞ [7], both extracting a potential drainage network. While D8 only extract the drainage network at specific 8 directions, D∞ work along infinite directions (Figure 1). However, both D8 and D∞ face a problem, if more than one lowest neighboring cell is identified: this problem can be solved either by a predefined direction or randomize single flow approach. On contrary to single flow direction algorithms multiple flow direction techniques [5] produce more realistic water flow pattern. The second general problems are depressions which can be solved to some extend by depression filling algorithms (Figure 2).
Almost all software packages performing watershed extraction and catchment delineation tasks are based on similar techniques and create certain outputs:
• Automatically filling of spurious small depressions in DTM and setting thresholds to leave larger/deeper depressions unfilled. In the latter case placing a drain (null cell) at the bottom of unfilled depressions to model their internal drainage.
• Computing vector flow paths, watersheds, basins, and ridge lines.
• Controlling drainage network density and basin size using flow accumulation thresholds for outlet, upstream limit, and branching points.
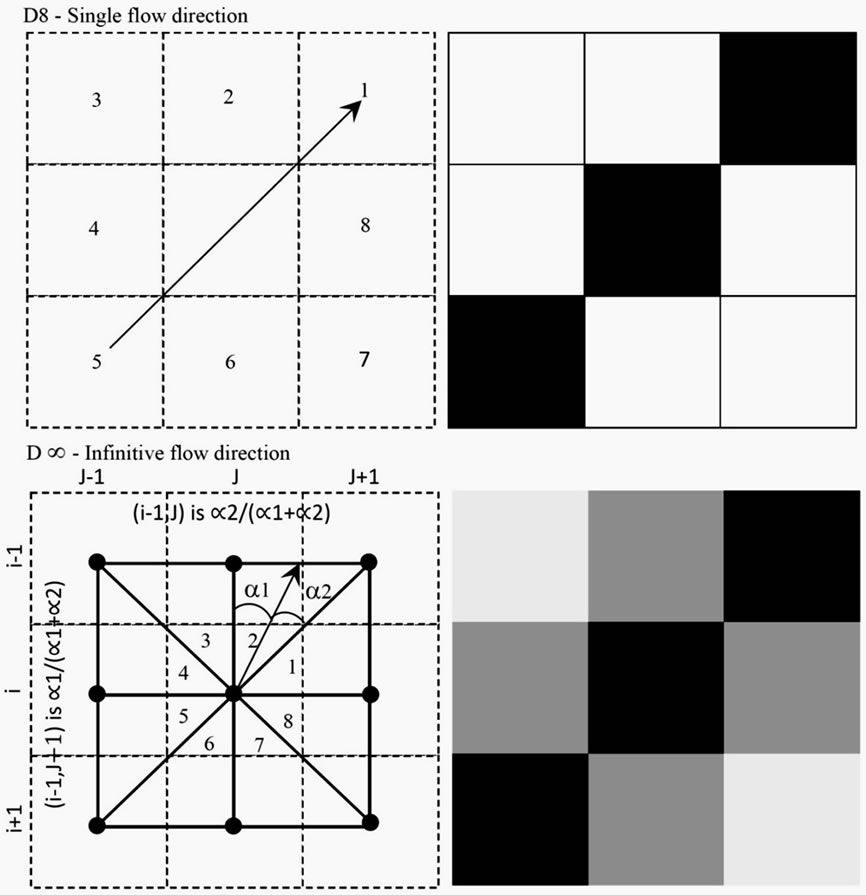
Figure 1. Flow direction and Watershed boundaries based on D8 & D¥.
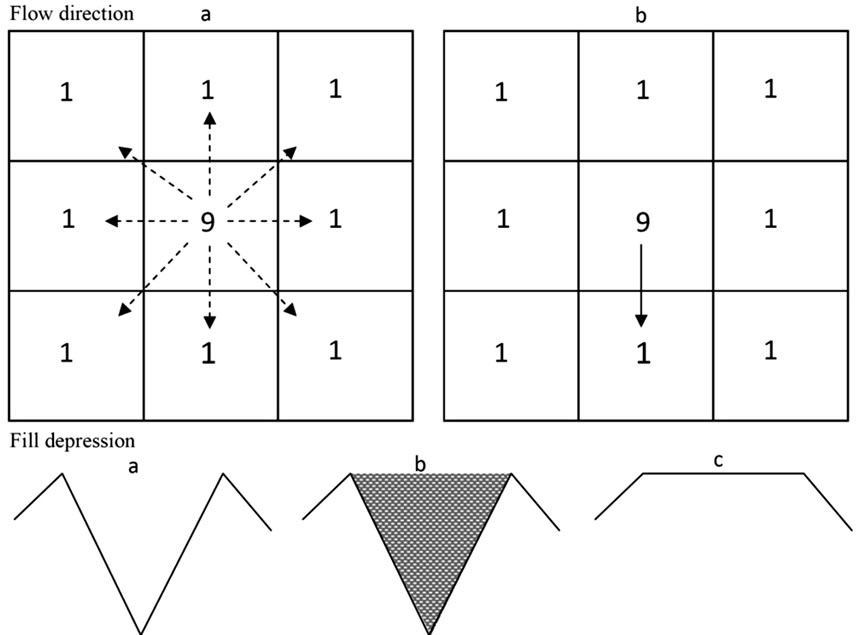
Figure 2. Flow direction a: Randomized; b: Non randomized and fill depression a: Sink unfilled terrain; b: Sink filled terrain; c: Flooded terrain.
• Computing upstream catchment and downstream flow paths for specific locations by manually placing seed points at a desired outlet.
• Compute the geomorphic characteristics; hydrologic attributes of flow paths and catchment polygons of the DEM cells.
• Creating segmented flow path network using elevation or flow accumulation values Other software like HydroSHEDS [16] or ILWIS [17] offer additional operations like void-filling by means of different techniques (filter, neighboring analysis, etc.), hydrologic conditioning (e.g. removing vegetation cover), weeding of coastal zone, stream burning, filtering (smoothing), molding of valley courses, carving through barriers, and manual correction.
Overall two different strategies can be followed up: one strategy is to evaluate a giver raster DEM in total. Sub-catchments which are at the boundary of the DEM are inevitably biased; a proper selection of the frame in particular in the downstream area is thus a prerequisite for a correct delineation of the entire catchment. A second possible strategy is using a manually positioned seed point at the proposed outlet of a catchment area. This is with respect to mathematical complexity the easier task in comparison to a complete terrain analysis. However, concerning practical applications both approaches have advantages and disadvantages and the users would be always well advised to have both options at hand.
2. Objectives
The main focus of this study was evaluating the possibility to delineate catchments from flat and arid areas by means of DTM avoiding hard techniques like river burning or other manual hydrological DTM corrections. Thus it should be shown whether is possible to apply the technique on areas where no river maps are available. Three GIS packages were tested for a considerable large region of interest (~100,000 km2) utilising two DEM: the 90 m and 30 m SRTM (Shuttle Radar Topography Mission) data set in addition to the ASTER 30 m covering the same ROI. For comparison a thorough field survey and manually catchment delineation was available [18] Software used was Arc Hydrotools, TNTmips and RiverTools.
3. Methodology
Figure 3 illustrates how the three GIS used perform the
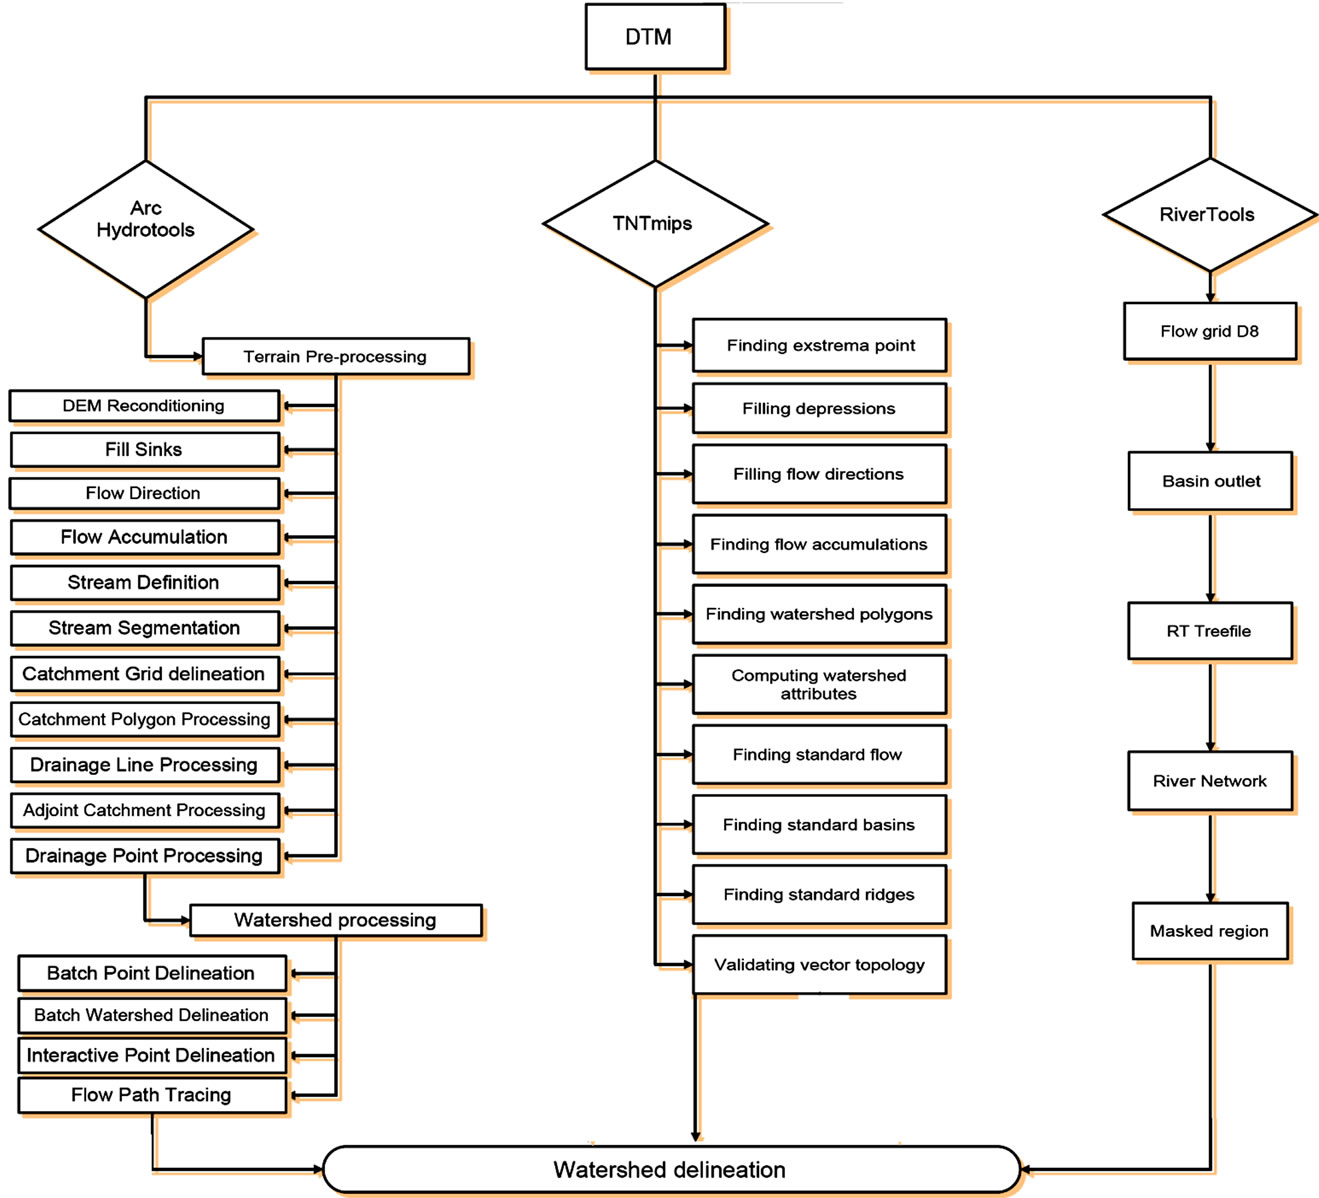
Figure 3. Flowchart for watershed extraction software.
DEM analysis. The algorithms used by RiverToolsV3.0 are described in some details, but the code is not available and finally it is not clear how the algorithms work in detail. The rest two GIS packages (Arc hydro Tools and TNTmips) used are commercial ones and thus it is not truly known which algorithms are utilized for certain steps.
Ten 90 m SRTM and twelve 30 m ASTER files were merged by means of ArcGIS. A 30 m SRTM dataset of Iraq was supplied by courtesy of the US Army and the ROI was clipped from this DTM using ArcGIS. No additional steps were performed with both DTM data sets before using the three above mentioned software products to perform the catchment analysis.
RiverTools V.3.0 was developed by [19] as add on to ESRI products for analysis and visualization of digital terrain, watersheds and river networks. River-Tools may import digital elevation data in a wide variety of formats and to extract geometric and hydrologic information. Several algorithms are included for DEM watershed analyzing, including D8, D∞ and new mass flux algorithms which has been developed based on the D∞ for contributing continuous flow angles and watershed contributing areas, plus state-of-the-art methods for dealing with pits and flats. The mass flux algorithms method partitions flow between neighbor pixels by treating each pixel as a control volume. Unlike the D∞ method, which is superior to the D8 method but does not provide a rigorous solution to the problem of divergent flow on hill slopes, the mass flux method uses a rigorous mass balance approach by dividing each pixel into four quarterpixels, computing a continuous flow angle using the elevations of 3 neighbor, and then computing contributing and specific area using the actual fraction of flow that would pass through each of a pixel’s four edges.
As with the D∞ method, flow from a given pixel will typically be partitioned between two neighbor pixels, except in the case of pixels that are single-pixel peaks or that lie on drainage divides. The results of the mass flux algorithms look quite similar, but the mass flux method shows significant improvements in the calculation of contributing areas. Both the D∞ and mass flux multiple flow direction algorithms outperform the single-direction D8, although they use a D8 flow grid to resolve ambiguous flow situations in flats and pits [20]. However, as a matter of fact, it is not clear in which manner the three techniques are implemented in the software package. e.g. it is not possible to choose between D8, D∞, and the mass flux multiple flow direction algorithms. Thus one can only speculate that the mass flux multiple flow direction algorithms is used in certain cases. A seed point provided by adds coordination or manual screw line concept.
Arc Hydrotools—GIS was developed since 2005 as add on to Arc GIS for building hydrologic information systems to synthesize geospatial and temporal water resources data that support hydrologic modeling and analysis. The Arc Hydro Tools have two key purposes. The first one is to manipulate key attributes in the Arc Hydro data model. These attributes form the basis for further analyses. They include the key identifiers (such as HydroID, DrainID etc.) and the measure attributes (such as LengthDown). The second purpose is to provide some core functionality often used in water resources applications. This includes DEM-based watershed delineation, network generation, and attribute-based tracing.
The functionality of Arc Hydro was implemented in a way allowing easy addition, either internally (by adding additional code) or externally, by providing additional functionality through the use of key Arc Hydro data structures. (Table 1) [21] Since the Arc Hydro Tools is a commercial software algorithm description is not available, however, the main approach is assumed following the [22]. A manual seed point is provided.
The TNTmips V.2007 watershed process provide fast and efficient production of watershed boundaries, flow paths, and other derived products from very large rasters extracted from these DEM including raster to vector conversion of the results. TNTmips can import nearly any kind of data and one may export results to these formats as well. A watershed process was part of TNTmips since the early 1990 using the [2] approach. It is not known which algorithm is used in the version V.2007, respectively the most recent version. TNTmips evaluates by default the entire DEM creating sub-catchments according to defaults or user defined criteria and the entire catchment. A seed point option can be utilized on user request.
4. Sample Application
Part of the western desert of Iraq south-west of Euphrates river covering nearly 32% of whole Iraq (437.072 km²) and habiting a population of about 1.3 million [23] bordering to Saudi Arabia was used as a sample application. UNEP has adopted an index of aridity, defined as: I = P/ PET where PET is the potential evapotranspiration and P is the average annual precipitation [24] Hype-arid: < 0.05 arid: 0.05 - 0.2 semi arid: 0.2 - 0.5 Dry sub-humid: 0.5 - 0.65 According to this definition the region has an I-value of 0.01 and is thus classifies as Hype-arid. It is a rather flat terrain sloping gently with an average of ~ 0.002 m. degrees towards the Euphrates river. Due to low rainfall and high potential evaporation a continuous plant cover does not exist. Ground water is found in several horizons in different depths. The majority of the
Table 1. ArcHydroTools functions description.
ground water is non renewable flowing in confined aquifers. Recharge may occur locally, however, by limited flood events only which happens immediately after rapid and short rushes of rain.
The region investigated (44:00 - 39:00E and 33:00 - 31:00N) covers an area of about 100,000 km² from which ca. 60% is an Iraqi ground and 40% on Saudi Arabian ground. An elevation contour map was created using the 90 m SRTM DTM. It shows the highest value far west with 967 m while the lowest one is located in the east with just 22 m. This elucidates the rather low difference in elevation over a distance of about 479 km (Figure 4). The region of interest includes several large wadis, such as Ubaiydh, Amij, Ghadaf, Tubal, and Hauran discharging to the Euphrates River. The only map displaying drainage pattern of the area was done by the British troops during World War II [18]. The region of interest is considered to enclose some of the most important wadis in the western desert (Figure 5). Because the area is characterized by almost no vegetation cover, it was assumed that the SRTM data do reflect the surface of the soil and thus no adjustment for vegetation cover was necessary. [25] Provided a Hydrogeological investigation for the western desert of Iraq and part of this was a thorough catchment investigation based on a field survey. The catchment area was calculated to be 32,340 km²; however, it is not documented how this calculation was done. On contrary [26] determined for Ubaiydh wadi a total catchment of only 5912 km2 (Figure 6). This huge difference in catchment area calculation comparing to the above field survey can be explained only by assuming that the author has been focusing on the main single drainage line of the wadi. Therefore this kind of biased manual delineation will not be taken in further consideration.
5. Results and Discussion
With River tools; the user has to choose the outlet either by add the coordination for the outlet or using a manual screw line window for the delineated catchment. The delineation process is rather slow and takes more than one and half day to delineate the 30 m DTM; furthermore a high RAM capacity of ~4 GB is recommended. A further disadvantage is that the software does not offer any restart possibility: at any kind of problem during the delineation analysis the process has to be started from the very beginning.
TNTmips watershed process creates a series of temrary vector and raster objects which might be save on demand. The software offers several options to change
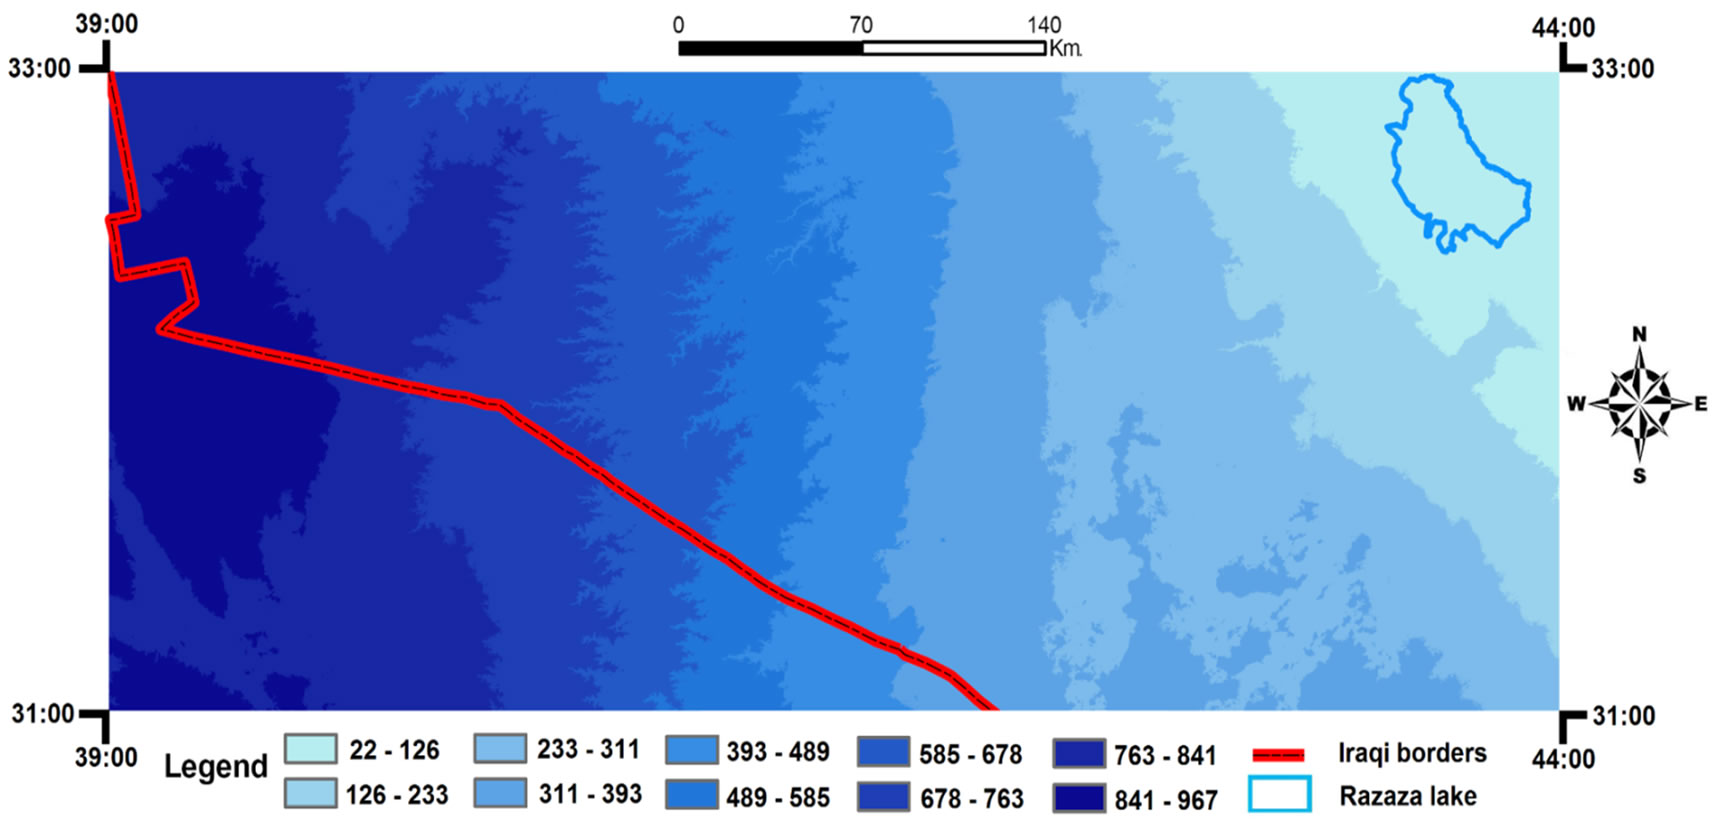
Figure 4. Topographic contour map.
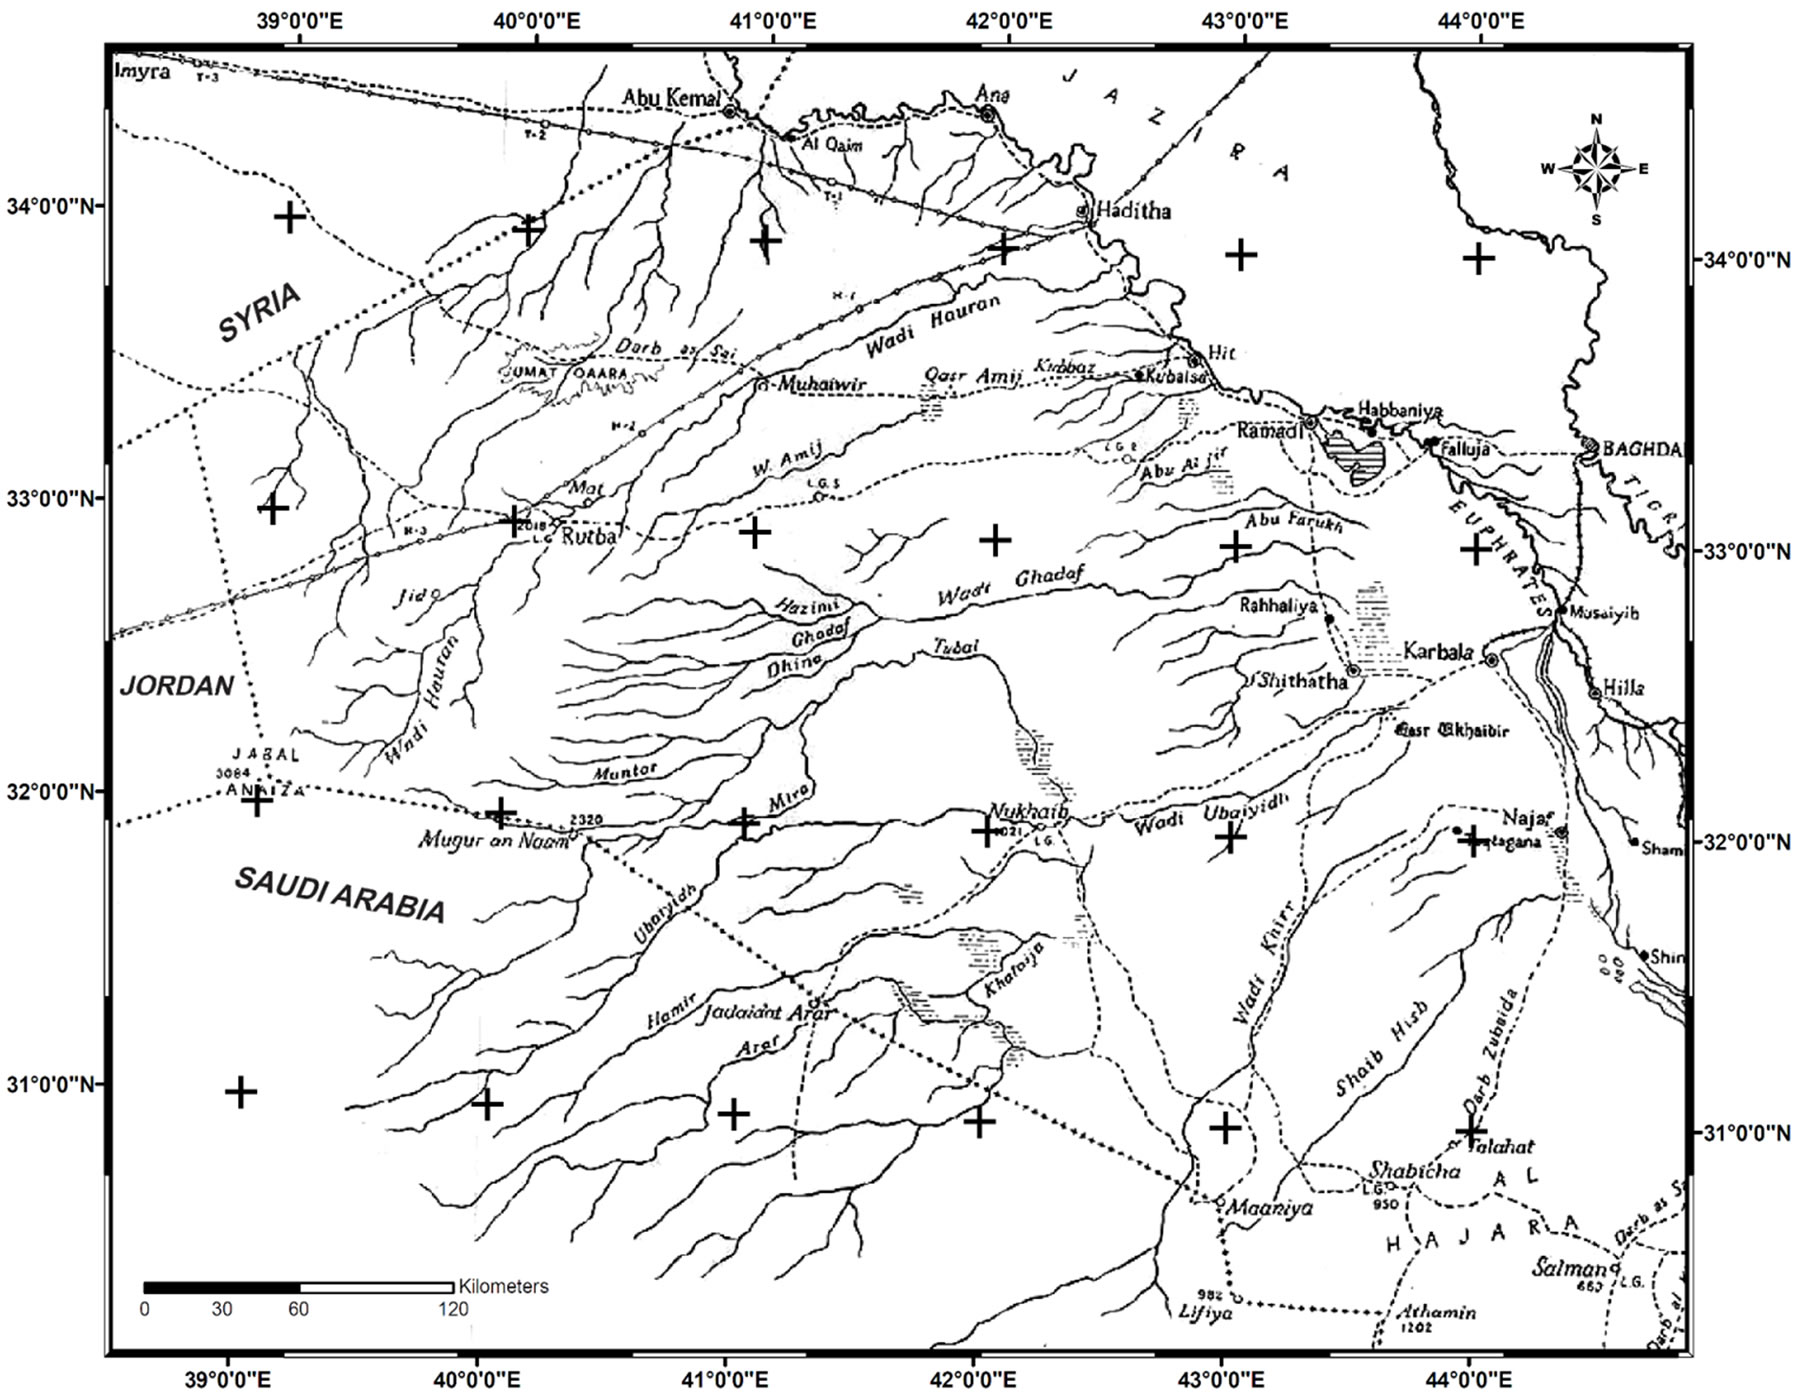
Figure 5. Western desert wadis.

Figure 6. Previous studies. (a) Consortium, 1977; (b) Al-Mankoshy, 2008.
default values with respect to flow path parameters and recomputing flow paths and basins. Additional it offers to calculate basins and flow paths from one or more seed points. Stream order can be computed according to Strahler, Horton; Shreve, and Scheidegger. TNTmips offers one more option to adjust the depression filling algorithms to prevent small depression (e.g. karst sinks) from being automatically filled. TNTmips is rather fast; it took only ~10:30 hours to delineate the entire 30 m DTM.
Arc Hydro Tools does not offer to analyze an entire DTM but requires a seed point for the catchment delineation. In comparison to the other software Arc Hydro Tools was the fastest software; it took ~8 hours for processing the 30 m DTM, which is faster than TNTmips, however, not directly comparable because only the upstream area from the manually set seed point was analyzed. Arc Hydro Tools is handy to use having plenty functions and automated saving of each step separately.
Table 2 shows the Comparison of CPU times in hours: minutes for 90 m and 30 m SRTM, Both 90 m and 30 m DTM within the three software packages implemented by the same seed point (43˚44'20.998"E, 32˚29'08.085"N), the 90 m DTM size calculated by TNTmips (46,670 km²), and Arc Hydro (44,830 km²), are more or less comparable, while River Tools (13,007 km²), has to be assumed as biased result where the comparison here is irrelevant due to the poor result with the 90 m SRTM data set.
With respect to the 30 m DTM. The Arc Hydro, TNTmips and River Tools produces rather similar shape while they shown smaller catchments in comparison with 90 m DTM. However, the most important is that all the three 30 m based catchments show a significant difference to the 90 m based catchment in the north east (Figure 7) While TNTmips and Arc Hydro with 90 m DTM include this missing part which represented by the sub wadi named Tubal which is related to the Ubaiydh [18] A closer evaluation of the 30 m DTM shows a local anomaly at the confluence of the two wadis. This may be a sand dune or temporarily sandbank and as well an artifact of the 30 m SRTM data set. Thus it has to be stated that the 30 m DTM needs a manually correction (river burning) to obtain a correct catchment. Note-worthy that this error does not occur with the 90 m data set due
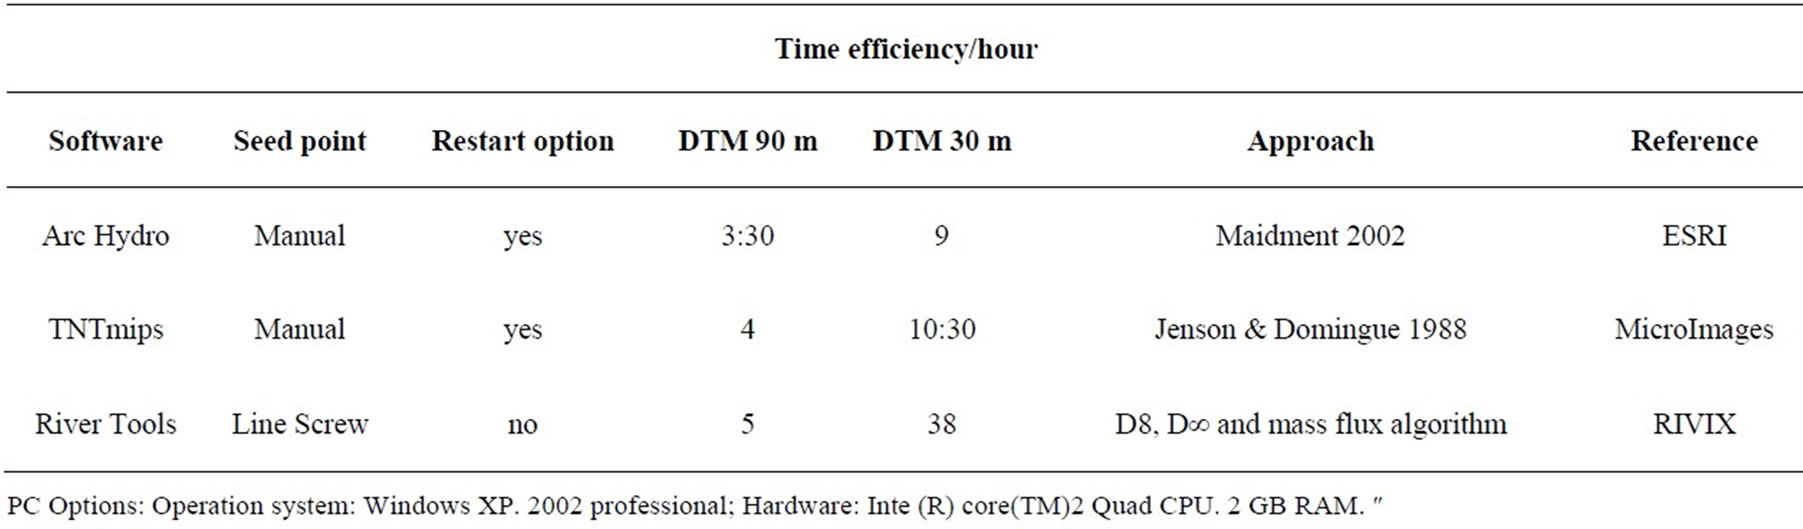
Table 2. CPU results.

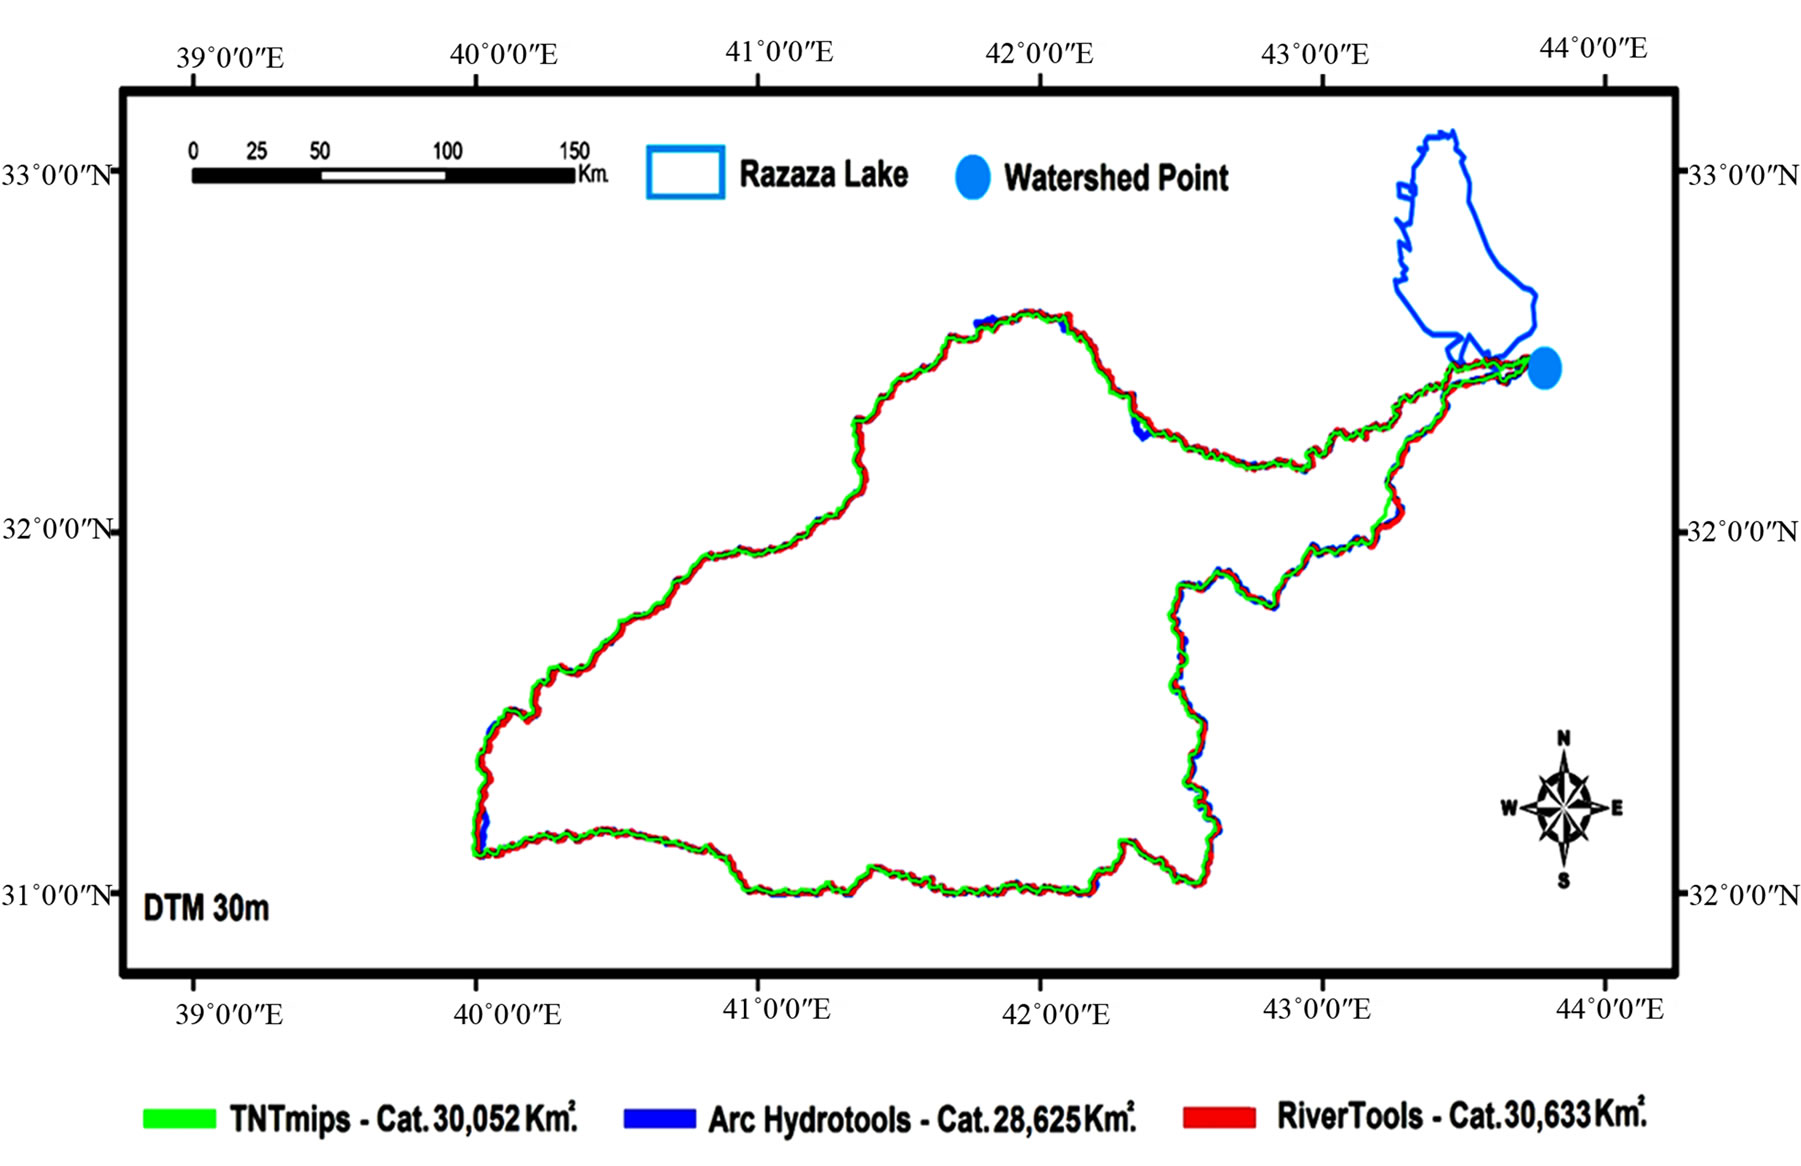
Figure 7. Catchments 90 m and 30 m DTM.
to the fact it has a less resolution where such a sand dune could never be recognized.
An additional approach is shown through TNTmips when no seeding point concept used, the result shows that the largest catchment value in comparison to Arc Hydro is due to the fact that TNTmips calculates the catchment for the entire Razaza Lake and not an arbitrary seed point where wadi Ubaiydh flows into Razaza lake. Therefore Razaza Lake here considered as the outlet of the catchment (Figure 8).
ASTER data set with 30 m resolution has been implemented for double check, Arc Hydrotools has been chosen for this task because it shows the most time efficiency although there were no significant different in results between the rest software packages. The result is rather similar for the 30 m DTM. Where an additional seeding point has been conducted on the sand dune place (41˚55'24.832"E, 32˚37'09.282"N) to create the sub catchment which complete the rest of the whole catchment area (Figure 9).
As a result the catchment calculations are dramatically different for both RASTER 30 m and 90 m, (Table 3) shows the RASTER and ASTER data set results within the 3 software products.
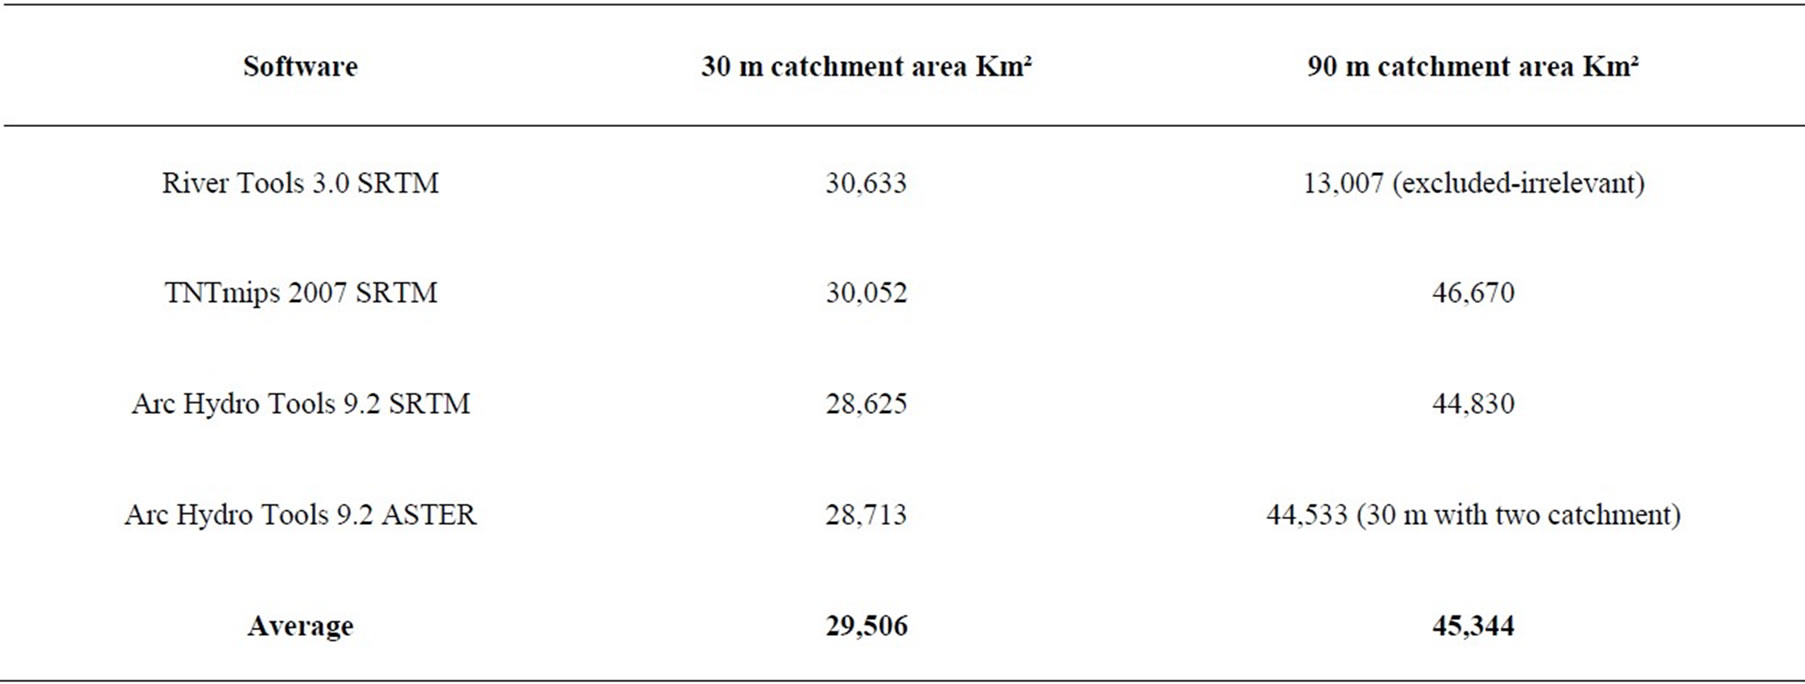
Table 3. Total catchment area results.
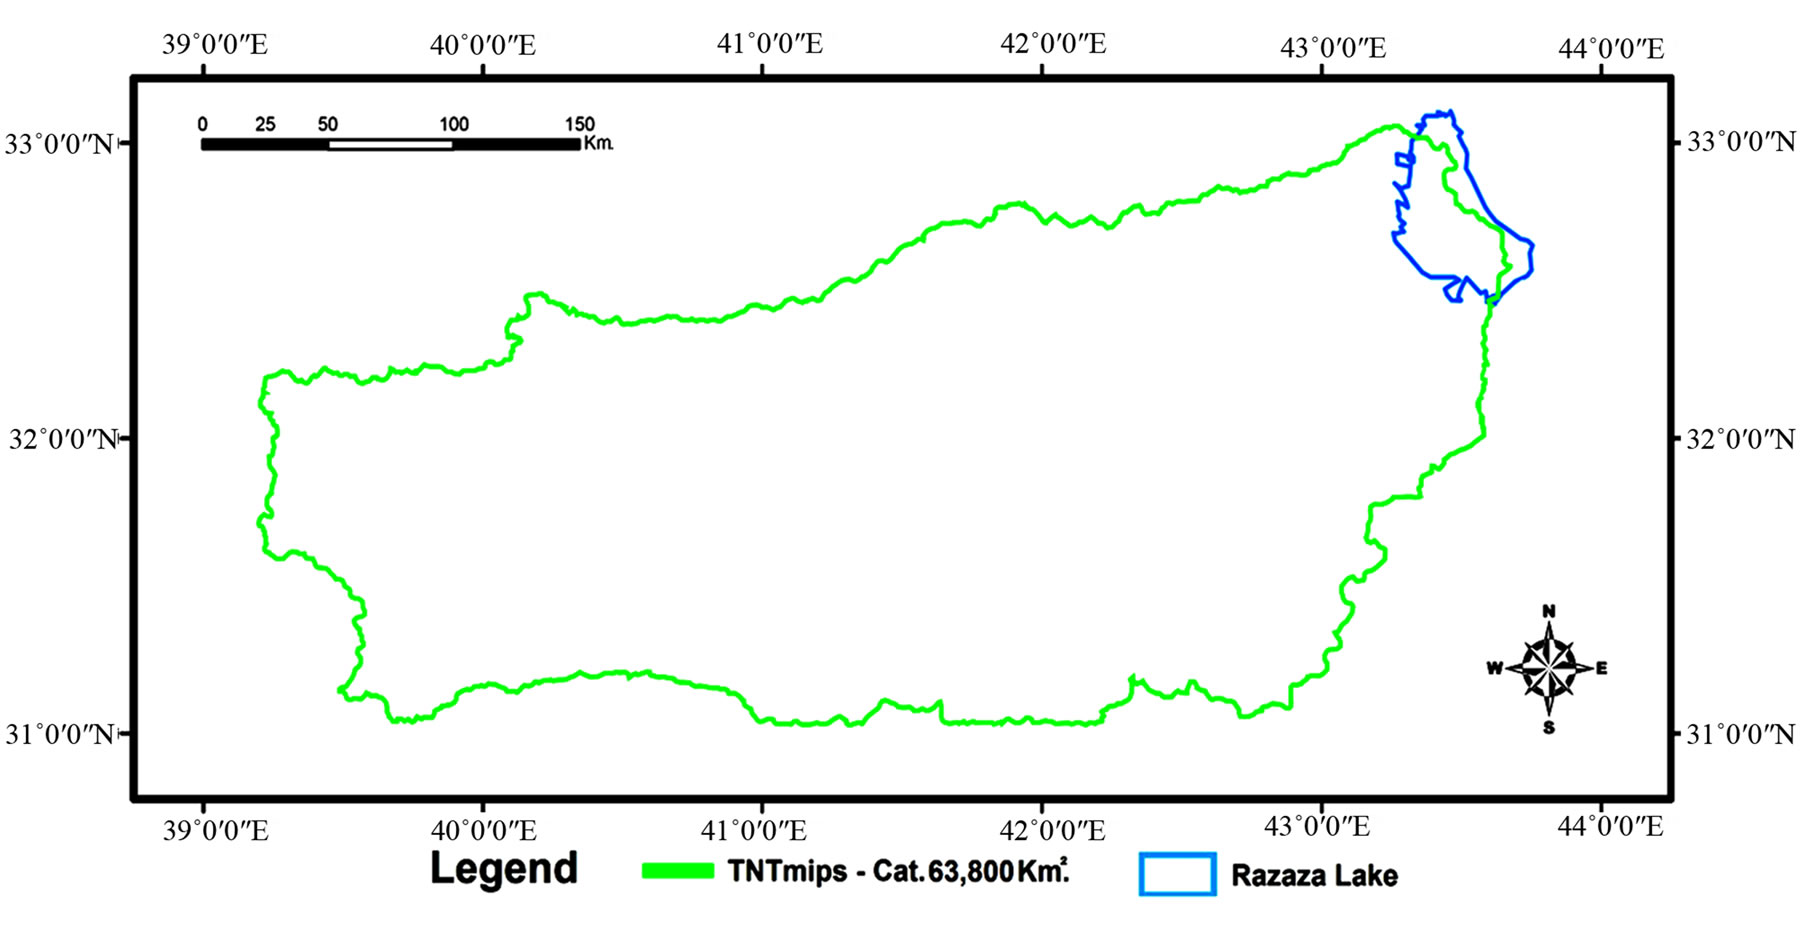
Figure 8. TNTmips 90 no seeding point.

Figure 9. Aster 30 m catchment.
6. Conclusions
Automated watershed analysis of flat terrains is still a challenge and cannot be done without manual evaluation and as shown for the data used in this study through several seeding point or it recommend to implement a manual correction of the DTM by using river burning technique. Remarkable is that the 30 SRTM was providing a poorer result of 90 SRTM as long as no manual correction was done. River Tools algorithms revealed a severe weakness when using the 90 m SRTM and show a limitation in time efficiency.
REFERENCES
- O. L. Palacios-Velez and B. Cuevas-Renaud, “Automated River-Course, Ridge and Basin Delineation from Digital Elevation Data,” Journal of Hydrology, Vol. 86, No. 3-4, 1986, pp. 299-314. doi:10.1016/0022-1694(86)90169-1
- S. K. Jenson and J. O. Domingue, “Extracting Topographic Structure from Digital Elevation Data for Geographic Information System Analysis,” Photogrammetric Engineering and Remote Sensing, Vol. 54, No. 11, 1988, pp. 1593-1600.
- L. E. Band, “A Terrain-Based Watershed Information System,” Hydrological Processes, Vol. 3, No. 2, 1989, pp. 151- 162. doi:10.1002/hyp.3360030205
- L. W. Martz and J. Garbrecht, “Numerical Definition of Drainage Network and Subcatchment Areas from Digital Elevation Models,” Computers & Geosciences, Vol. 18, No. 6, 1992, pp. 747-761. doi:10.1016/0098-3004(92)90007-E
- P. Quinn, K. Beven, P. Chevallier and O. Planchon, “The Prediction of Hillslope Flow Paths for Distributed Hydrological Modelling Using Digital Terrain Models,” Hydrological Processes, Vol. 5, No. 1, 1991, pp. 59-79. doi:10.1002/hyp.3360050106
- J. Garbrecht and L. W. Martz, “Network and Subwatershed Parameters Extracted from Digital Elevation Models: The Bills Creek Experience 1,” Journal of the American Water Resources Association, Vol. 29, No. 6, 1993, pp. 909- 916. doi:10.1111/j.1752-1688.1993.tb03251.x
- D. G. Tarboton, “A New Method for The Determination of Flow Directions and Upslope Areas in Grid Digital Elevation Models,” Water Resources Research, Vol. 33, No. 2, 1997, pp. 309-319. doi:10.1029/96WR03137
- L. W. Martz and J. Garbrecht, “The Treatment of Flat Areas and Depressions in Automated Drainage Analysis of Raster Digital Elevation Models,” Hydrological Processes, Vol. 12, No. 6, 1998, pp. 843-855. doi:10.1002/(SICI)1099-1085(199805)12:6<843::AID-HYP658>3.0.CO;2-R
- R. Turcotte, J. P. Fortin, A. N. Rousseau, S. Massicotte, and J. P. Villeneuve, “Determination of the Drainage Structure of a Watershed Using a Digital Elevation Model and a Digital River and Lake Network,” Journal of Hydrology, Vol. 240, No. 3-4, 2001, pp. 225-242. doi:10.1016/S0022-1694(00)00342-5
- R. Jones, “Algorithms for Using a DEM for Mapping Catchment Areas of Stream Sediment Samples* 1,” Computers & Geosciences, Vol. 28, No. 9, 2002, pp. 1051- 1060. doi:10.1016/S0098-3004(02)00022-5
- W. C. Zhang, C. B. Fu and X. D. Yan, “Automatic Watershed Delineation for a Complicated Terrain in the Heihe River Basin, Northwestern China,” Proceedings of IEEE International Symposium on Geoscience and Remote Sensing, Seoul, 25-29 July 2005, pp. 2347-2350.
- V. Osma-Ruiz, J. I. Godino-Llorente, N. Sáenz-Lechón, and P. Gómez-Vilda, “An Improved Watershed Algorithm Based on Efficient Computation of Shortest Paths,” Pattern Recognition, Vol. 40, No. 3, 2007, pp. 1078-1090. doi:10.1016/j.patcog.2006.06.025
- A. Danner, et al., “Terrastream: From Elevation Data to Watershed Hierarchies,” ACM, 2007, p. 28.
- F. Kenny, B. Matthews and K. Todd, “Routing overland Flow through Sinks and Flats in Interpolated Raster Terrain Surfaces,” Computers & Geosciences, Vol. 34, No. 11, 2008, pp. 1417-1430. doi:10.1016/j.cageo.2008.02.019
- J. Fairfield and P. Leymarie, “Drainage Networks from Grid Digital Elevation Models,” Water Resources Research, Vol. 25, No. 5, 1991, pp. 709-717. doi:10.1029/90WR02658
- B. Lehner, K. Verdin and A. Jarvis, “Hydrosheds Technical Documentation: Version 1.1,” 2008. http://hydrosheds.cr.usgs.gov/index.php
- B. Gorte, W. Koolhoven, R. Liem and J. Wind, “Recent Developments in the ILWIS Software Kernel,” ITC Journal, Vol. 3, 1990, pp. 215-218.
- Naval Intelligence Division, “Western Desert of Iraq,” University of Texas Libraries, Austin, 1944.
- Rivix Limited Liability Company, “RiverTools, Topographic and River Network Analysis. User’s Guide, RiverTools Version 3.0,” RIVIX Limited Liability Company, Broomfield, 2004.
- RiverTools, “River Tools Tutorial,” 2003.
- Hydrotools A., “Arc Hydrotools Tutorial,” 2009.
- D. R. Maidment, “Arc Hydro: GIS for Water Resources,” ESRI Press, 2002.
- National Investment Commission (NIC), “Republic of Iraq National Investment Commission,” 2004.
- Unep V., “World atlas of Desertification,” 1992.
- Consortium-Yugoslavia, “Hydrogeological Explorations and Hydrotechnical Work-Western Desert of IRAQ. Blook7, Directorate of Western Desert Development Projects,” Republic of Iraq, 1977.
- H. J. Al-Mankoshy, “Integration of Remote Sensing Data and GIS to Determine Potential Ground Water in Ubaiyidh and Ghadaf Valleys,” Ph.D. Thesis, College of Science, Baghdad University, Baghdad, 2008.