Journal of Water Resource and Protection
Vol. 2 No. 9 (2010) , Article ID: 2719 , 5 pages DOI:10.4236/jwarp.2010.29095
Fuzzy Complex Index in Water Quality Assessment of Municipalities
College of urban construction, Wuhan University of Science and Technology, Wuhan, China
E-mail: weibao7727@126.com
Received July 1, 2010; revised August 2, 2010; accepted August 15, 2010
Keywords: Fuzzy Complex Index, Eutrophication, Subordinate Degree, Water Quality Assessment
ABSTRACT
Donghu Lake in Wuhan is a multipurpose complex water body. However, its eutrophication phenomenon becomes increasingly serious. By making use of detailed and accurate contamination monitoring data and several mathematics models, we probe into the dynamic state of water quality. The year’s average value of major contamination index in Donghu Lake from 2001 to 2008 and fuzzy complex index are used to assess its short-term state of water quality. The results show that its water quality is basically stable in the 4th class of water quality standard GB3838-2002.
1. Introduction
Donghu Lake, a medium-sized freshwater lake in the middle and lower reaches of the Yangtze River, locates in the northeast of Wuhan City. The lake area is about 32 km2, an average depth is 2.21 m. Water area is 127.50 km2, and Lake Capacity is about 100 million m3. But in recent years, the increase in resident population, and the rapid development of high-tech industries surrounding the lake have resulted in deterioration in water quality in Donghu Lake, serious eutrophication phenomenon, increasing degree of water pollution, aquatic ecosystem structure and function disorders and inverse succession, which affects people’s lives and health. It is the increasingly serious water pollution levels that force water plant of Donghu Lake to stop production, which is now implementing “lake reform river” project in order to ensure drinking water safety near the Lake. Thus, it is especially important to probe into water quality, analyze the water quality dynamics of pollution sources to develop eutrophication control measures.
Environmental quality assessment is quantitative and qualitative comments of the pros and cons of the environmental quality .It takes the countries-developed environmental standards or pollutants background value in the environment as the basis to transform the pros and cons of the environmental quality into comparable quantitative data, and finally hierarchies these quantitative results to indicate the degree of environmental pollution.
We apply gray theory to solve the ambiguity issue, and establish a suitable subordinate function model to map incomparable data into subordinate degree, then make weight, and finally determine the best situation to determine the water environment pollution levels from the multi-objective composite index evaluation matrix.
2. Mathematical Model of Water Environmental Quality Assessment
Scholars from countries have conducted in-depth research on the lake water quality evaluation system, not yet formed a unified mathematical model. Because the water quality is vague concept, people have to devote increased attention to the fuzzy mathematics method and gray theory method. The fuzzy set extended the classic concentred g (0,1) values to a closed interval of continuous values [0,1], which is a major breakthrough in modern mathematics. The application of fuzzy mathematical method in water quality assessment overcame the information ambiguity. However, there are many deficiencies: such as it is easily be misjudged; poor choice of a variety of computing models will lose some information; calculation is more cumbersome and so on. Gray theory method overcomes the information uncertainty, but there are deficiencies of missing information.
We apply the fuzzy complex evaluation method in fuzzy mathematics to determine the water quality comprehensive index, and probe into the water quality trends of Donghu Lake.
2.1. Mathematical Model of Fuzzy Complex Index
We suppose there are n factors affecting surface water environment quality, posed by these factors we get an evaluation factor set U, then U = (u1, u2, u3, …un). For a given m-judgment standards, by its composition of the corresponding evaluation factor, we get a set V = (v1,v2,v3,…vm). For a given U and V, its fuzzy relationship can be expressed by fuzzy matrix as following:
 (1)
(1)
In the formula, ri,j is the environmental quality values of the ith pollutants, which used to indicate the possibility of being rated as j class environment quality, that is the subordinate degree i to j. When the pollutants environmental quality values are not within the standards range, take ri, j = 0, the number n refers to the pollution factors, i = 1,2,3, … n. m indicated the levels of water quality, j = 1,2,3 , … m.
A = (a1, a2, a3, ⋯ an) is the fuzzy subset of evaluation factor set, in which ai indicated the weight of ui in all factors of water quality. As Σai = 1, then the water quality fuzzy comprehensive evaluation model is:
B = A × R(2)
B = {b1,b2,b3…bm};
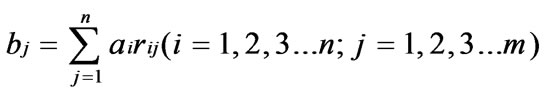
fuzzy complex index b0 = max{bj}; j = 1,2,3…m.
2.2. Fuzzy Comprehensive Index Calculation
2.2.1 Calculation of Fuzzy Relation Matrix R
Fuzzy relationship matrix R represents each contamination factor’s subordinate degree on each level water quality standard; it can be seen as the concentration of pollutants and environmental quality standards index. Suppose water level is divided into m class, then we can use S (1), S (2)…S (m). Pollution factor’s subordinate degree on each level water quality when monitoring value = x is determined by the formula:
 (3)
(3)
2.2.2. Calculation of Weight Coefficients
The weighting coefficient of contamination factor is a measure of evaluating various pollutants factors’s effect on the water environment quality. Given different weights make use of popputants contribution rate method to calculate a single factor weight coefficient; the calculation formula is as follows:
 (4)
(4)
In the Formula, Ci is the ith pollution factors measured concentration (mg/L), C0i is the first i kinds of pollution factor’s grading reference value (mg/L).
3. Donghu Lake Water Environment Quality Assessment of Recent Years
3.1. Selection of Evaluation Factors
Take the annual average value from 2001 to 2008 of main pollutant in Donghu Lake as evaluation factors, as shown in Table 1.
3.2. The Water Quality Grading Standards and Pollutants Classification Standard Values
According to the Surface Water Environmental Quality Standard GB3838-2002, surface water quality standards will be divided into five grades, respectively, I, II, III, IV, V. Take the grade III as the classification reference value C. Standards at all levels are in Table 2.
3.3. Calculation of Subordinate Degree
Take the monitoring data of pollution index of Donghu Lake listed in the table into Formula (1) to calculate the pollution factor subordinate degree. The calculation results is in Table 3.
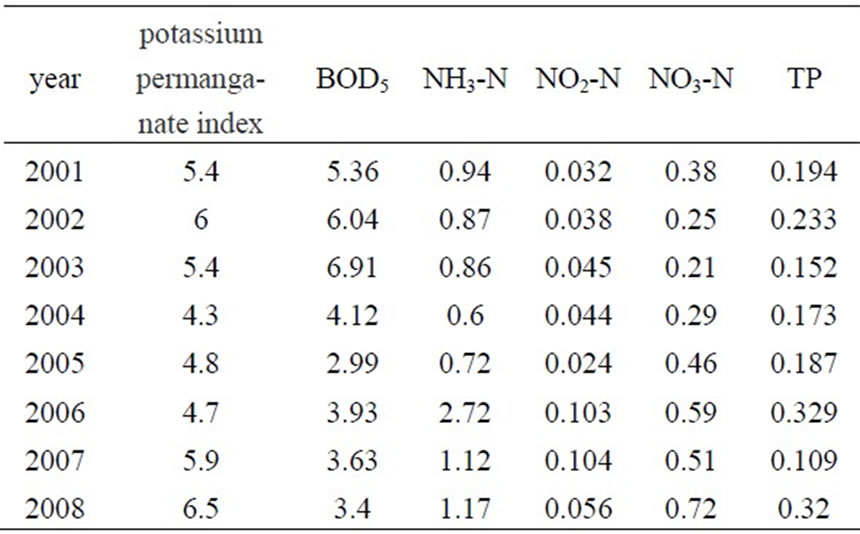
Table 1. The annual average value of the major pollutants in Donghu Lake from 2001 to 2008 mg/L.
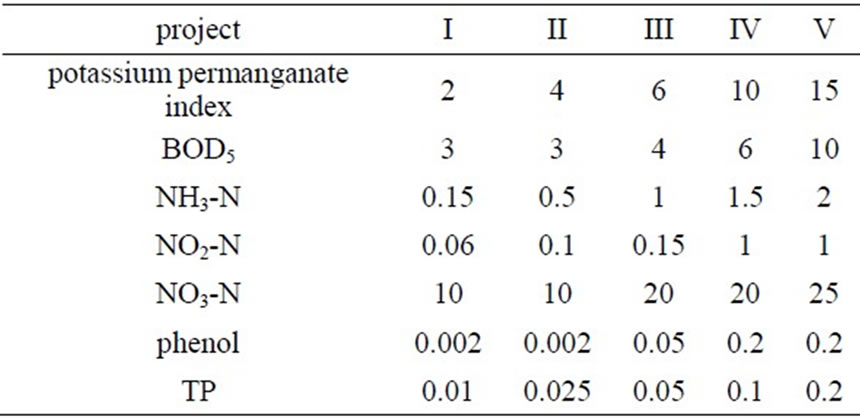
Table 2. Classification reference value of surface water pollution factor mg/L.
3.4. Calculation of Weight Coefficients
By Equation (4) to calculate the weight values of each pollution factor in Table 4.
3.5. Fuzzy Complex Index Calculation
Take the data listing in Table 3 and Table 4 to Formula (2) to determine the overall water quality of Donghu Lake. The results are in Table 5.

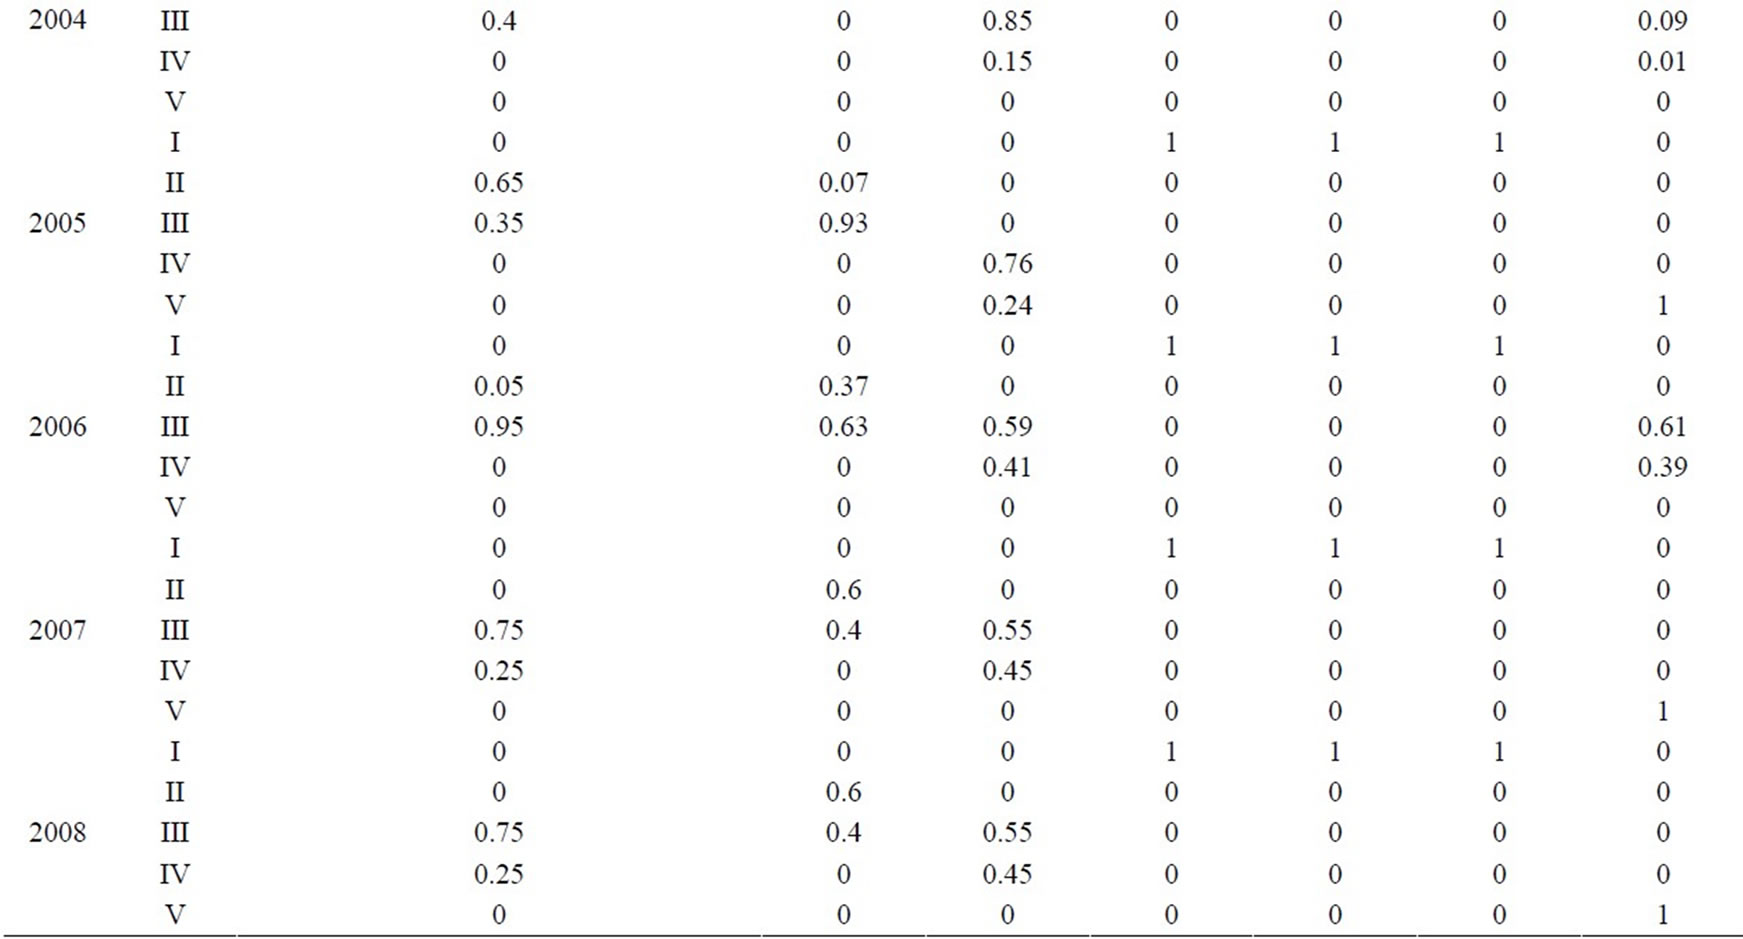
Table 3. Calculation results of pollutant factors subordinate degree on each grading standard.
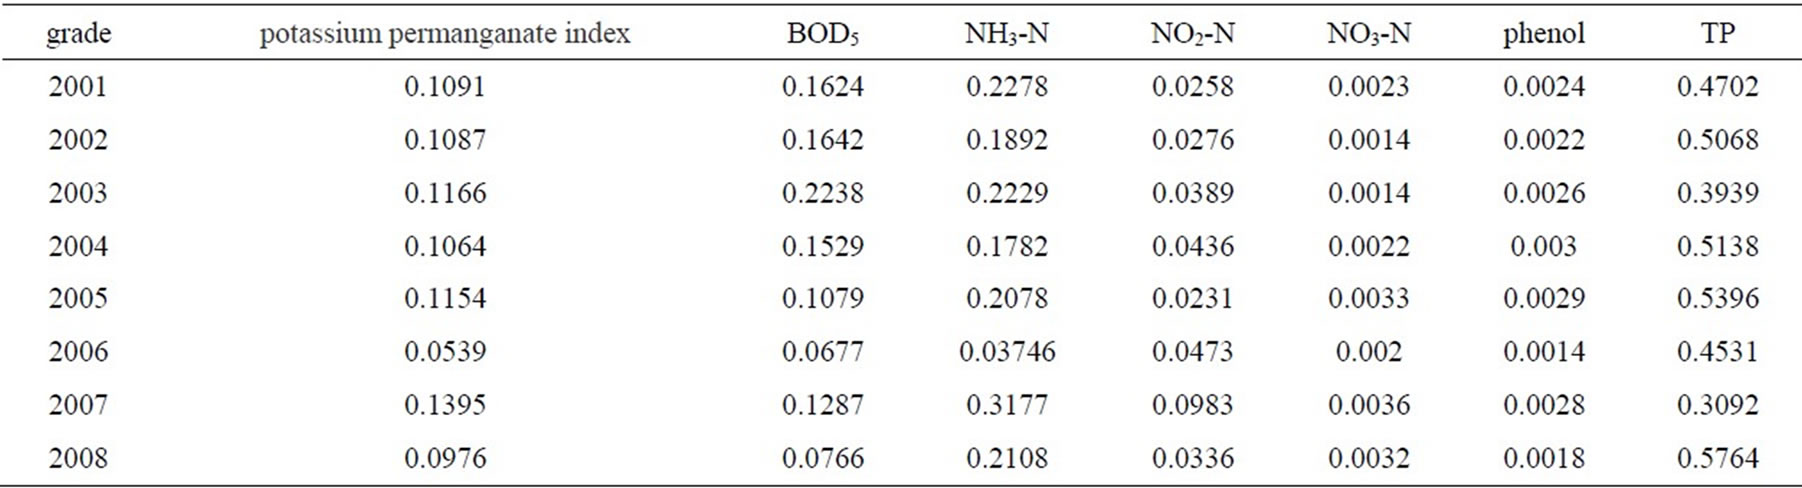
Table 4. Weight coefficient calculation results.
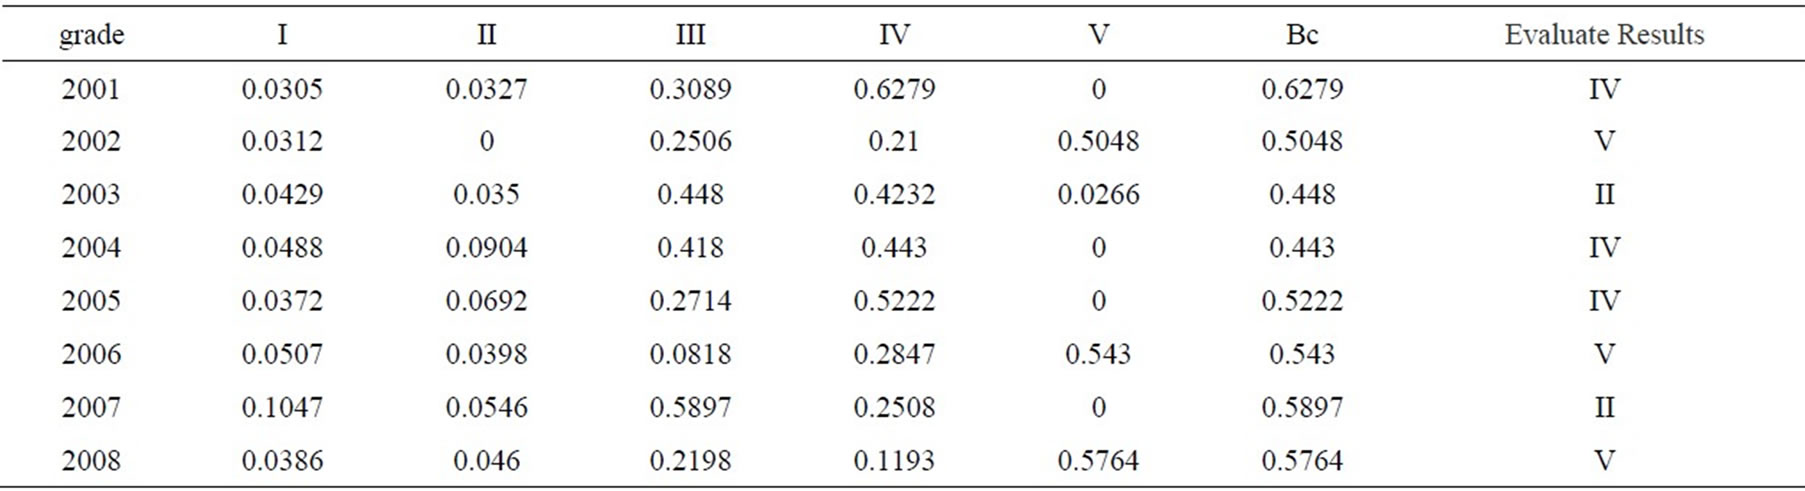
Table 5. Fuzzy complex index.
4. Analysis of Evaluation Results
A. From the evaluation results in Table 5, we can see Donghu Lake water quality has not changed much in recent years, and the water body is of type IV, a heavier pollution degree. The stability of Donghu Lake water quality on the one hand shows a better water conservation work and in the short terms no significant deterioration phenomenon; on the other hand it also shows that the Donghu Lake water quality has deteriorated to a considerable extent, which destructs the original ecological balance, so Donghu Lake governance is imminent.
B. From the analysis data of subordinate degree for each year in Table 3, we can clearly see the main pollution factors that play an important role (that is, larger subordinate degree value in grade IV, V) in deciding the water level are: BOD5, NH3-N, total phosphorus.
From weight coefficient in Table 4, pollution factors of the larger weight coefficient are the total phosphorus (0.3092~0.5764); NH3-N (0.1782~0.3746); BOD5 (0.067 7~0.2238).
From the above analysis we draw out that the major pollutants in Donghu Lake are total phosphorus, NH3-N, BOD5, a type of organic pollution. It is the severe organic pollution, which results in the former Donghu Lake water plant unablility to continue normal operations. Algal blooms and the factory water Ames test was strongly positive, thus it was forced to stop production. Wuhan municipal government decides to implement this “lake reform river” project, in order to ensure the safety of residents’ drinking water.
C. Water quality at the same level of water body is not the same. From the monitoring data alone is very difficult to distinguish the difference. However, the fuzzy complex index can clearly judge the quality levels, which are the merits of fuzzy comprehensive index method in determining the water quality. The concentration of various pollutants in water is changing, some higher, while the other part may be reduced. From monitoring data it is not easy to ascertain the water quality is increased or decreased. This is because each factor has a different impact on water quality; furthermore, the affecting results are not the same. It is difficult to determine changes in water quality trends from “Excessive” or “compliance” of some individual indicators alone. While with the fuzzy composite index b , the water quality can be identified from the Ⅳ to V class ,which is of great significance on Donghu Lake water supervision and management in facilitating the problems timely and being conducive to the rapid implementation of pollution prevention and control measures, to ensure that the problem nipped in the “bud” state.
REFERENCES
- P. T. Liu, “Introduction to Environmental,” Higher Education Press, Beijing, 1988.
- Z. Z. Xu, “Applied Research on Fuzzy - Grey Theory in Urban Environmental Quality Evaluation,” Journal of Environmental Science, Vol. 17, No. 3, 1997, pp. 1-3.
- H. L. Liu and G. G. Han, “Introduction to China Water Environment Forecast and Countermeasure,” China Environmental Science Press, Beijing, 1988.
- H. D. Wang, “Environmental Quality Assessment,” Institute of Environmental Studies of Beijing Normal University, Beijing, 1981.