Journal of Water Resource and Protection
Vol. 2 No. 5 (2010) , Article ID: 1793 , 17 pages DOI:10.4236/jwarp.2010.25050
Water Pollution with Special Reference to Pesticide Contamination in India
1Department of Zoology, Surendra Nath Balika Vidyalaya Post Graduate College, CSJM University, Kanpur, India
2Department of Zoology, University of Allahabad, Allahabad, India
3Department of Biochemistry University of Allahabad, Allahabad, India
E-mail: sharmabi@yahoo.com
Received December 29, 2009; revised March 7, 2010; April 21, 2010
Keywords: Pesticides, Pollution, Water, Riverine systems, Toxicity, Management
ABSTRACT
The pesticides belong to a category of chemicals used worldwide as herbicides, insecticides, fungicides, rodenticides, molluscicides, nematicides, and plant growth regulators in order to control weeds, pests and diseases in crops as well as for health care of humans and animals. The positive aspect of application of pesticides renders enhanced crop/food productivity and drastic reduction of vector-borne diseases. However, their unregulated and indiscriminate applications have raised serious concerns about the entire environment in general and the health of humans, birds and animals in particular. Despite ban on application of some of the environmentally persistent and least biodegradable pesticides (like organochlorines) in many countries, their use is ever on rise. Pesticides cause serious health hazards to living systems because of their rapid fat solubility and bioaccumulation in non-target organisms. Even at low concentration, pesticides may exert several adverse effects, which could be monitored at biochemical, molecular or behavioral levels. The factors affecting water pollution with pesticides and their residues include drainage, rainfall, microbial activity, soil temperature, treatment surface, application rate as well as the solubility, mobility and half life of pesticides. In India organochlorine insecticides such as DDT and HCH constitute more than 70% of the pesticides used at present. Reports from Delhi, Bhopal and other cities and some rural areas have indicated presence of significant level of pesticides in fresh water systems as well as bottled drinking mineral water samples. The effects of pesticides pollution in riverine systems and drinking water in India has been discussed in this review.
1. Introduction
Water is essential for life. No living being on the planet Earth can survive without it. The major part of water on earth is marine water which can not be used without processing by human beings. The only available fresh water which could be used for drinking purposes arises from the ground water. The percent volume of it, however, is sufficient to cater the need of the living beings, provided it would have been of high quality. Water quality is important in our lives because it is essential to support physiological activities of any biological cell.
Water pollution may be defined as any impairment in its native characteristics by addition of anthropogenic contaminants to the extent that it either cannot serve to humans for drinking purposes and/or to support the biotic communities, such as fish. Water pollution is the contamination of water bodies such as lakes, rivers, oceans, and groundwater by human activities. All water pollution affects organisms and plants that live in these water bodies and in almost all cases the effect is damaging either to individual species and populations but also to the natural biological communities. It occurs when pollutants are discharged directly or indirectly into water bodies without adequate treatment to remove harmful constituents.
Water pollution is a major cause of global concern as it leads to onset of numerous fatal diseases [1] which is responsible for the death of over 14,000 people everyday. The problem in developing countries is more alarming than that of industrialized nations. In addition to pesticides, natural phenomena such as volcanoes, algae blooms, storms, and earthquakes also cause major changes in water quality and the ecological status of water. Water pollution has many causes and characteristics. If the quality of water is changed by the presence of toxins, it becomes potentially harmful to these life forms, instead of sustaining them.
Many water pollutants are reported to act as toxic chemicals. The pesticides are designed and developed keeping in view killing the insects-pests in general and they are not specific-specific. Their application methodologies are designed to ensure that these chemicals come in contact with the target pests to kill them avoiding the non-target organisms. These target pests, however, are simply species of animals that share many of the same characteristics of other animals. One of these characteristics is a susceptibility to certain toxins. In other words, a chemical that is toxic to one animal also may be toxic to other forms of animal life. Although it might take a larger dose of pesticide to harm humans than pests such as insects, many pesticides are still toxic to humans. The doses needed to kill a pest effects the humans in many ways such as disruption in function of sex hormones and reproductory performance [2-5]. The pesticides act as xenohormones (mimicking the action of endogenous hormones) or otherwise interfering with endocrine processes, hence have been collectively categorised as endocrine disruptors [6].
An herbicide is a substance used to kill unwanted plants. Selective herbicides kill specific targets while leaving the desired crop relatively unharmed. Some of these act by interfering with the growth of the weed and are often synthetic “imitations” of plant hormones. Herbicides used to clear waste ground, industrial sites, railways and railway embankments are non-selective and kill all plant material with which they come into contact. Smaller quantities are used in forestry, pasture systems, and management of areas set aside as wildlife habitat. Many of them are species specific to the target plant pests [5].The exceptions to this are broad-spectrum herbicides that are designed to kill a wide variety of plants. An herbicide that is specific to one or more species of plants does not ensure that it is safe to enter the water system. Some of the dangers from these chemicals are yet to be fully understood. Caution should therefore be used to ensure that these products do not unnecessarily enter the water system. Using safe, well-planned applications of materials, such as pesticides, the risk to humans and other animals is minimal. If these products enter the water system, they may reach nontarget animals and pose a hazard to the lives of other animals (including humans and domestic animals) and non-target plants. Along with pesticides, there are many other materials that can cause the same type of adverse effects to water systems and ultimately to humans [5]. The most reasonable way to deal with the problem of water pollution could be by striving not to introduce any hazardous materials into waters without reason, because the result may be a deterioration of water quality. The overall picture is not as bleak as it appears. As the threat to water systems and the mechanisms that cause water to become polluted are now better understood, steps are needed to protect the quality of our water. Keeping the seriousness of pesticides contamination in water systems and its impact on humans and animals in addition to the environment, an endeavor has been made in the present review to compile and project the current information available on this issue with special reference to India.
2. Sources of Water Pollution
Water pollution is the contamination of water bodies (e.g. lakes, rivers, oceans, groundwater). This may be defined in terms of the undesirable changes in the chemical and physical properties of water which are not favourable to all those living things utilizing water for their lives. There are two basic forms of water pollution; 1) changing the types and amounts of materials carried by water, and 2) altering the physical characteristics of a body of water [7]. Water pollution occurs in many forms, from a wide range of sources. Agriculture may contribute to water pollution from feedlots, pastures, and croplands. Mining, petroleum drilling, and landfills may also be major sources of water pollution. Other water pollution sources, related to humans, are sanitary sewers, storm sewers, industry, and construction [5].
According to one report published in 1990 from the Environment Protection Agency (EPA), > 50% of the water pollution of streams and rivers occur due to leaching and mixing of chemicals from the agriculture practices [5]. The next highest source was municipal sources (about 12%). Groundwater contamination is from several sources (USGS Circular 1998), including agricultural activities, storage tank leakage, industrial waste, sewer and septic leakage, leaching from landfills, mining, and many other sources. Water pollution occurs when a body of water is adversely affected due to the addition of large amounts of materials to the water. The sources of water pollution are categorized as being a point source or a non-source point of pollution. Point sources of pollution occur when the polluting substance is emitted directly into the waterway [8]. A pipe spewing toxic chemicals directly into a river is an example. A nonpoint source occurs when there is runoff of pollutants into a waterway, for instance when fertilizer and pesticide from a field is carried into a stream by surface runoff. A toxic substance is a chemical pollutant that is not a naturally occurring substance in aquatic ecosystems. The greatest contributors to toxic pollution are herbicides, pesticides and industrial compounds.
Pesticides are those chemicals (such as insecticides, fungicides, herbicides, rodenticides, molluscicides, nematocides, plant growth etc.), which have been widely used throughout the world to increase crop yield and to kill the insect-pests responsible for transmitting various diseases to humans and animals. However, according to several reports, these chemicals have been proved to inflict adverse impacts on the health of living beings and their environment [9-12].
In most of the technologically advanced countries, organochlorine (OC) insecticides, which were used successfully in controlling a number of diseases such as malaria and typhus, have been banned or restricted. After 1960, other synthetic insecticides such as organophosphate (OP), carbamates, pyrethroids, and herbicides and fungicides were introduced into agricultural practices as well as several health management programmes.
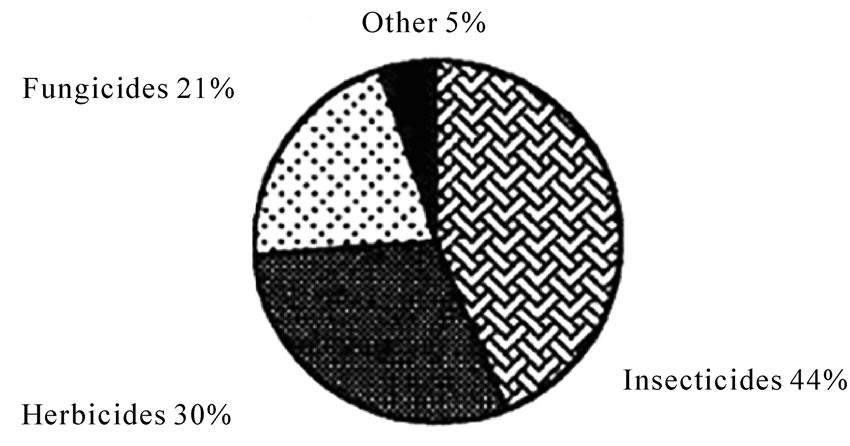
The trend of application of different pesticides in India radically differs from rest of the world. The data presented in Figures 1(a) and (b) reflects the estimates of global usage of pesticides (Figure 1(a)) in general and India (Figure 1(b)) in particular. The 76% of the total pesticides used in India is insecticide (Figure 1(b)). Correspondingly, the lesser use of herbicides and fungicides is reflected (Figure 1(b)). The main use of pesticides in India is for cotton crops (45%), followed by paddy and wheat [11]. The pesticide cycle is illustrated in Figure 2.
The major part of the pesticides applied in any area for a specific reason (about 99%) remain unused and it gets mixed with air, soil, water and plants which by several means causes harmful effects on the people, pets, and the
 (a)
(a)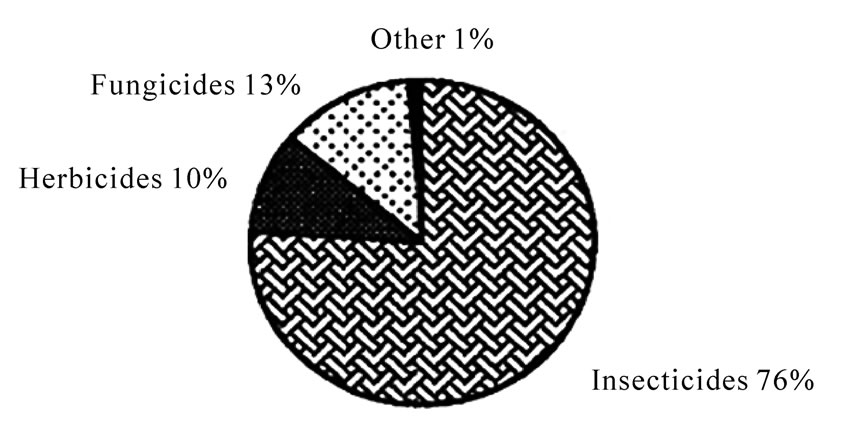 (b)
(b)
Figure 1. (a) An estimate representing application of different pesticides globally [11]; (b) scenario of application of different pesticides in India [11].

Figure 2. A scheme showing the different stages involved in pesticide cycle, source: website: The University of Reading, ECIFM, pesticides.
environment. Not only the farmers in rural areas but also the people in urban areas use more than half of pesticide in their homes and home gardeners, in and around the schools, business areas, and hospitals etc.
A pesticide is that compound which should be lethal to the targeted pests only and not to the non-target living organisms such as humans and animals. But the disproportionate application of these compounds has adversely affected the flora and fauna of the entire ecosystem. After the death of about 100 people in India due to consumption of parathion contaminated wheat flour [12], Indian Council of Agricultural Research (ICAR) constituted a committee to suggest possible remedies to combat the toxicity caused due to presence of pesticides and their residues in the edibles [13]. After the first warning about the poisoning of organochlorines (OC) to living systems [14], the reports from US National Academy of Sciences endorsed the same by studying the toxicity of OC compounds and their metabolites in birds [15]. The pesticides have been shown to display their effects by causing xenotoxicity, alterations in body’s immunity, reproductive system and other physiological processes of different organisms thereby generating several diseases including cancer [16-18].
3. Properties of Pesticides
The role of pesticides is to kill the insect-pests, but this property of pesticides makes them a poison to other organisms including different birds, fish species, animals and humans. These pesticides are not target specific. The constant exposure of pesticides to non-target species may lead to induce toxicity once it crosses the threshold limit in the system. It is known that the major portion of the pesticide applied in an area reaches into healthy environmental components such as aquatic reserves (ponds, lakes, rivers and oceans), where they gradually get accumulated into other organisms [5].
3.1. Potential Chemical Component of the Pesticides
The potentially active ingredient of any pesticide is the chemical compound that brings about the desired effect. In the case of a pesticide, the active ingredient is the material intended to kill the target pest and has the potential to be dangerous to other animals. The other substances in a pesticide are usually inert (not reactive) and are used to carry the toxin (active ingredient) while making its application easier. The active ingredient is usually a very small percentage of the total ingredients in a pesticide [5].
3.2. Toxicity Bioassay
The pesticide toxicity is the degree to which it is able to damage an exposed organism. Toxicity can refer to the effect on a whole organism, such as an animal, bacterium, or plant, as well as the effect on a substructure of the organism, such as a cell (cytotoxicity) or an organ (organotoxicity), such as the liver (hepatotoxicity). These terms are defined for toxicity to specified animals after exposure of a specified time. These toxicity terms can apply to target pests or non-target animals, including humans. The most common of these toxicity terms are LD50 and LC50.
3.3. Lethal Dose Determination
According to Cook et al. [5], the LD50 is a measure of a substance’s toxicity. LD50 stands for the dose of a substance, such as a pesticide, that kills one-half of the animals tested. The LD50 for a specified animal is the amount that must be in or on the body of that type of animal to kill half of the affected population within a given amount of time. When the LD50 of chemicals in animals is compared it gives a relative ranking of the toxicity to each animal. LD50’s are often calculated using rats, because humans cannot be tested in a way that will test how many are killed, given a certain dose. This information from LD50 is calculated for rats and can be used to estimate the LD50 for humans by multiplying by 70 (the average kilogram mass of humans). Substances that are toxic to one mammal are often toxic to another. This conversion is an estimate that might not accurately calculate limits for human exposure. The comparative toxicity of pesticides is shown in Table 1.
3.4. Lethal Concentration Determination
LC50 stands for the lethal concentration of a material to kill one-half of the animals tested in a specified amount of time. It is the amount of a material that comes in contact with the animal being tested that will kill one-half the population affected. This lethal concentration may be in a medium such as the air or a body of water. In this context, it will deal with the amount of a substance in water that would kill animals that live in that body of water. In other words, if the LC50 is present for a type of fish, then the concentration of a toxin in the water is at a level that will kill one-half of that type of fish that are present in that body of water. Some commonly used insecticides are given with their properties and LC50 for fish in Table 2.
3.5. Pesticide Formulation
The main purpose of pesticide formulation is to manufacture a product which has optimum biological effi ciency, is convenient to use, and minimizes environmental impacts. Active ingredients are mixed with solvents, adjuvants (boosters), and fillers as necessary to achieve the desired formulation. Pesticides may be in several physical forms or formulations. They may be water dispersible granules, dusts, aerosols, emulsifiable concentrates, flowable concentrates, solutions, solid baits, or liquid baits. They are sold in these forms because of advantages they offer to their application. Formulations influence the deposition on the soil or plant surface. In turn, they may regulate or influence its uptake by the plant or its movement into the upper soil profile. Formulations also determine the wash off or runoff characteristics of a pesticide in rain or irrigation water [5].
3.6. Pesticide Efficacy
Cook et al. [5] reported that the effective dose is the amount needed to kill a target pest. The amounts that are less than the effective dose will most likely not kill the target pest. In this case, the pesticide is applied without the ability to achieve the desired results, that is, elimination of the pest. Instead, this pesticide is added to the environment for no gain. Amounts greater than the effective dose will not necessarily kill the target pest better. Instead, this larger dose may kill more non-target pests, cost more money to apply, and pollute the environment.
3.7. Persistence of Pesticides
The half-life is one measure of the persistence of a chemical. The half-life of a substance is the time required for that substance to degrade to one-half its previous concentration. In other words, if a pesticide has a half-life of 10 days, half of the pesticide normally breaks down by 10 days after application. After this time, the pesticide continues to break down at the same rate. In general, the longer the half-life, the greater the potential for movement, simply because it is present in the environment for a longer time. However, the half-life of a material such as a pesticide is not an absolute factor. Soil moisture, temperature, available oxygen, microbial popu-
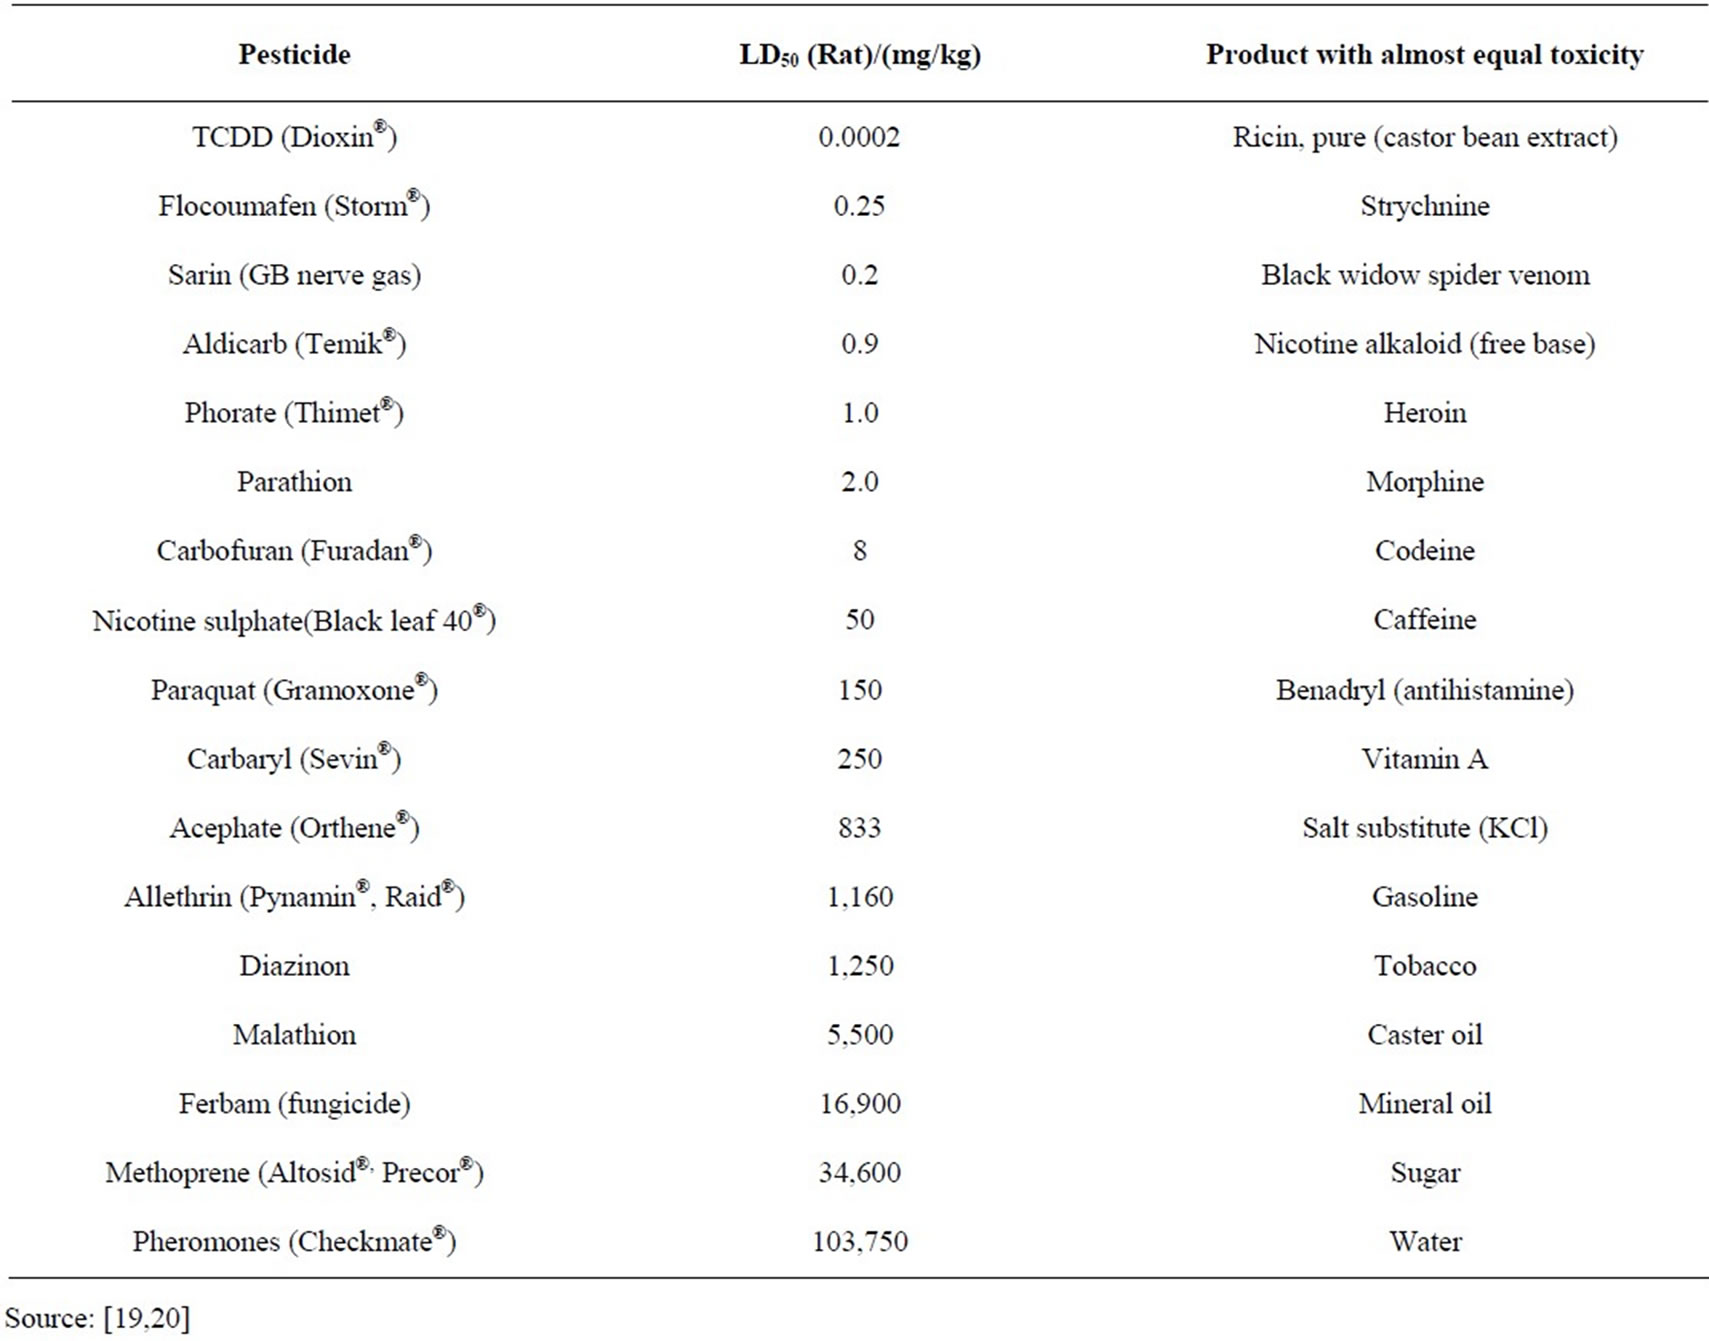
Table 1. Comparative toxicity of pesticides and natural products.
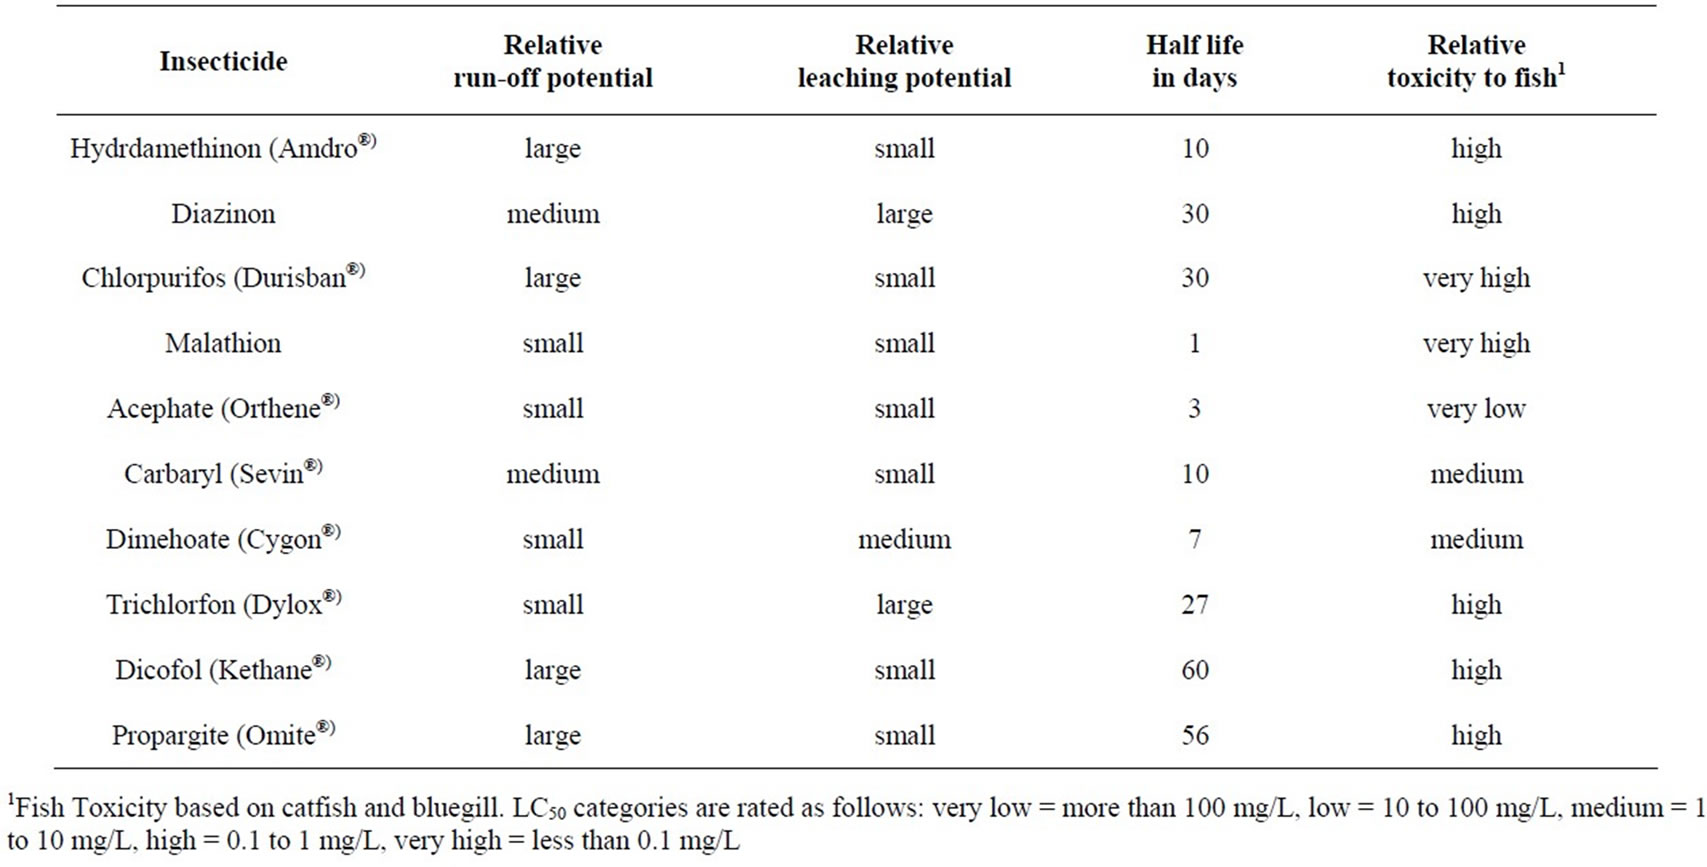
Table 2. Characteristics of some commonly used insecticides along with their relative toxicity to fish.
lations, soil pH, photo degradation and other factors may cause the half-life of a substance to vary [5].
3.8. Acceptable Daily Intake (ADI)
It is used to establish a negligible residue level for pesticide tolerances on human food or animal feed products. This term has been now replaced by another term, negligible residue. Negligible residue means any amount of a pesticide chemical remaining in or on a raw agricultural commodity or group of raw agricultural commodities that would result in a daily intake regarded as toxicologically insignificant on the basis of scientific judgment of adequate safety data [5].
3.9. Maximum Contaminant Level (MCL)
This term refers to toxic chemicals regulated as contaminants under the Safe Drinking Water Act (SDWA). Although MCLs do not apply to pesticides specifically, they apply in a general sense. Under SDWA, pesticides are grouped with a larger collection of toxic chemicals that can affect human health when found at certain specific concentrations above established MCLs in drinking water. The Safe Drinking Water Act and the associated regulations try to prevent contamination of drinking water from reaching MCLs through continuous monitoring of water supplies. Regulations under the SDWA establish MCLs in much the same way as FIFRA, FDCA, and the Food Quality Protection Act of 1996 establish pesticide tolerances with negligible residues [5].
4. Pesticides Classification
4.1. Insecticides
An insecticide is a pesticide used against insects. They include ovicides and larvicides used against the eggs and larvae of insects respectively. Insecticides are used in agriculture, medicine, industry and the household. The use of insecticides is believed to be one of the major factors behind the increase in agricultural productivity in the 20th century. Nearly all insecticides have the potential to significantly alter ecosystems; many are toxic to humans; and others are concentrated in the food chain. Insecticides applied to crops and in urban areas do not degrade immediately but they break down after a certain period of time. Some of these pesticides are very persistent like organochlorines and remain in the environment for long periods (upto several years). Persistence is a good quality for some pesticides because it means that it remains effective in killing pests for a long time. However, this attribute means that pesticides remain around long enough to enter water sources under some conditions and keep causing toxicity on aquatic organisms for longer durations. Pesticides from the sites of application reach to different water bodies by rainfall and irrigation as they can wash pesticides from areas of application. These pesticides can bioaccumulate in invertebrates and fish species and pass through the food chain to birds, mammals, and finally even to humans.
4.2. Herbicides
The extent to which a plant suffers from the effects of a herbicide ranges from extremely little to the plant being highly sensitive, resulting in overall plant death. This range of susceptibility is often referred to as “selectivity”. In other words, given herbicides will harm some plant but not others. Some herbicides are referred to as “non-selective” in that they are hazardous to most forms of plant life if applied at dosages recommended for weed control. However, herbicides, work by affecting inherent processes to plants, not mammals or insects. This is the reason for their relatively low order of mammalian toxicity. The persistence of some herbicides can be looked upon as either a detriment or advantage. Obviously, the longer these materials remain active in the soil, the less appealing they are environmentally.
Different herbicides vary widely in their potential to enter water supplies. Some herbicides are water soluble enough to enter into solution with rainfall or irrigation water. Their final destination is highly dependent upon the conditions under which they are applied. They can leach downward or move with the erosion of soil particles if applied to a relatively bare soil surface. The extent to which either of these events occurs depends upon several physical and chemical properties of both the soil and the herbicide.
4.3. Fungicides
Fungicides are chemical compounds or biological organisms used to kill or inhibit fungi or fungal spores. Fungi can cause serious damage in agriculture, resulting in critical losses of quality and yield. Fungicides are used both in agriculture as well as to treat fungal infections in animals. Chemicals used to control oomycetes, which are not fungi, are also referred to as fungicides as oomycetes use the same mechanisms as fungi to infect plants. Fungicide can either be contact, translaminar or systemic. Contact fungicides are not taken up into the plant tissue and only protect the plants where the spray is deposited; translaminar fungicides redistribute the fungicide from the upper, sprayed leaf surface to the lower, unsprayed surface. Systemic fungicides are taken up and redistributed through the xylem vessels to the upper parts of the plant. New leaf growth is protected for a short period. Most fungicides are commercially available in a liquid form. The most common active ingredient is sulfur, present at 0.08% in weaker concentrates, and as high as 0.5% for more potent fungicides. Fungicides in powdered form are usually around 90% sulfur and are very toxic. Other active ingredients in fungicides include neem oil, rosemary oil, jojoba oil, and the bacterium Bacillus subtilis. Fungicide residues have been found on food for human consumption, mostly from post-harvest treatments. Some fungicides are dangerous to human health, such as vinclozolin, which has now been removed from use.
Fungicides include as targets a range of pests broader than insecticides. They are an area of concern for maintaining water quality because of their wide use by agriculture and home owners. Fungicides present a clear danger of pollution through their introduction into waters by improper application, storage and disposal. However, additional pollution hazards exist from drift, leaching, and runoff from treated areas where applications have been legal and proper [5].
However, knowing about water pollution potential of fungicides, one can plan their use and minimize chances of these chemicals entering surface and groundwater. Fungicides work in a variety of ways. The ability of the target organisms to rapidly develop resistance has generated a wide variety of chemical actions. The persistence of some fungicides offers advantages and disadvantages to both the user and the environment. The more persistent fungicides present the hazard of remaining in the environment long enough to enter soil and water profiles. It is also important that the fungicide active ingredient may not be as toxic or as environmentally hazardous as some of the inert ingredients in the formulation [5].
5. Entry of Pesticides into Water Systems
Cook, et al. [5] had mentioned that pesticides can enter water through surface runoff or through leaching. These two fundamental processes are linked to the earth’s hydrologic cycle. When we include urban water use in surface runoff, pesticide residues in municipal wastewater fit the hydrologic model. Figure 3 shows the hydrologic cycle and gives a graphic representation of the various routes water takes to reach a low point. When water enters an established body of water or backs-up behind a barrier, it carries with it the dissolved materials that it picked up in the media through which it flowed. Figure 4 shows the routes pesticide pollutants may take to reach surface or groundwater. It is difficult to determine how materials that become water pollutants actually get into water sources. Often it is the action of water itself that causes pollutants to enter bodies of water. The source
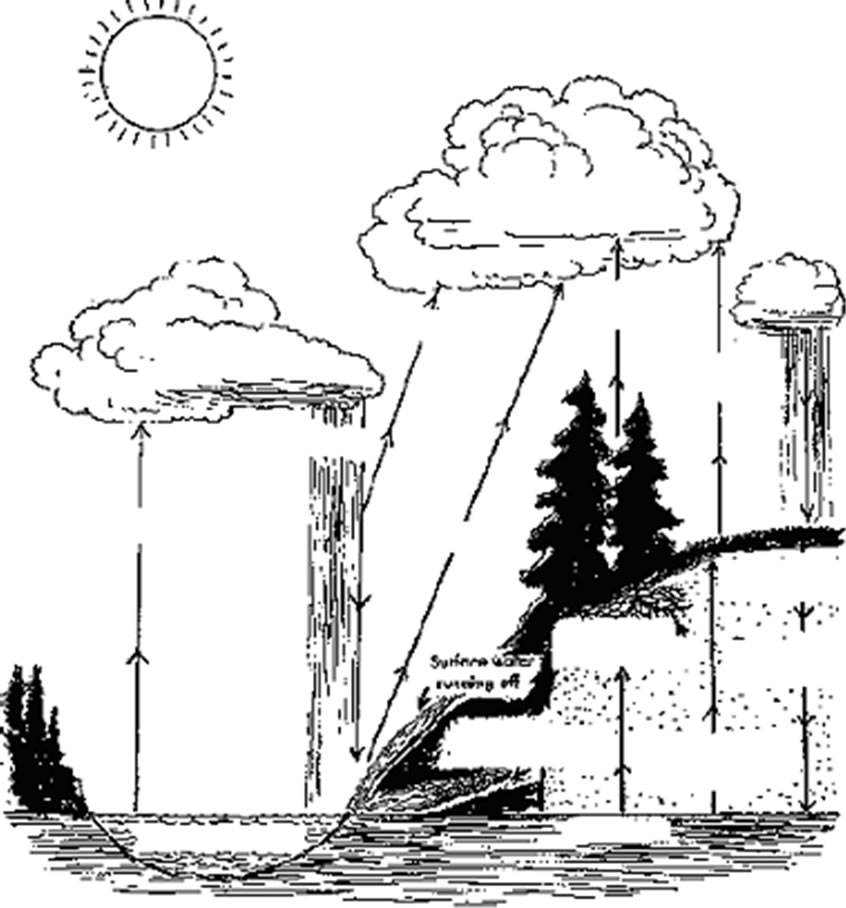
Figure 3. The hydrologic cycle. Different levels of water evaporation are shown. Water always flows in the lowest point.(Source: texas agriculture extension service, the texas A&M university system, “pesticide characteristics that effect water quality”, Jerry L.Cook, Paul Baumann, John A Jackmang and Doung Stevenson, texas A&M university, college station, TX 77842.
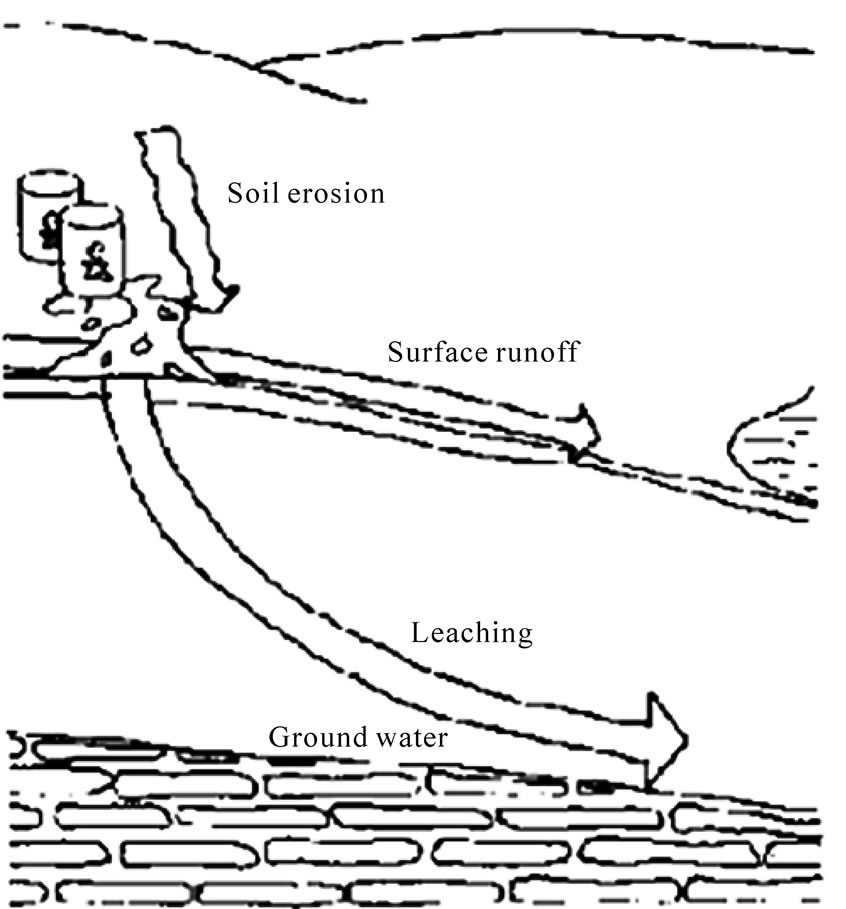
Figure 4. The pesticides can pollute water either though soil erosion, surface runoff or leaching. (Source: Texas agriculture extension service ,the Texas A&M university system,
“pesticide characteristics that effect water quality”, Jerry L.Cook, Paul Baumann, John A Jackmang and Doung Stevenson, Texas A&M university, college station, TX 77842.
of water that transports pollutants may be natural, such as rainfall, or caused by humans, as in the case of irrigation or diversion of water. Pollutants also may enter bodies of water by wind or by their own passive movement. Movement of pollutants is a complex system and pesticides can come from either point sources or nonpoint sources. Point sources are small, easily identified objects or areas of high pesticide concentration such as tanks, containers, or spills. Non-point sources are broad, undefined areas in which pesticide residues are present.
5.1. Surface Runoff
Water that flows across the surface, whether from rain, irrigation, or other water released onto the surface, always flows downhill until it meets with a barrier, a body of water, or begins to percolate into the soil. Figures 3 and 4 show examples of surface runoff and how it can pick up and carry pesticides into surface or groundwater [5].
5.2. Agriculture and Water Quality Conflicts
Water quality problems, thought to be caused in part by cropland runoff or non-point source pollution, affect drinking water and the nation’s lakes, streams, and estuaries. Action taken by public officials to protect our water resources may change the diversity, quality, and quantity of farm products, production systems, and ultimately the prices consumers pay. Losses from impaired water quality can cost billions of dollars, not just to agriculture but also to recreation, commercial fishing, municipal water treatment, and river navigation.
Groundwater resources are vulnerable to contamination from many directions (Figure 2). When animal wastes, fertilizers, herbicides, insecticides, and fungicides are applied to cropland, some residues remain in the soil after plant uptake and may leach into subsurface waters, or the residues may move to surface water by dissolving in runoff or adsorbing to sediment. Spray drifts during application may carry pesticides to surface waters also. Chemical or physical processes transform residues into products that may also contaminate water. For example, nitrogen fertilizer or nitrogen from animal waste may be transformed first into ammonium and then into nitrates. Nitrates can turn into nitrites and both are detrimental to human health.
Nutrients, particularly nitrogen and phosphorus from fertilizers, promote algae growth and premature aging of lakes, streams, and estuaries (a process called eutrophication). Suspended sediment impairs aquatic life by reducing sunlight, damaging spawning grounds, and may be toxic to aquatic organisms. Pesticide residues that reach surface water systems may also affect the health and vigor of freshwater and marine organisms.
6. Water Quality Concerns
Drinking water for humans from contaminated wells is exposed to pesticide and fertilizer residues. A known human health risk from nitrate contamination is infant methemoglobinemia, a condition where nitrates are converted into nitrites in the digestive system, impairing the ability of infants’ blood to carry oxygen. Nitrites are also considered carcinogenic (tumor causing) by some analysts. Concentration of nitrates or pesticides in drinking water may be below levels at which acute health effects have been observed. However, continued exposure may result in chronic effects (i.e., reproductive impairments, cancer, etc.) to humans or other organisms. The degree of health risk associated with drinking water containing traces of pesticides or nitrates at, or below, levels where human health could be endangered is poorly understood.
Some pesticides are considered carcinogenic in large doses, and as a result, the United States Environmental Protection Agency (EPA) has issued health standards defining maximum allowable contamination levels for 26 pesticides. Contaminated groundwater that resurfaces also affects nontargeted plants, birds, or aquatic organisms (some of which are endangered) in the environment. Due to several years of control efforts, the share of pollution from point sources, such as discharges from sewage treatment plants or industrial sources, appears to be lessening. According to the EPA, the non-point source pollution resulting from agricultural tillage, pesticide application, and urban development sites is the chief cause of surface water degradation today.
Agricultural runoff is the single most extensive source of surface water pollution, accounting for 55 percent of impaired river miles and 58 percent of impaired lake acres assessed by the States in 1986 and 1987. In a recent study by USDA’s Economic Research Service (ERS), the degree to which agricultural runoff contributed to delivery of nutrients and sediments to lakes and streams were calculated. Out of 99 watersheds examined, 48 had excessive levels of nutrients or sediment. The study found agriculture to be a “significant source” (defined as contributing more than 50 percent of pollutant discharge) of nitrogen in nine watersheds. Agricultural sources of sediment were significant in 34 watersheds. Thirty-one watersheds had significant agricultural discharge of phosphorus. Another recent ERS study identified the scope and significance of agricultural contributions to coastal water pollution. For the 78 estuarine systems considered, agricultural runoff supplied an average of 24 percent of total nutrients and 40 percent of total sediment. Agriculture contributed more than 25 percent of total nutrients in 22 of the 78 estuaries. High rates of pesticide losses to surface waters were found in 21 systems. Fifteen estuarine systems showed both significant agricultural nutrients and high pesticide losses.
The extent to which the nation’s groundwater resources are affected by agricultural chemicals is less well known. Discoveries of chemical residuals in groundwater during the late 1970’s and early 1980’s dispelled the commonly held view that groundwater was protected from agricultural chemicals by impervious layers of rock, soil, and clay. Groundwater may also be contaminated by other sources, including nonagricultural use of pesticides and fertilizers, and leaking underground storage tanks.
7. Factors Affecting Pesticide Toxicity in Aquatic Systems
The ecological impacts of pesticides in water are determined by the following criteria:
7.1. Toxicity
Mammalian and non-mammalian toxicity usually expressed as LD50 (“Lethal Dose”): The lower the LD50, the greater the toxicity; values of 0-10 are extremely toxic [22]. Drinking water and food guidelines are determined using a riskbased assessment. Generally, Risk = Exposure (amount and/or duration) × Toxicity. Toxic response (effect) can be acute (death) or chronic (an effect that does not cause death over the test period but which causes observable effects in the test organism such as cancers and tumours, reproductive failure, growth inhibition, teratogenic effects, etc.).
7.2. Persistence
Measured as half-life is determined by biotic and abiotic degradational processes. Biotic processes are biodegradation and metabolism; abiotic processes are mainly hydrolysis, photolysis, and oxidation [23]. Modern pesticides tend to have short half lives that reflect the period over which the pest needs to be controlled.
7.3. Degradates
The degradational process may lead to formation of “degradates” which may have greater, equal or lesser toxicity than the parent compound. As an example, DDT degrades to DDD and DDE.
7.4. Fate (Environmental)
The environmental fate (behaviour) of a pesticide is affected by the natural affinity of the chemical for one of four environmental compartments [23]: solid matter (mineral matter and particulate organic carbon), liquid (solubility in surface and soil water), gaseous form (volatilization), and biota. This behaviour is often referred to as “partitioning” and involves, respectively, the determination of: the soil sorption coefficient (KOC); solubility; Henry’s Constant (H); and the n-octanol/water partition coefficient (KOW). These parameters are well known for pesticides and are used to predict the environmental fate of the pesticide. An additional factor can be the presence of impurities in the pesticide formulation but that are not part of the active ingredient. A recent example is the case of TFM, a lampricide used in tributaries of the Great Lakes for many years for the control of the sea lamprey.
8. Effects of Pesticides on Human Health
Perhaps the largest regional example of pesticide contamination and human health is that of the Aral Sea region. UNEP (1993) [24] linked the effects of pesticides to “the level of oncological (cancer), pulmonary and haematological morbidity, as well as on inborn deformities and immune system deficiencies”. Human health effects are caused by 1) Skin contact: handling of pesticide products, 2) Inhalation: breathing of dust or spray and 3) Ingestion: pesticides consumed as a contaminant on/in food or in water. Farm workers have special risks associated with inhalation and skin contact during preparation and application of pesticides to crops. However, for the majority of the population, a principal source is through ingestion of food which is contaminated by pesticides. Degradation of water quality by pesticide runoff has two principal human health impacts. The first is the consumption of fish and shellfish that are contaminated by pesticides; this can be a particular problem for subsistence fish economies that lie downstream of major agricultural areas. The second is the direct consumption of pesticide-contaminated water. WHO (1993) [25] has established drinking water guidelines for 33 pesticides. Many health and environmental protection agencies have established “acceptable daily intake” (ADI) values that indicate the maximum allowable pesticide daily ingestion over a person’s lifetime without appreciable risk to the individual. For example, Wang and Lin (1995) [26] studying substituted phenols, tetrachlorohydroquinone, a toxic metabolite of the biocide pentachlorophenol, was found to produce significant and dose-dependent DNA damage. The harmful efects of pesticides are 1) Death of the organism, 2) Cancers, tumours and lesions on fish and animals, 3) Reproductive inhibition or failure, 4) Suppression of immune system, 5) Disruption of endocrine (hormonal) system, 6) Cellular and DNA damage, 7) Teratogenic effects (physical deformities such as hooked beaks on birds), 8) Poor fish health marked by low red to white blood cell ratio, excessive slime on fish scales and gills, etc., 9) Intergenerational effects (effects are not apparent until subsequent generations of the organism) and 10) Other physiological effects such as egg shell thinning. These effects are not necessarily caused solely by exposure to pesticides or other organic contaminants, but may be associated with a combination of environmental stresses such as eutrophication and pathogens [27,28].
Pesticides are commonly found in water. The groundwater from some US and Canadian provinces has been reported to contain the residues of 39 pesticides and their metabolites [29]. The calculation of level of allowable pesticide for water is made depending on the exposure of children and adults exposure; the children being 4 times more vulnerable to the pesticide toxicity than adults [30]. Residues of pesticides that are “severely restricted” because of their serious effects on human health were also found in significant quantities in the water sources. The pesticide residues exerting serious effects on human health enter the water supply through leaching from soil into ground water.
9. Absorption of Pesticides through Skin and Respiratory Routes
The reports available indicate that the infants and children absorb more pesticides and their residues, insect repellents and pediculocides than the adults through their skin and produce toxicity [29]. It leads to alterations in behavioural pattern and several diseases syndromes such as encephalopathy, ataxia, seizures, muscle cramps, frequent urination and coma [30,31]. However, farmers generally get exposed to the pesticides via spraying of these chemicals into the fields. The absorption of pesticides in farmers through cutaneous and respiratory routes predominantly contributes to the overall pesticide toxicity in them which has been reported to cause non-Hodgkins lymphoma [32].
10. Removal of Toxic Substances Including Arsenic from Drinking Water
Reverse Osmosis (RO) is a process to get rid of all the impurities in drinking water including deadly ions and organisms and pesticide/fertilizer residues. Under RO systems, water is made to pass through a membrane having a pore size of 0.0001 micron under high pressure. Only 5-10 percent of the ions are able to slip across the membrane, which is well within acceptable levels as per all standards including WHO, BIS, etc. RO systems are suitable for removing several of the toxic substances present in water in dissolved form, including fluoride, fertilizer and pesticide residues, and heavy metals. But costs vary, depending on the plant capacity and level of utilization, the level of salinity and other impurities in the water and the distance from the source of water. Costs can range between Rs. 0.03/litre (for brackish water) to Rs. 0.10/litre (for seawater).
A household arsenic treatment method is the ferric chloride coagulation system. This involves precipitation of arsenic by adding a packet of coagulant in 25 litres of tube well water, and subsequent filtration of the water through a sand filter. Field experiments showed arsenic concentration in treated water was nearly 1/20 that of raw water. The cost of chemical (ferric chloride) for treatment is Rs. 0.09/litre of raw water to be treated.
Another method for removing arsenic is based on “sorptive filtration based on iron coated sand bed”. Water is first put in a bucket and stirred for some time to accelerate precipitation of excess iron. It is then allowed to pass through a sand filter where the excess iron is filtered out. Finally the water is passed through an iron coated sand filter. But, the efficiency of removing arsenic reduces drastically beyond a certain bed volume with the arsenic concentration of treated water crossing the permissible limit of 50 ppb. The third method involves filtration of arsenic from raw water by passing it through a gravel media containing iron sludge. An evaluative study showed the first two systems to be superior, with the first one found to be most acceptable to the villagers.
11. Water Pollution Case Study Shows Pesticide Pollution in India
One of the most terrifying effects of pesticide contamination of groundwater came to light when pesticide residues were found in bottled water. Between July and December 2002, the Pollution Monitoring Laboratory of the New Delhi-Based Centre for Science and Environment (CSE) analyzed 17 brands of bottled water; both packaged drinking water and packaged natural mineral water, commonly sold in areas that fall within the national capital region of Delhi. Pesticide residues of organochlorine and organophosphorus pesticides, which are most commonly used in India, were found in all the samples. Among the organochlorines, gamma-hexachlorocyclohexane (lindane) and DDT were prevalent, while among organophosphorus pesticides, Malathion and Chlorpyrifos were the most common. All these were present above the permissible limits specified by the European Economic Community (EEC), which is the norm, used all over Europe. One may wonder as to how these pesticide residues get into bottled water that is manufactured by several big companies. This can be due to several reasons. There is no regulation that the bottled water Industry must be located in ‘clean’ zones. Currently, the manufacturing plants of most brands are situated in the dirtiest industrial estates or in the midst of agricultural fields. Most companies use bore-wells to pump out water from the ground from depths varying from 24-152 m below the ground. The raw water samples collected from the plants also revealed the presence of pesticide residues.
Thus, the fault obviously lies in the treatment methods used. These plants use membrane technology, where the water is filtered using membrane with ultra-small pores to remove fine suspended solids and all bacteria and protozoa and even viruses. While nanofiltration can remove insecticides and herbicides but it is expensive and thus rarely used. Most industries also use an activated charcoal adsorption process, which is effective in removing organic pesticides but not heavy metals. To remove pesticides, the plants use reverse osmosis and granular activated charcoal methods. So even though the manufacturers claim to use these processes, the presence of pesticide residues points to the fact that either the manufacturers do not use the treatment process effecttively or only treat a part of the raw water. The low concentrations of pesticide residues in bottled water do not cause acute or immediate effects.
However, repeated exposure even to extremely miniscule amounts can result in chronic effects like cancer, liver and kidney damage, disorders of the nervous system, damage to the immune system and birth defects. CSE reported pesticide residues in bottled water as well as in popular cold drink brands sold across the country. This is because the main ingredient in a cold drink or a carbonated non-alcoholic beverage is water and there are no standards specified for water to be used in these beverages in India. There were no standards for bottled water in India till September 29, 2000, when the Union Ministry of Health and Family Welfare issued a notification (No. 759(E)) amending the Prevention of Food Adulteration Rules, 1954. The BIS (Bureau of Indian Standards) certification mark became mandatory for bottled water from March 29, 2001. However, the parameters for pesticide residues remained ambiguous. A series of Committees were established and eventually on 18th July 2003, amendments were made in the Prevention of Food Adulteration Rules stating that pesticide residues considered individually should not exceed 0.0001 mg/L and that the total pesticide residues should not be more than 0.0005 mg/L and that the analysis shall be conducted by using internationally established test methods meeting the residue limits specified herein. This notification came into force from January 1, 2004.
12. New System Minimizes Pesticide Pollution in Aquifers
The recent report from the Institute of Natural Resources and Agrobiology of the Spanish National Research Council (CSIC) has suggested the development of a new method to encapsulate and slowly release pesticides to prevent the leaching as well as the volatilization of these molecules. This new method helps to encapsulate the pesticide in lecithin liposomes or vesicles leading to the adsorption on clay. The final complex comprising liposomes, pesticide and clay is dispersed in water, allows the chemical compound to be slowly released. This entrapment technique restricts the spread of pesticides and their residues to other surfaces and aquifers; thereby acting as substances of minimal toxicological concern [33].
13. Polluted River Stretches
13.1. Environmental Factors Influencing River Water Quality
Due to environmental conditions such as basin lithology, vegetation and climate the river water quality varies. In small watershed, spatial variations extends over orders of magnitude for most major elements and nutrients, while this variability is of lesser magnitude for lower major basins. Therefore, the standard river water use for reference is not applicable and it is because of this that the natural waters can possibly is unfit for various human uses, even including drinking.
The rivers carry three major natural sources of dissolved and soluble matter namely the atmospheric inputs of material, the degradation of terrestrial organic matter and the weathering of surface rocks. These substances are carried through soil and porous rocks and finally reach the rivers. On their way, they are affected by numerous processes such as recycling in terrestrial biota and storage in soils. The exchange between dissolved and particulate matter and loss of volatile substances to the atmosphere, production and degradation of aquatic plants within rivers and lakes etc. get affected. As a result of these multiple sources and pathways, the concentrations of elements and compounds found in rivers depend on physical factors (climate, relief), chemical factors (solubility of minerals) and biological factors (uptake by vegetation, degradation by bacteria). The most important environmental factors controlling river chemistry are 1) Occurrence of highly soluble (halite, gypsum) or easily weathered (calcite, dolomite, pyrite, olivine) minerals, 2) Distance to the marine environment which controls the exponential decrease of ocean aerosols input to land (Na+,  ,
,  , and Mg2+), 3) Aridity (precipitation/runoff ratio) which determines the concentration of dissolved substances resulting from the two previous processes, 4) Terrestrial primary productivity which governs the release of nutrients (C, N, Si, K), 5) Ambient temperature which controls, together with biological soil activity, the weathering reaction kinetics and 6) Uplift rates (tectonism, relief) Stream quality of unpolluted waters (basins without any direct pollution sources such as dwellings, roads, farming, mining etc.
13.2. River Water Pollution
Most of the Indian rivers and their tributaries viz., Ganges, Yamuna, Godavari, Krishna, Sone, Cauvery Damodar and Brahmaputra are reported to be grossly polluted due to discharge of untreated sewage disposal and industrial effluents directly into the rivers. These wastes usually contain a wide variety of organic and inorganic pollutants including solvents, oils, grease, plastics, plasticizers, phenols, heavy metals, pesticides and suspended solids. The indiscriminate dumping and release of wastes containing the above mentioned hazardous substances into rivers might lead to environmental disturbance which could be considered as a potential source of stress to biotic community. As for example, River Ganges alone receives sewage of 29 Class I cities situated on its banks and the industrial effluents of about 300 small, medium, and big industrial units throughout its whole course of approximately 2525 km. Identically Yamuna is another major river, has also been threatened with pollution in Delhi and Ghaziabad area. Approximately 515,000 kilolitres of sewage waste water is reported to be discharged in the river Yamuna daily. In addition, there arc about 1,500 medium and small Industrial units which also contribute huge amounts of untreated or partially treated effluent to the river Yamuna every day.
Similarly many other rivers were surveyed during past two decades with respect to their pollutional status. In addition to domestic and industrial discharge into the rivers, there were continued surface run off of agricultural areas, mines and even from cremation on the river banks. According to a report, over 32 thousand dead bodies were cremated at the major burning Ghats per year in Varanasi alone in the year 1984.
13.3. Pollution in the Ganga river
The Ganga Basin, the largest river basin of the country, houses about 40 percent of population of India. During the course of its journey, municipal sewages from 29 Class I cities (cities with population over 100,000), 23 Class II cities (cities with population between 50,000 and 100,000) and about 48 towns, effluents from industries and polluting wastes from several other non-point sources are discharged into the river Ganga resulting in its pollution. The NRCD records, as mentioned in audit report, put the estimates of total sewage generation in towns along river Ganga and its tributaries as 5044 MLD (Million Litres per Day). According to the Central Pollution Control Board Report of 2001, the total wastewater generation on the Ganga basin is about 6440 MLD.
Many towns on the bank of the Ganga are highly industrialised. Most of the industries have inadequate effluent treatment facilities and dump their wastes directly into the river. A high concentration of tanneries in Kanpur has further aggravated the situation. Besides other chemical and textile industries, Kanpur has 151 tanneries located in a cluster at Jajmau along the southern bank of the Ganga with an estimated waste water discharge of 5.8 to 8.8 million litres per day. Out of 151 tanneries in Jajmau, 62 tanneries use exclusively the chrome tanning process, 50 tanneries use vegetable tanning processes, and 38 tanneries use both chrome and vegetable tanning. The Indian government under the Ganga Action Plan (GAP) has implemented several schemes for the abatement of pollution of the Ganga by tanneries. However, there are violations of the pollution control measures, and tannery effluents are still found in the river.
13.4. Pollution in the Yamuna River
River Yamuna is the primary source of drinking water for Delhi, the capital of India, and also for many cities, towns and villages in the neighbouring states of Uttar Pradesh, Uttaranchal and Haryana. In the last few decades, however, there has been a serious concern over the deterioration in its water quality. The river has been receiving large amounts of partially treated and untreated wastewater during its course, especially between Wazirabad and Okhla, National Capital Territory (NCT) of Delhi. Pollutants flowing into the river are contributed from the waste of the cities situated along its bank. Once the lifeline of Delhi, Yamuna has now become the most polluted water resource of the country. It now looks like a sewer. From big industries and factories to people living in big colonies, slums and rural areas, all pollute the river with impunity because of untreated water. Increasing pollution of the Yamuna has now become an international issue and a cause of concern for environmentalists.
13.5. Impact of River Water Pollution
The pollutants include oils, greases, plastics, plasticizers, metallic wastes, suspended solids, phenols, toxins, acids, salts, dyes, cyanides, pesticides etc. Many of these pollutants are not easily susceptible to degradation and thus cause serious pollution problems. Contamination of ground water and fish-kill episodes are the major effects of the toxic discharges from industries. The impact involves gross changes in water quality viz. reduction in dissolved oxygen and reduction in light penetration that’s tends loss in self purification capability of river water.
On the worldwide scale, the river water pollution leads hazardous impact on aquatic animals and plants. Some studies show alarming condition of river pollution implications. Pratap and Vandana [34] performed detailed study on pesticide accumulation in Fish species and concluded that, pesticide bioaccumulation was higher in cat fishes as compared to carps and have species specific in their tissues (liver, brain and ovary) causing metabolic and hormonal imbalance affecting at GnRH and GTH secretion. The reproductive sex steroid hormones were lowered in cat fishes and carps of the polluted rivers. They suggested that the bioaccumulated insecticide in ovary may cause blocking of the receptor site so that natural hormone cannot bind at the site of estrogen receptor which may cause the dysfunctions of the reproduction in cat fishes and carps inhabiting the polluted river Gomti and Ganga. They also suggested that the fish bioaccumulated insecticide beyond permissible limit must be avoided for the food purpose from such polluted rivers.
Contamination by synthetic organic pollutants is a more recent phenomenon which is even more difficult to demonstrate for lack of appropriate monitoring. The DDT content of the Yamuna River which flows through Delhi is one of the highest ever reported, many other problems affect river water quality on a global scale. Very severe pollution by pathogenic microorganisms is still the prime cause of waterborne morbidity and mortality although it is difficult to establish reliable statistical correlation in each case. Many streams and rivers in South America, Africa and particularly on the Indian sub-continent show high coliform levels together with high BOD and nutrient levels. Eutrophication, which has spread widely to lakes and reservoirs of developing countries now also, affects slow flowing rivers.
Another shocking incident came in picture recently, shows a death alarm of river pollution. Yamuna river water is behind death of crocodiles in the Chambal Sanctuary. Chambal lost over 100 crocodiles in the last 72 days to a mysterious toxin released, in all possibility, by its very own sanctuary—the river Yamuna. Initially crocodile’s deaths were reported from 35 km stretch of National Chambal Sanctuary, where the Chambal and Yamuna rivers meet, but now crocodile’s deaths are reported from upstream also. Beside, other forms of aquatic life are also coming in the area of the impact. For instance, two dolphins and a Crocodile have also died recently. Vets and research labs involved in the probe have confirmed that toxins caused around 103 deaths. They unanimously agree toxins came from either the contaminated food or the Yamuna water. After almost three months since 16 bodies were fished out from Barchauli village in Etawah range of national Chambal sanctuary on December 8, it is gout which has been noted in regularity in all 103 carcasses. The bodies show uric acid deposition in visceral organs and also joints of animals. Initial findings point towards ecological degradation of river system. Experts agree that Tilapia, an exotic fish species, could be the possible carrier of toxins and consumption of this species by crocodiles may have led to their death.
13.6. Prevention and Control of Pollution
Some actions have been taken by The Government of India to control pollution in the river systems. Ganga action plan is much known of them. Ganga Action Plan (GAP) was launched for immediate reduction of pollution load on the river Ganga. It was prepared by Department of Environment (now Ministry of Environment & Forests) in December 1984 on the basis of a survey on Ganga basin carried out by the Central Pollution Control Board in 1984. The Plan approved by the Government in April 1985 pursued two objectives: to reduce the pollution load in the Ganga and establish sewage treatment systems in 25 Class I cities bordering the river. To oversee the implementation of the GAP and lay down policies and programmes, Government of India constituted the Central Ganga Authority (CGA) under the chairmanship of the Prime Minister in February 1985. It has been renamed as the National River Conservation Authority (NRCA) in September 1995, as a wing of the Department of Environment, to execute the projects under the guidance and supervision of the CGA. The state agencies like Public Health Engineering Department, Water and Sewage Boards, Pollution Control Boards, Development Authorities, Local Bodies etc. were responsible for actual implementation of the scheme.
13.7. Failure of Ganga Action Plan
The Ganga action plan launched by the Government of India with much fanfare has failed in achieving its objectives. The pollution levels in Ganga are either same or even higher. The Sankat Mochan Foundation found that the schemes for Varanasi-India under the GAP Phase-I suffered from several shortcomings. Some major ones are 1) The sewage pump at Konia terminal, when run to its capacity causes heavy surcharging of the old trunk sewer. It causes erosion of the sewer linings and also spillage of sewage from manholes in low-lying areas of the city, 2) Over 115 MLD sewage, which could be easily handled by the Konia Terminal, is actually being diverted to Dinapur Sewage Treatment Plant. The Dinapur STP can handle only 80 MLD, resulting in by-passing of 35 MLD untreated sewage into Varuna and eventually into Ganga. This is also very expensive in terms of energy consumption, 3) Power breakdowns, which are common in Varanasi, causes a sudden back pressure in the system and massive spillage of sewage onto the roads and streets of the city, 4) The plant at Dimapur has to be shut down completely during monsoons. Thus for three to four months in a year all the sewage goes untreated, 5) The biogas generator in the Dinapur STP does not function hence the plant is ineffective due to shortage of power. Tens of millions of Rupees have been wasted on its construction, while the villages around the Dinapur STP suffer from polluted water, water borne diseases and mosquitoes.
The observations on the GAP Phase I schemes for Varanasi-India indicate that: 1) BOD in the religious bathing area remains dangerously high even after completion of the GAP I. The BOD is as high as 25 mg/L at the confluence of Ganga and Varuna rivers. 2) The faecal coliform varied from 70000 mpn/100mL to 1.5 million mpn/100mL. The BOD and the faecal coliform levels increase from upstream to downstream as more and more untreated sewage enters the river. 3) These values when compared with those six km upstream of Assi are an eye opener. The figures in this area, where the city of Varanasi starts and no point discharges of effluents take place are 2 mg/L of BOD and undetectable faecal coliform. 4) Even in the treated sewage coming out from the Dimapur STP, the BOD is dangerously high at 50mg/L against a maximum permissible value of 20mg/L. Suspended solids are 100mg/L. Faecal coliform levels remain as high as that entering the STP, since there is no arrangement for controlling it.
According to environmentalists, about 90 percent of pollution into the holy river is caused by sewage generation while only about 5 to 6 percent can be blamed on bathing and other activities. The real sources of pollution i.e. sewage, however, still continues to flow into the river. By 1996, the first phase of the Ganga Action Plan (GAP) was completed and the government expanded its pollution abatement activities by enlarging the bureaucracy. They created the National River Conservation Directorate (NRCD) and folded the (GAP) into that Directorate.
13.8. The Ganga Action Plan Phase II
Since GAP I did not cover the pollution load of Ganga fully; the Ganga Action Plan Phase II (GAP II) was launched in stages between 1993 and 1996. 1) On the tributaries of river Ganga viz. Yamuna, Damodar and Gomati. 2) In 25 class-I towns left out in Phase I. 3) In the other polluting towns along the river. The Cabinet Committee on Economic Affairs (CCEA) approved the GAP-II in various stages during April 1993 to October 1996. The States of Uttarakhand, Haryana, Delhi, Uttar Pradesh, Bihar and West Bengal were to implement the GAP-II by treating 1912 MLD of sewage. Against this, a treatment capacity of 780 MLD has been created so far (October 2003). The approved cost of GAP II is Rs. 22854.8 million (excluding establishment charges) against which, an amount of Rs.7923.8 million has been released till 30 November 2003. The total number of schemes sanctioned under GAP II so far is 495 at a cost of Rs.13800 million, out of which 318 schemes have been completed. The revised date for completion of GAP II was kept as December 2005. The Ministry of Environment and Forests have now stated that as the second Phase of Gomti Action Plan and Yamuna Action Plan had been approved and these were targeted to be completed by March 2007 and September 2008, respectively, the GAP II was targeted to be completed by December 2008, subject to the availability of funds in time.
13.9. Water Pollution—Related Legislation
The first significant law regarding the protection of environmental resources appeared in the 1970’s with the setting up of a National Committee on Environmental Planning and Coordination, and the enactment of the Wildlife Protection Act, 1972. Since then, three main texts have been passed at the central level that is relevant to water pollution: the Water (Prevention and Control of Pollution) Act, 1974, the Water (Prevention and Control of Pollution) Cess Act, 1977 and the Environment (Protection) Act (1986). The Water Act 1974 established the Pollution Control Boards at the central and state level. The Water Cess Act 1977 provided the Pollution Control Boards with a funding tool, enabling them to charge the water user with a cess designed as a financial support for the board’s activities. The Environment Protection Act 1986 is an umbrella legislation providing a single focus in the country for the protection of environment and seeks to plug the loopholes of earlier legislation relating to environment. The law prohibits the pollution of water bodies and requires any potentially polluting activity to get the consent of the local SPCB before being started.
13.10. Use of Informal Regulation of Pollution
The design of policy instruments for industrial pollution is not only complex but also very daunting in the case of developing countries. In principle, the regulator has an array of physical, legal, monetary, and other instruments at his/her disposal. But the presence of a large number of pollution sources in the form of small-scale industries (SSIs) that lack knowledge, funds, technology and skills to treat their effluent frustrates any instrument applied and leads to overall failure. The failure of industrial pollution control is also attributable to rigid commandand-control regulatory approaches. Regulators are constrained by meagre resources, limited authority and political interference. These problems are compounded by information asymmetries. For all these reasons, numerous studies in India have concluded that despite a strong legal framework and the existence of a large bureaucracy to manage environmental regulation, implementation is very weak. The failure of formal regulation to control pollution has highlighted the significance of informal regulation for achieving environmental goals. There is now considerable interest in “information disclosure” and “rating” as potential tools of industrial pollution control. Some times referred to as the “third wave” of environmental policy, this approach acknowledges the difficulties of monitoring and enforcement and recognises that there are many more avenues of influence than just formal regulation or fines. Firms are sensitive, for example, about their reputation and the future costs that they may incur as a result of liability or accidents. The emergence of this new paradigm for regulation is also related to advances made in our understanding of asymmetric information. Goldar and Banerjee [35] made an attempt to assess the impact of informal regulation of pollution on water quality in Indian rivers. For this purpose, an econometric analysis of determinants of water quality in Indian rivers were carried out using water quality (water class) data for 106 monitoring points on 10 important rivers for five years, 1995-1999. Results showed significant favorable effect of informal regulation of pollution on water quality in rivers in India.
The water quality data generated through National Water Monitoring Programme and River Basin Studies carried out since 1980 indicated deterioration of water quality in riverine segments and other water bodies. The water bodies not meeting the desired water quality criteria are identified as polluted river stretches/water bodies. The deviation of water quality from the desired water quality criteria in the data generated for the river Ganga formed the basis for launching Ganga Action Plan (GAP). Subsequently, 10 river stretches not meeting the desired criteria were identified during 1988-1989. The list of polluted stretches increased to 37 during the year 1992 covering all the major river basins. The polluted river stretches were intensively surveyed by Central Pollution Control Boards (CPCB) and State Pollution Control Boards (SPCBs) to identify the sources of pollution such as Urban Centres and Industrial Units. With the expansion of monitoring network and coverage of more number of rivers for regular monitoring, the numbers of polluted water bodies identified during 2002 are 86 (71 rivers and 15 lakes/ponds/creeks), which are not meeting the desired criteria. Statewise number of polluted stretches in rivers and lakes is given in Table 3.
What is happening to the Yamuna is reflective of what is happening in almost every river in India. More than 700 million Indians do not have adequate sanitation. The United Nations says that 2.1 million children under 5 die each year because of a lack of clean water and the World Bank has warned India that it stands on the edge of an era of severe water scarcity. Nothing illustrates this more vividly than the Yamuna. The Government extracts 1.1 billion litres from it daily, making it the capital’s largest water source. By the time the river leaves Delhi, it turns into a vast drain, carrying an estimated 3.5 billion litres of sewage every day. Its oily black waters cannot sustain fish or plant life. Methane bubbling from its surface can be smelt across the city. Since 1992 the Government has spent 20 billion rupees (£240 million) on cleaning the river but it is not visible. Pollution levels have doubled and less than half of the sewage in the river is treated.
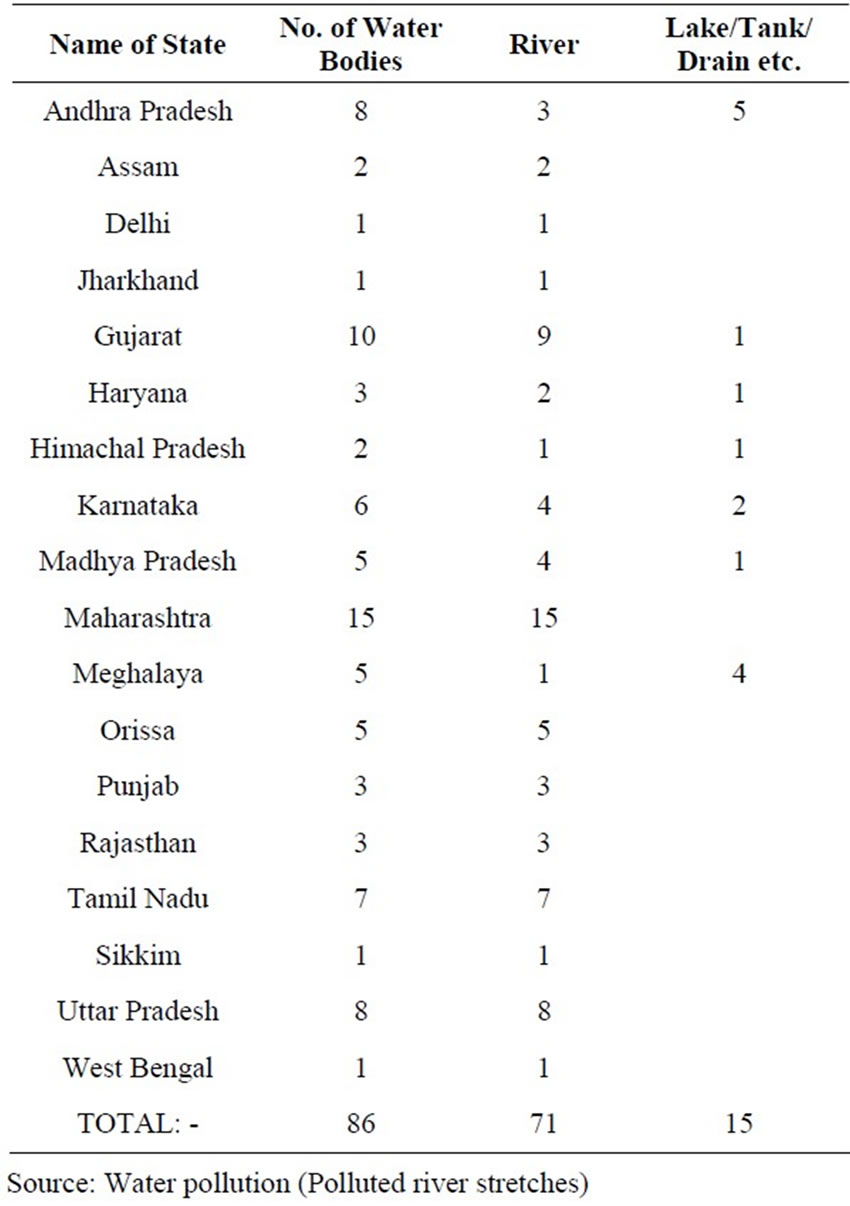
Table 3. State wise polluted stretches in rivers and lakes in India.
14. Bhopal Gas Tragedy
Bhopal’s pesticide plant was built in 1969 to manufacture Sevin, a pesticide used throughout Asia to kill beetles, weevils and worms. The plant was operated by Union Carbide India, Limited, but an American company, Union Carbide Corporation, held more than half the stock. The leak began on December 2, 1984, when water entered a tank that was used to store methyl isocyanate, a toxic gas and a key ingredient in Sevin. The water reacted with the gas, causing extreme pressure and heat that possibly caused the tank to explode. The tank spewed 40 tons of poisonous gas into the air. The toxic cloud was mostly methyl isocyanate, a compound that can irritate the throat and eyes, cause chest pain and shortness of breath, and, in large doses trigger convulsions, lung failure and cardiac arrest. It is also presumed that the reactions inside the tank generated enough heat to turn methyl isocyanate into its even deadlier cousin: hydrogen cyanide. Listed as a chemical weapon by the Chemical Weapons Convention, hydrogen cyanide can stop respiration. Because the deadly mixture was heavier than the air, it stuck close to the ground, choking thousands of people who lived nearby. The areas engulfed by gas were some of Bhopal’s poorest neighborhoods. Many of the gas survivors are still too ill to work and a number of additional health problems continue to crop up such as blindness, respiratory illnesses, reproductive problems and neurological and immune disorders, to name some of them. Due to the rains, the plant’s waste ended up in the groundwater. In 1996, the state pollution control board found traces of pesticides in the local wells. But it wasn’t until 2004 that the federal government ordered the state to provide the community with clean drinking water. After understanding the causes, it becomes necessary to know the consequences of water pollution. All the water pollutants are responsible for decreasing the selfpurifying ability of the water bodies. This means that these lose the capacity to recycle the wastes. Nutrients cause excessive weed growth and algal blooms, which may release the algal toxins like microcystins and other hazardous compounds.
15. Repercussions of Water Pollution
The repercussions of this issue are many. Water clarity is affected and the water bodies become shallower. Algae consume most of the available oxygen, thereby increasing what is termed as the Biological Oxygen Demand (BOD) and decreasing the Dissolved Oxygen (DO) level. Also, the rate of photosynthesis is decreased, killing many aquatic plants. Soil erosion brings a lot of silt into the water bodies, thus decreasing the water quality. The lying of cow dung along the periphery of water bodies enriches them with undesirable chemicals. Water pollution as such leads to water borne diseases like cholera, typhoid, diarrhea, hepatitis, jaundice, dysentery etc. Various unwanted plants and effluents give them a marsh-like look, not to talk of the foul smell emanating from them. Water pollution can even render the water unfit for industrial or agricultural purposes, not alone for drinking. Encroachments formed on the water bodies have lead to drastic shrinking of the total area. An example of this in India is the Anchar Lake that has turned into a marsh. River Jhelum has been turned into a drain due to solid wastes and effluents entering into this water body. Its fish population is diseased. Dal Lake of Kashmie can be nicknamed as ‘a polluted pond’.
16. Conclusions
Pesticides are often considered a quick, easy, and inexpensive solution for controlling weeds and insect pests in urban landscapes. However, pesticide use comes at a significant cost. Pesticides have contaminated almost every part of our environment as pesticide residues are found in soil and air, and in surface and groundwater across the nation, and urban pesticide uses contribute to the problem. Pesticide contamination poses significant risks to the environment and non-target organisms ranging from beneficial soil microorganisms to insects, plants, fish, and birds. Contrary to common misconceptions, even herbicides can cause harm to the environment. In fact, weed killers can be especially problematic because they are used in relatively large volumes. The best way to reduce pesticide contamination (and the harm it causes) in our environment is for all of us to do our part to use safer, non-chemical pest control (including weed control) methods. In order to control water pollution by other elements such as sewage or industrial wastes, the effluents should not be allowed to dump into water reservoirs without proper pretreatment. Further, the constant monitoring and analysis of water by appropriate agencies is essential to avoid any kind of water contamination.
17. Acknowledgements
The authors are thankful to Dr. Abhay Kumar Pandey, Department of Biochemistry, University of Allahabad, Allahabad, India for critical reviewing of the manuscript.
REFERENCES
- P. H. Daniel, “Investing in Tomorrow’s Liquid Gold,” 19 April 2006. http://finance.yahoo.com/columnist/article/ trenddesk/pp3748
- K. R. Munkittrick, M. R. Servos, J. L. Parrott, V. Martin, J. H. Carey, P. A. Flett, G. Potashnik and A. Porath, “Dibromochloropropane (DBCP): A 17-year Reassessment of Testicular Function and Reproductive Performance,” Journal of Occupational Environment Medicine, vol. 37, No. 11, November 2005, pp. 1287-1292.
- P. Cocco, “On the Rumors about the Silent Spring. Review of the Scientific Evidence Linking Occupational and Environmental Pesticide Exposure to Endocrine Disrupting Health Effects,” Cadernos Saúde Pública, vol. 18, No. 2, 2002, pp. 379-402.
- C. Massad, F. Entezami, L. Massade, M. Benahmed, F. Olivennes, R. Barouki and S. Hamamah, “How Can Chemical Compounds Alter Human Fertility?” European Journal Obstetrics Gynecology Reproductive Biology, Vol. 100, No. 2, 2002, pp. 127-137.
- J. L. Cook, P. Baumann, J. A. Jackman and D. Stevenson, “Pesticides Characteristics that Affect Water Quality”. http://insects.tamu.edu/extension/bulletins/water/water_01.html
- E. Straube, S. Straube and W. Straube, “Hormonal Disruption in Humans,” In: D. Pimental, J. L. Cook, P. Baumann, J. A Jackmang and D. Stevenson Ed., Encyclopedia of Pest Managaement, College Station, 2003.
- A. Gupta, D. K. Rai, R. S. Pandey and B. Sharma, “Analysis of some Heavy Metals in Riverine Water, Sediments and Fish from River Ganges at Allahabad,” Environmental Monitoring and Assessment, In Press.
- Clean Water Act, Section 502, General Definitions (14). http://www.epa.gov/wetlands/regs/sec502.html
- S. O. Igbedioh, “Effects of Agricultural Pesticides on Humans, Animals and Higher Plants in Developing Countries,” Archives of Environmental Health, vol. 46, 1991, pp. 218-223.
- J. Jeyaratnam, “Health Problems of Pesticide Usage in the Third World,” British Medical Journal, Vol. 42, 1985, pp. 505-506.
- H. N. Saiyed, V. K. Bhatnagar and R. Kashyap, “Impact of Pesticide Use in India Electronic Journals: Asia Pacific Newsletter: 1999-2003. http://www.ttl.fi/Internet/ English/Infotion/Electronic+journals/Asian-Pacific+Newsletter/1999-03/05.htm
- C. O. Karunakaran, “The Kerala Food Poisoning,” Journal of Indian Medical Associtaion, vol. 31, 1958, pp 204- 207.
- Wadhwani and I. J. Lall, “Indian Council of Agricultural Research,” New Delhi, 1972, pp. 44-49.
- R. Carlson, “Silent Spring,” Houghton-Mifflin Co., Boston, 1962.
- R. A. Liroff, “Balancing Risks of DDT and Malaria in the Global POPs Treaty,” Pesticide Safety News, vol. 4, 2000, pp. 3-7.
- H. L. Bradlow, D. L. Davis, G. Lin, D. Sepkovic and R. Tiwari, “Effects of Pesticides on the Ratio of 16 Alpha/2-Hydroxyestrone: A Biologic Marker of Breast Cancer Risk,” Environmental Health Perspectives, vol. 103, 1995, pp. 147-150.
- M. C. R. Alavanja, J. A. Hoppin and F. Kamel, “Health Effects of Chronic Pesticide Exposure: Cancer and Neurotoxicity,” Annual Review of Public Health, vol. 25, 2004, pp. 155-197.
- M. J. Perry, “Effects of Environmental and Occupational Pesticide Exposure on Human Sperm: A Systematic Review,” Human Reproduction Update, vol. 14, 2008, pp. 233-242.
- “Farm Chemicals Handbook’95,” Meister Publishing Co., Willoughby, 1995.
- R. E. Gosselin, H. C. Hodge, R. P. Smith and M. N. Gleason, “Chemical Toxicity of Chemical Products,” The Wilkins & Wilkins Co., Baltimore, 1976.
- United States Environmental Protection Agency, “Pesticide Industry Sales and Usage, 1990 and 1991 Market Estimates,” United States Environmental Protection Agency Publishing, Washington, D.C., 1992.
- Ontario Ministry of Agriculture and Food, “Grower Pesticide Safety Course,” Toronto, 1991.
- D. Calamari and D. U. Barg, “Hazard Assessment of Agricultural Chemicals by Simple Simulation Models,” Prevention of Water Pollution by Agriculture and Related Activities: Proceedings of the FAO Expert Consultation, Santiago, 20-23 October 1992, pp. 207-222.
- United Nations Environment Programme, “The Aral Sea: Diagnostic Study for the Development of an Action Plan for the Conservation of the Aral Sea,” Nairobi, 1993.
- World Health Organization, “Guidelines for DrinkingWater Quality, Volume 1: Recommendations,” 2nd Edition, Geneva, 1993.
- Y. J. Wang and J. K. Lin, “Estimation of Selected Phenols in Drinking Water with in Situ Acetylation and Study on the DNA Damaging Properties of Polychlorinated Phenols,” Archives of Environmental Contamination and Toxicology, vol. 28, 1995, pp. 537-542.
- S. R. Baker, “The Effects of Pesticides on Human Health,” In: C. F. Wilkinson Ed., Advances in Modern Environmental Toxicology, 1990.
- M. Margni, D. Rossier, P. Crettaz and O. Jolliet, “Life Cycle Impact Assessment of Pesticides on Human Health and Ecosystems,” Agriculture, Ecosystems and Environment, vol. 93, No. 1-3, December 2002, pp. 379-392.
- G. R. Hallberg, “Pesticide Pollution of Groundwater in the Humid United States,” Agrigulture, Ecosystem and Environment, vol. 26, No. 3-4, October 1989, pp. 299- 367.
- McConnell, et al., “Health Hazard Evaluation Report in Pesticides in the Diets of Infants and Children,” Pesticides in the Diets of Infants and Children, National Academy Press, Washington, D.C., 1993.
- Oranskey, et al., Seizures Temporally Associated with the Use of DEET Insect Repellent—New York and Connecticut,” Pesticides in the Diets of Infants and Children, National Academy Press, Washington, D.C., 1993.
- Z. S. Hoar, A. Blair, et al., “Agricultural Herbicide Use and Risk of Lymphoma and Soft Tissue Sarcoma,” Journal of the American Medical Association, vol. 256, 1886, pp. 1141-1147.
- “Science Daily,” 12 March 2009. http://www.science daily.com/releases/2009/03/090306084639.htm
- P. B. Singh and V. Singh, “Pesticide Bioaccumulation and Plasma Sex Steroids in Fishes during Breeding Phase from North India,” Environmental Toxicology and Pharmacology, Vol. 25, No. 3, May 2008, pp. 342-350.
- B. Goldar and N. Banerjee, “Impact of Informal Regulation of Pollution on Water Quality in Rivers in India,” Journal of Environmental Management, Vol. 73, No. 2, November 2004, pp. 117-130.