Journal of Water Resource and Protection
Vol. 1 No. 5 (2009) , Article ID: 866 , 11 pages DOI:10.4236/jwarp.2009.15042
ArcGIS-Based Rural Drinking Water Quality Health Risk Assessment
1College of Hydraulic & Hydroelectric Engineering, Sichuan University, Chengdu, China
2College of Information & Engineering, Sichuan Agricultural University, Ya’an, China
3College of Hydrology & Water Resources, Hohai University, Nanjing, China
E-mail: nfq1965@163.com
Received August 14, 2009; revised September 8, 2009; accepted September 14, 2009
Keywords: Water Sources, Water Environment, Water Quality, Health Risk Assessment, Arcgis, Geo-Statistical Analysis, Ya’an City
ABSTRACT
Aiming at the unsafe of water quality which is the core problem in rural drinking water safety, the study collected 221 water samples of rural drinking water sources in Ya'an and detected the concentrations of the carcinogen and the non-carcinogen. Based on the analysis of water environment characteristics and the identification of water environment health risk source of Sichuan Ya’an City, which includes seven counties and a district and is the typical region of the western margin of Sichuan Basin, this study calculated and analyzed the carcinogenic risk (R) and non-carcinogenic risk (hazard index, HI) by applying the health risk model recommended by the US National Research Council of National Academy of Science. Then, taking advantage of the geo-statistic spatial analysis function of ArcGIS, this study analyzed the assessment result data (R and HI), selected the proper interpolation approach and educed R and HI spatial distribution maps of the study area. R and HI of the single factor and integrate factors were evaluated and thus obtained the following conclusions: For one thing, the cancerous risk indexes of the vast majority of water sources (about 94%) is the level of 10-7 and it belong to the safety extension. The main carcinogen in the water sources are As, Cr6+ and Pb, their concentrations are in the ranges of 0.004-0.01, 0.005, 0.01mg/l respectively and such water source mainly distributed in Yucheng district and Mingshan county. For another, the non-cancerous hazard indexes of the vast majority of water sources (about 98%) is also less than the limit value 1 and will not harm the local residents. The health risk of non-carcinogen comes mainly from As and fluoride, their concentrations are in the ranges of 0.004-0.01 and 0.1-4.2mg/l respectively. The results of the integrate factors health risk assessment showed that the total cancerous risk were still at the level of 10-6, only 12 drinking water source investigation sites (5%) exceeded the drinking water management standard value of EPA (the limit value is 10-6); the total non-cancerous hazard indexes are still in the range of 10-2-10-1, and will not harm the local residents either, only 18 drinking water source investigation sites (8%) exceeded the drinking water management standard value of EPA(the limit value is 1).The densely populated areas such as Yucheng District, Tianquan County, Yingjing County and Shimian County are where the four contaminating materials, i.e., As, Cr6+, Pb and fluoride should be monitored with emphasis. Study results disclosed the health risk control indexes of source water quality of the studied area and thus provided the scientific basis for the water quality control of water sources. This study had worked efficiently in practice. Compared with the same kind of methods which had been found, the paper had the outstanding results for the health risk assessment of the rural drinking water safety.
1. Introduction
Nowadays, 90% of the cancer sufferers are caused by chemical carcinogens [1] and 80% of the diseases are at tribute to the unsafe of drinking water in poverty-stricken areas. Nearly 25,000 people died of such water pollution problems everyday [2], and 1/3 of urban inhabitants in developing countries can not get safe drinking water [3]. In China, over 70% rivers and lakes are suffering pollution in various degrees. Due to the high fluoride water, the high arsenic water, the brackish water, the water polluted by organic compounds, schistosome, etc, 36 million people could not get safe water. Among them, the toxic substances content of the drinking water of 19 million residents exceed standard [2].
The pollutants in the water can be classified into contaminants of biological origin, physical origin and chemical origin according to their properties [4]. The threat of drinking water quality safety comes mainly from chemical pollution [5]. The chemical pollutants can be divided into carcinogenic pollutants and non-carcinogenic pollutants according to their different perniciousness to human. U. S. EPA (United States Environmental Protection Agency), IARC (The International Agency for Research on Cancer) and USDOE(U. S. Department of Energy) provide a great many data about the perniciousness of chemical pollutants to human health [6−8].
It is essential to carry out total health risk assessment in the safety management of drinking water quality. Through the health risk degree assessment of drinking water source, the comprehensive conclusion of water source quality which is represented by the risk degree of health hazard can be got directly. So, the primary and secondary of the pollutants in waters and priority setting of governance can be determined [9]. Currently these studies are necessary and helpful to understand the problems of drinking water risk and their status, and then the priority in next step can be appropriately set. Clean drinking water is fundamental to the health and welfare of the world people. It is very important to prevent water any quality deterioration. Prevention of water pollution is more important and practical than the remediation of contaminated water. Water quality protection should start from the source, at catchments or watershed scale.
Diseases are closely related to the following factors, such as climate, environment, water quality and management, education, air pollution, natural disease, society and so on. It is extremely essential for the understanding and further study of human health and the spatial distribution of its influencing factors, and it is so helpful for health decision-making departments to adopt corresponding preplan and countermeasures that social stability can be ensured. Therefore, the application research of Geographic Information System (GIS) in health risk assessment has got more and more attention and application, especially from overseas [10−17]. Meanwhile, the majority of domestic researches are focused on the study of health risk analysis for urban water sources, rural water sources, sewage recharge, groundwater and so on. Most of these researches are uncomplicated application of the formula of health risk recommended by U.S.EPA, and the effect of uncertainly factors or the further research based on GIS are considered rarely [18−21].
This study took the seven counties and one district of Ya’an City as an example. Based on the analysis of testing result of 221 rural water sources and through the selection, source identification, pollution load monitoring of the pollutants which affect water source quality mostly and the epidemiological survey, the health risk assessment model recommended by U.S. National Research Council of National Academy of Science was applied to calculate and study the carcinogenic risk and non-carcinogenic risk of the items exceeding the standard value in the source water, such as fluoride, nitrate, Fe, Mn, As, Cr6+, Pb, Cd, Hg, etc. By applying ArcGIS of ESRI(Environmental Systems Research Institute, any GIS that allows vector and raster processing would work) and this study also did the spatial interpolation analysis in accordance with the various calculated carcinogenic risk(R)and noncarcinogenic risk (hazard index, HI) of each water quality monitoring sites and formed a series of thematic maps about R and HI. The above mentioned research results provided reliable guarantee for the water quality risk prediction and assessment in Ya'an.
2. Material and Methods
2.1. Overview of the Study Area
Ya'an City locates in the western part of Sichuan Province and belongs to mountainous region of western margin in Sichuan Basin. It is transitional area between Sichuan Basin and Qinghai-Tibetan Plateau and has seven counties and one district. With the development of industry and agriculture and the effect of mankind’s activity, the water pollution of Qingyi Valley in Ya’an City was getting worse day by day. There were two types of water pollution in rural area of Ya’an: the first type was the schistosome-affected areas of Lushan County and Tianquan County where the water source is polluted by oncomelania; the other one was the river pollution caused by the aggravation of mankind’s activities, by the forest devastation and by the fertilizer and pesticide abuse in agricultural production, which affected human life and drinking water production. According to the investigation and statistics, 580,200 residents didn’t get safe drinking water, accounting for 46.77% of agricultural population. Among them, about 321,600 residents drink the water that didn’t reach quality standard, 23,800 residents lived with water exceeded the standard fluoride content, 15,700 residents suffered from brackish water, 31,100 residents lived with IV or super IV untreated surface water, 171,400 residents took untreated surface water that the bacteriological index seriously exceeded the standard, 10,400 residents suffered from the untreated underground water with heavy pollution and 69,600 residents who took the water with other quality index exceeded the standard (mainly includes Glauber’s salt, FeMn and mineral), 551,000 residents suffered from water shortage, and 142,800 residents suffered from the inconvenience of water supply, and the water source guaranteed rate that didn’t reach the standard affecting 61,000 residents [22].
2.2. Models, Parameters and Criteria
The health risk assessment process recommended by U.S.EPA mainly includes: Data collecting and evaluating; Exposure assessment; Toxicity assessment; Risk characterization [23]. Health risk management of water environment is a neonatal management philosophy that further developed from water environment management. It is the concretized management which focuses on the actual situation of regional water environment and carries out risk management to ensure the health and safety of regional water environment on the basis of regional water environmental risk analysis and assessment [24−30]. In this study, models and parameters were used as following:
2.2.1. Carcinogenic Risk Assessment
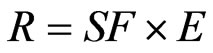
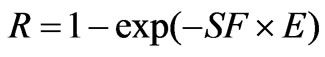
It is generally agreed that the exposure dose rate has a linear relationship with human carcinogenic risk when people are under exposure condition of low chemical carcinogen dose. When high dose leads to high carcinogenic risk, there is an exponential relationship between the exposed dose rate and human carcinogenic risk, which can be calculated with the following formula:
 ,
,  (1)
(1)  ,
, 
where, R is the carcinogenic risk representing the excessive cancer probability in people’s lifetime; SF is the chemical carcinogenic slope coefficient ((mg·kg-1 ·d-1)-1) representing the lifelong excessive cancer risk of people when they always exposed to chemical carcinogen at the dose of 1mg per kg everyday; E is the exposure dose rate (mg·kg·d-1) representing the daily intake of assessed pollutant per kg.
E can be calculated with the following formula:
 (2)
(2)
where, C is the consistency of the chemical pollutants in source water (mg·L-1 ); IR is drinking rate (L·d-1, the suggested value of U.S.EPA is 2L·d-1) representing daily amount of drinking water people take; EF is the exposure frequency (d·a-1) representing the days of assessed pollutants intake per year in evaluation period; ED is the exposure duration (a, the value recommend by U.S.EPA
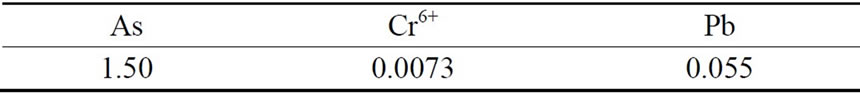
Table 1. SF values [mg/(kg·d)]-1.
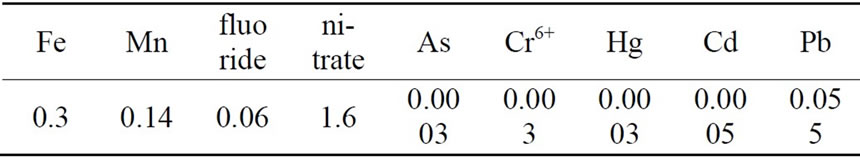
Table 2. RfD values [mg/(kg·d)].
is 30a) representing the years of lifelong assessed pollutants intake; BW is the average weight (kg, the optimum weight in China is 60kg); AT is the average time (d, average carcinogenic time and non-carcinogenic time are 70a ×365d·a-1, ED×365d·a-1 respectively).
2.2.2. Non-Carcinogenic Risk Assessment
The non-carcinogenic chronic toxic property of chemical pollutants to human body takes the reference dose as yardstick: people whose exposure level is higher than the reference dose are probable risk takers; and those whose exposure level is equal or lower than the reference dose are less probable risk takers.
HI is commonly used to represent the non-carcinogenic chronic toxic property:
 (3)
(3)
where, RfD is the reference dose (mg·kg-1·d-1 ).
2.2.3. Health Risk Assessment Parameters
The carcinogenic slope coefficients of the three kinds of pollutants which have carcinogenic effect on human body through drinking water are showed in Table 1. The reference dose (RfD) of the nine kinds of pollutants are showed in Table 2 [29].
2.2.4. Total Health Risk
For the total health risk caused by all kinds of toxic substance in the drinking water, given that the toxic effects of various kinds of poisonous substance to human body are having an additive relationship rather than cooperative or antagonistic relationship, the total health risk of drinking water RT can be calculated by the following formula:
RT =HI+R(4)
The Formula (4) mentioned above is the total health risk assessment model of the pollutants in drinking water.
2.2.5. Risk Assessment Criteria
Non-carcinogenic risk evaluation criteria: according to the definition of hazard index, “1” was determined as risk control criteria of non-carcinogenic, chronic and poisoning effects to evaluate.
Carcinogenic risk evaluation criteria: risk management practices of foreign countries over the years had shown that carcinogenic risks of chemical contaminants, accor-
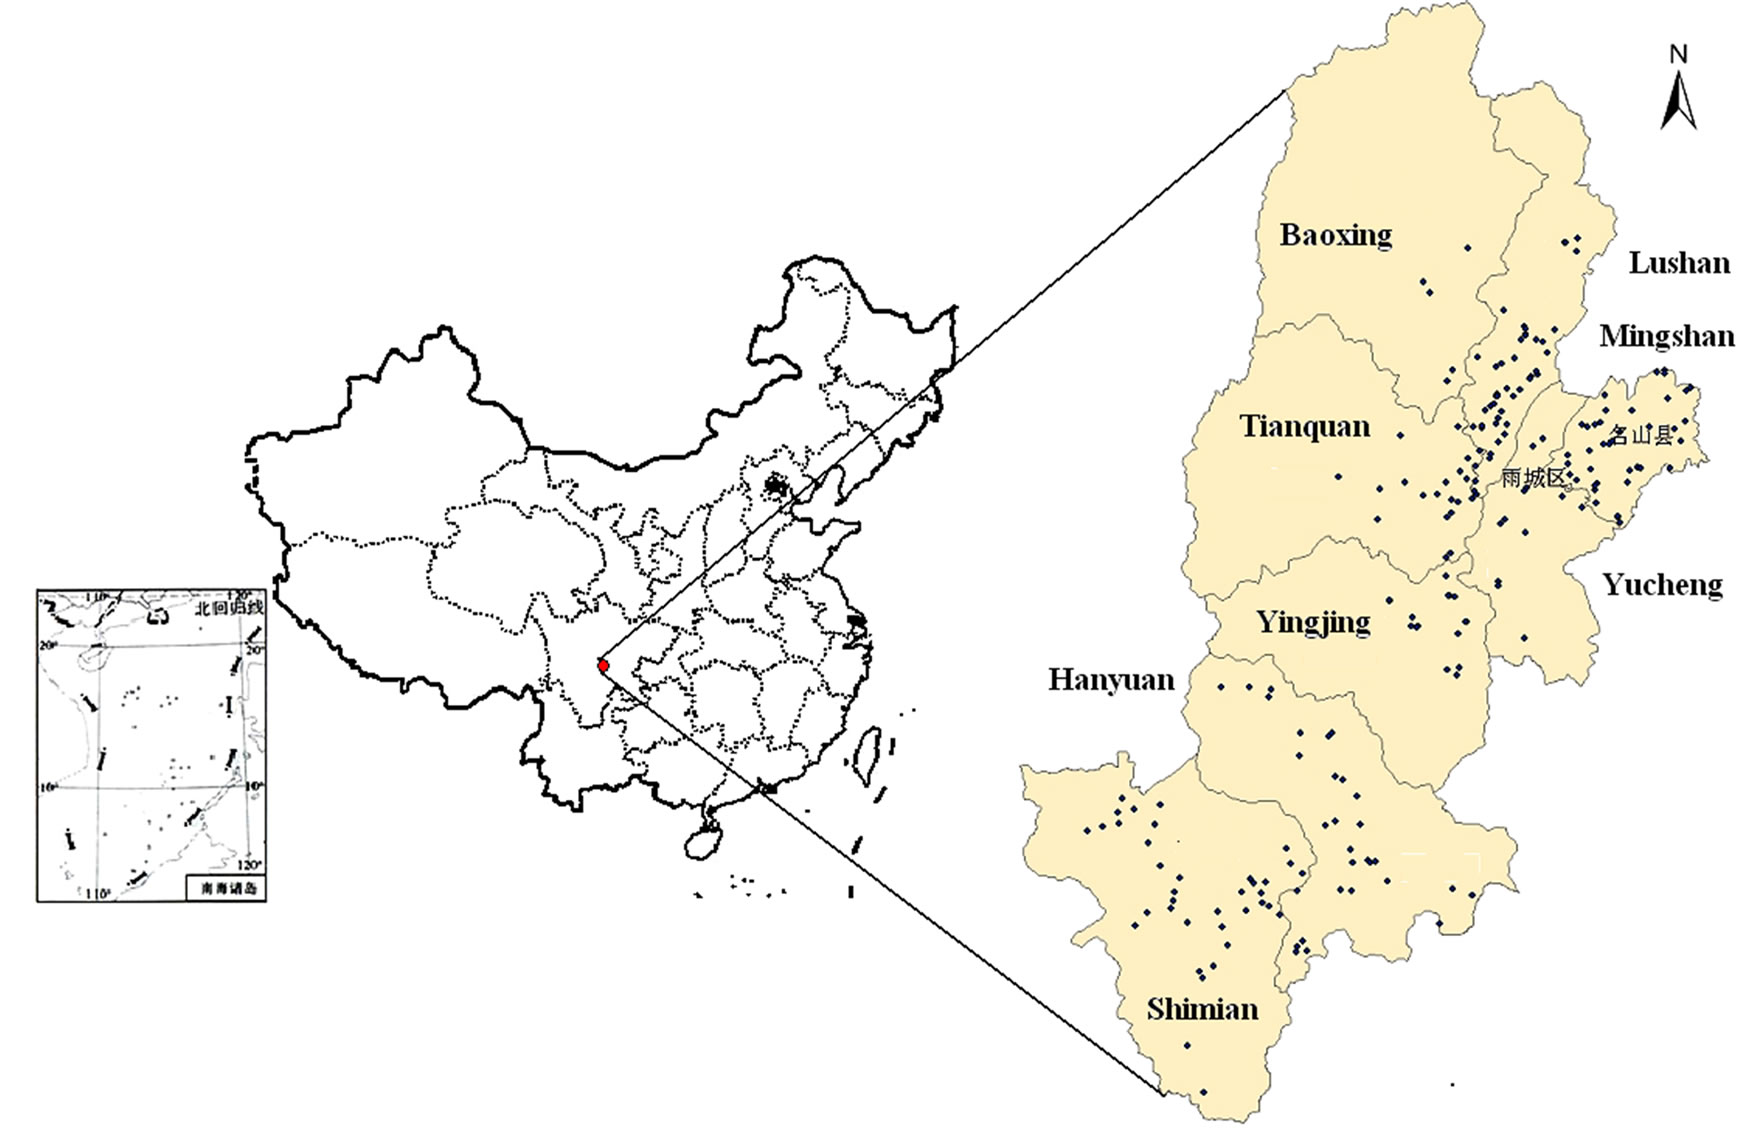
Figure 1. The sampling sites and the location of Ya’an city.
ding to the full extent of the evidence of its carcinogenicity, per million (1.00×10⁻⁶) to ten thousandth (1.00×10⁻⁴) are all acceptable. This study used the most stringent acceptable risk degree per million (1.00×10⁻⁶) as the evaluation criteria to evaluate.
2.3. Samples Investigation
According to U. S. EPA, the methods of health risk assessment process included as follows: collecting and analyzing relevant data, recognizing potential harmful chemicals; analyzing releasing mode of pollutants, identifying exposed population and exposure pathway, assessing exposure concentration and intake concentration by different ways; collecting qualitative and quantitative toxicity data, determining toxicity data; characterization of potential adverse effect to health, carcinogenic risk assessment, non-carcinogenic risk assessment and so on.
In 2005, on basis of investigation about fundamental state and making fully use of recent two years’ rural water quality census data by health department, sampling inspection of water system was divided into two parts according to topography, geomorphology, geology, hydrology, water systems and drinking water sources, distribution of water-borne diseases and water supply project type. Health department acted in concert with water resources units to collect samples of source water and peripheral water of central water supply project, well water, reservoir water and pond water and to carry out laboratory test and detection on water quality in related townships. And then, the distribution areas where the water quality was below the standard and the numbers of people living in those areas were obtained according to the different qualities of water. 221 water samples were collected (see in Figure 1) and 21 indexes were under detection, including physical water quality index (color, turbidity degree, offensive odor, visible materials by bare eye), hydrochemical index(PH, COD, total hardness, total dissolved solid, chloride, sulfate), toxicology index (Fe, Mn, Fluoride, As, Hg, Cd, Cr, Pb, Nitrate) and bacteriology index (faecal coliforms, total coliforms), etc. Depending on whether the water quality indexes of the detected water were harmful to human body or not, 9 chemical toxicology indexes of health risk assessment, i.e., Fe, Mn, Fluoride, As, Hg, Cd, Cr, Pb and Nitrate, were then selected and assured.
2.4. Arc-GIS Tools
Spatial analysis capability makes GIS different from other mapping system. GIS has been widely used in water and environment applications and many efforts have been made for applying GIS to resource and environment management [31−34]. Health risk assessment for water quality of the rural water sources involves multi-sphere factors, hydrosphere, atmosphere, geo-
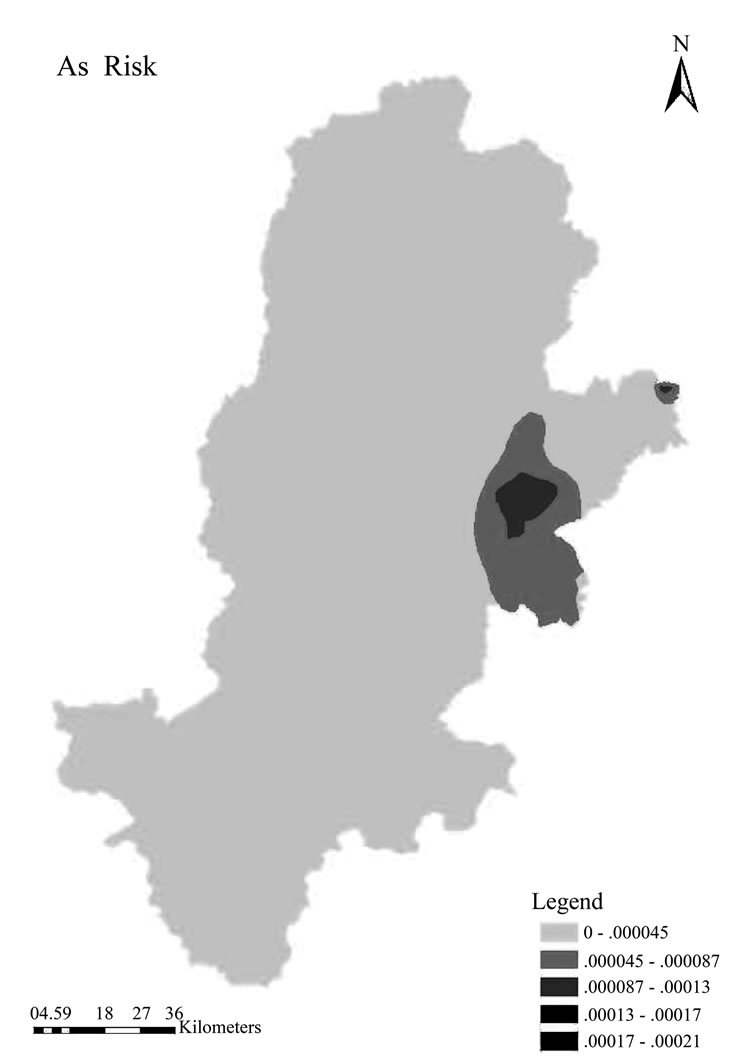
Figure 2. As risk thematic map.
sphere and biosphere, which are ideal spatial activities being handled by GIS [35−37]. The spatial data management, analysis and visualization of GIS have greatly facilitated health risk assessment studies. GIS as a general spatial modelling, is the best option for health risk assessment for water quality of rural water sources approach which can potentially allow users to inter actively carry out assessment manipulations and to facilitate easier decision making for risk control. This study adopted ESRI’s ArcGIS platform, one of the most powerful GIS software.
2.5. GIS Spatial Database
Before the interior data analysis, relevant maps, data, text material of the studied area were collected at first. Then, digitize the relevant maps by using ArcGIS and set up a unified coordinate system (Beijing geodetic coordinate system 1984) to integrate these data through editing and registration. After that, the structure of thematic layer and the data of the storage area of GIS system were applied to establish the basal spatial database of the studied area, meanwhile the pertinent attribute data were stored and necessary notes were added, such as mountains, rivers, villages and so on. When detecting the water quality in the fields, it is necessary to note down the geodetic coordinates (by using the Global Positioning System, GPS), so that the sampling point layers will automatically generate by means of ArcGIS and according to the coordinate of monitoring points, and at the same time to match the unified coordinate.
2.6. Geo-Statistical Analysis and Model Fitting
The core of geo-statistical Analysis is to select the appropriate spatial interpolation method to create the surface through the analysis of the sample data and the awareness of the geographical features of sampling area. Interpolation method can be divided into two kinds according to the mathematical principle implementing it, one is the deterministic interpolation method and the other is the geo-statistical interpolation which is also called the Kriging interpolation. The Kriging method is the core content of geo-statistic that based on the spatial autocorrelation. It carries out the unbiased estimation on the unknown sampling points of the regionalization variables, applying the original data and the structural properties of the semi-variance function. Based on the spatial statistics analysis and the theoretical model of the semi-variation function, this study carried out the universal Kriging interpolation in risk value of the water quality of rural water sources in studied areas.
3. Results
3.1. Single Factor Assessment of the Carcinogenic Risk
According to the assessment models of carcinogenic risk (Formula (1) and (2)), the data about water quality of Ya’an were analyzed in ArcGIS, and then the thematic maps of single factor risk values of various types of carcinogen were made (shown in Figure 2, 3, 4). The result indicated that the distribution of arsenic, chromium (6+), lead were mainly in Yucheng District. In addition, there were also small quantity of arsenic and lead distributes in Liaochang village in Ming Shan County. Obtained results tallied with the practical situation that there was a higher density of population and there were more chemical plants and more chemical pollutant discharged in Yucheng District.
3.2. Single Factor Assessment of the Non-Carcinogenic Risk
Due to the observation precision of the detection equipments, none of the targeted value in original database that are below the detection precision can be detected, and this lead to the problem of mutilated data. Such defect is just made up, owing to one important function of Geo-statistical Analysis based on ESRI’s ArcGIS which may implement the interpolation in the non-sample spatial areas.
In this study, 9 kinds of pollutants (including three carcinogenic pollutants) in Ya’an City were analyzed respectively by using kriging spatial interpolation meth-
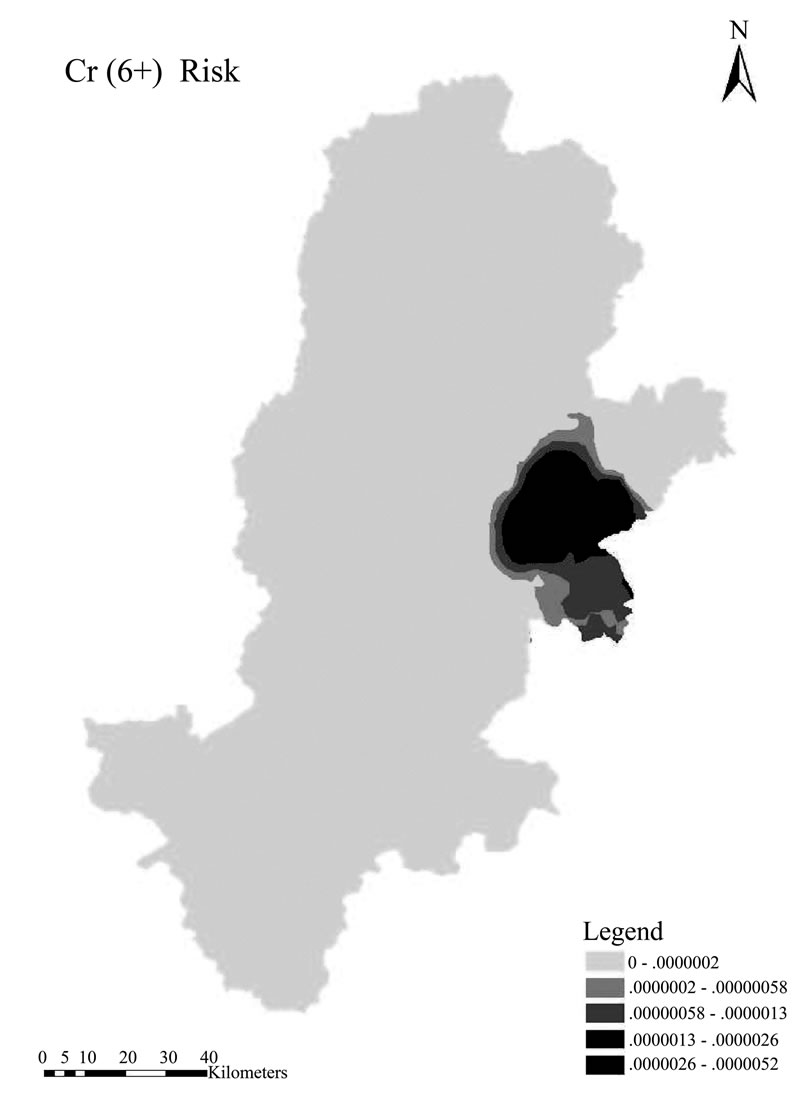
Figure 3. Cr (6+) risk thematic map.
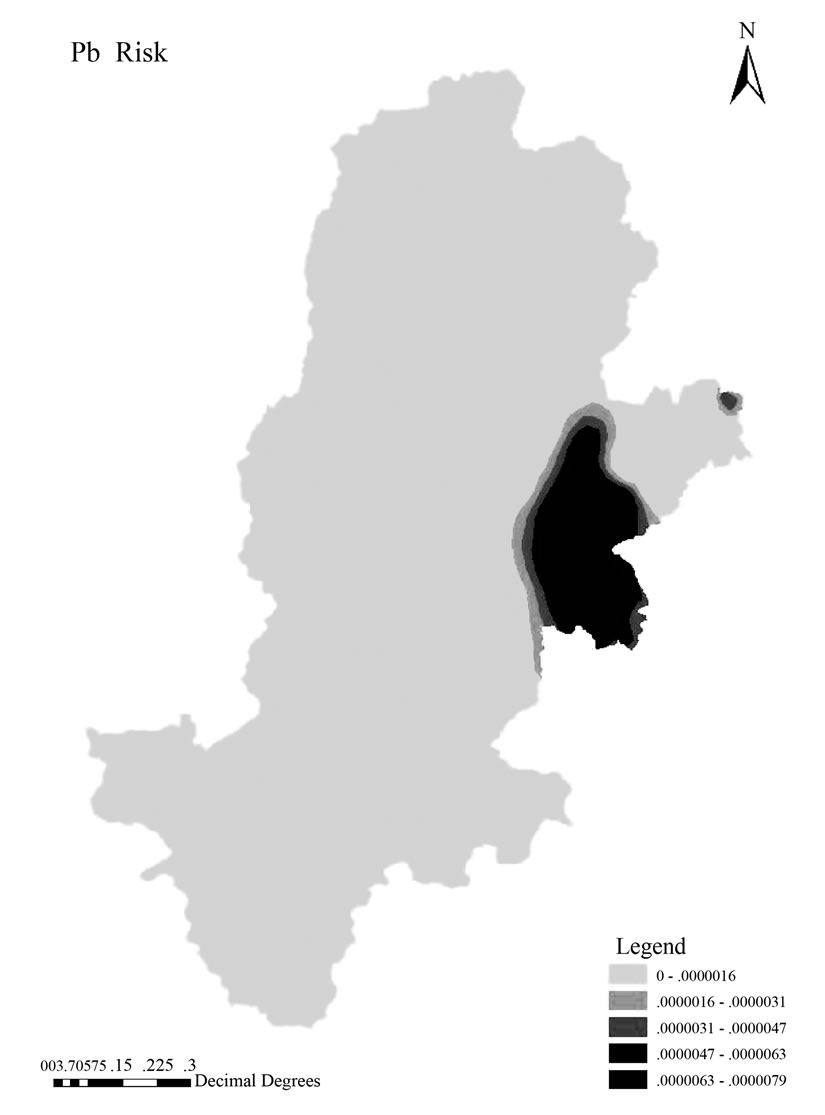
Figure 4. Pb risk thematic map.
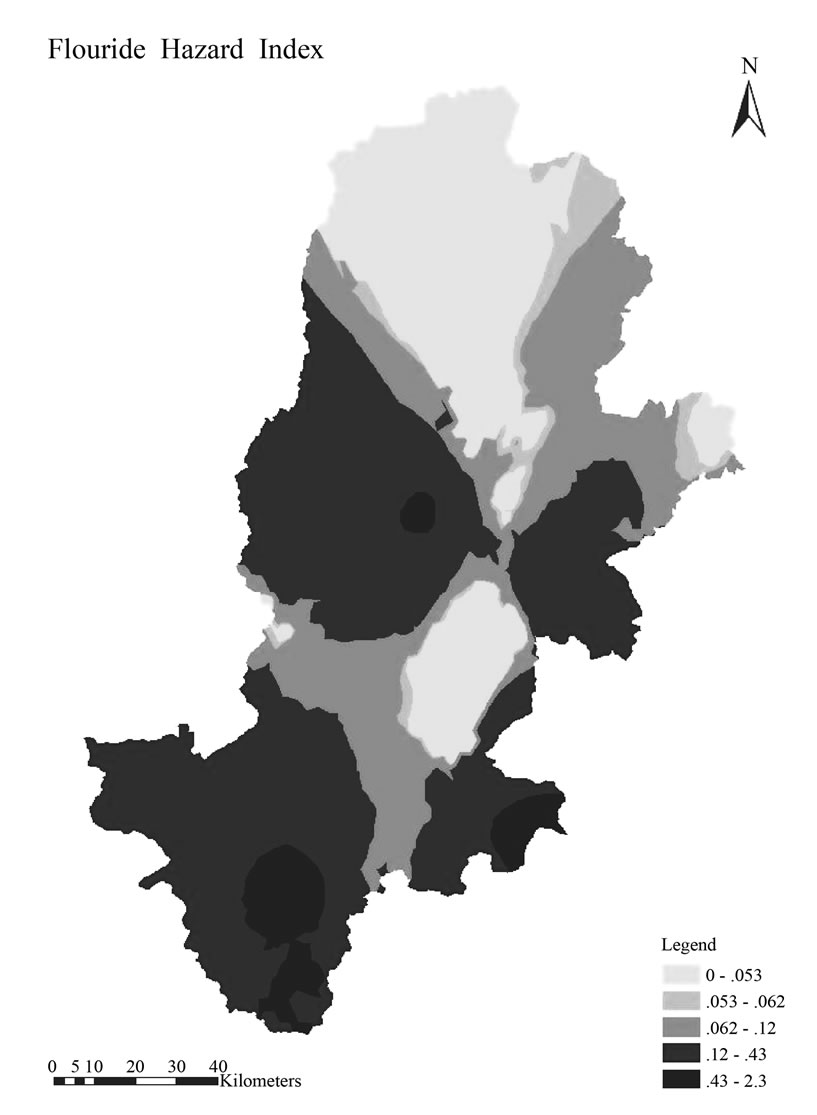
Figure 5. Flouride hazard index.
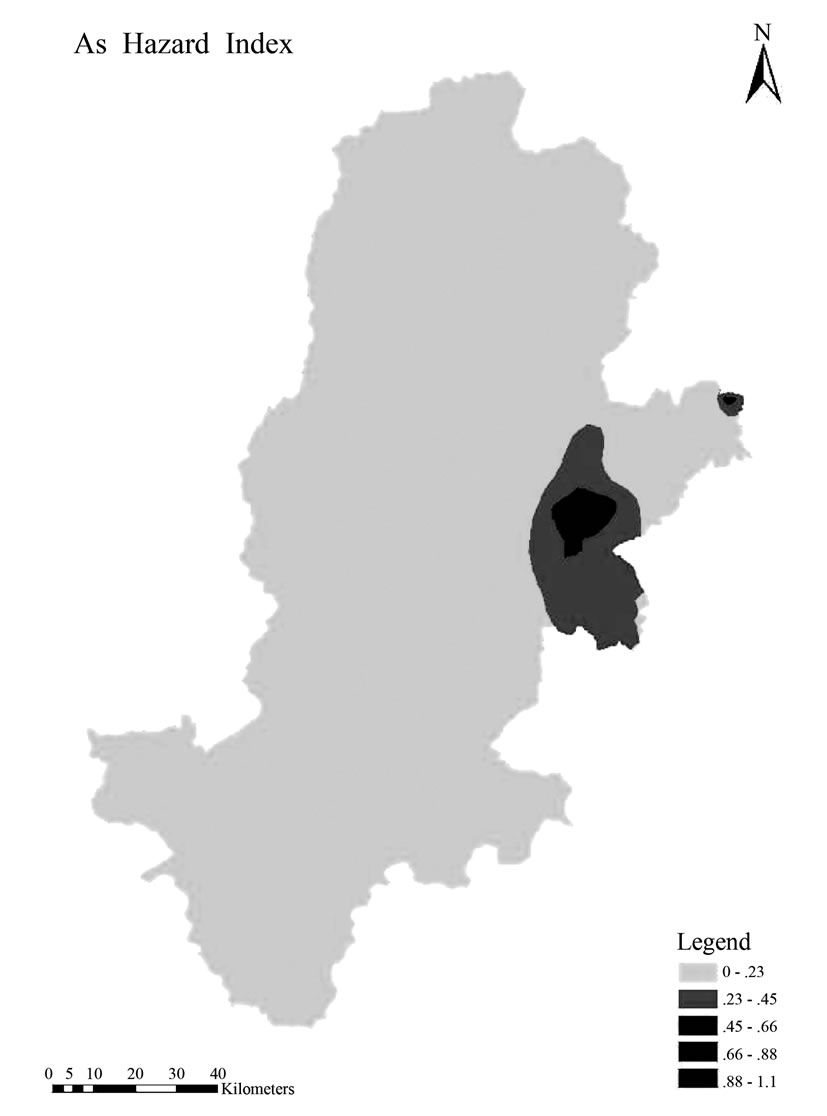
Figure 6. As hazard index.
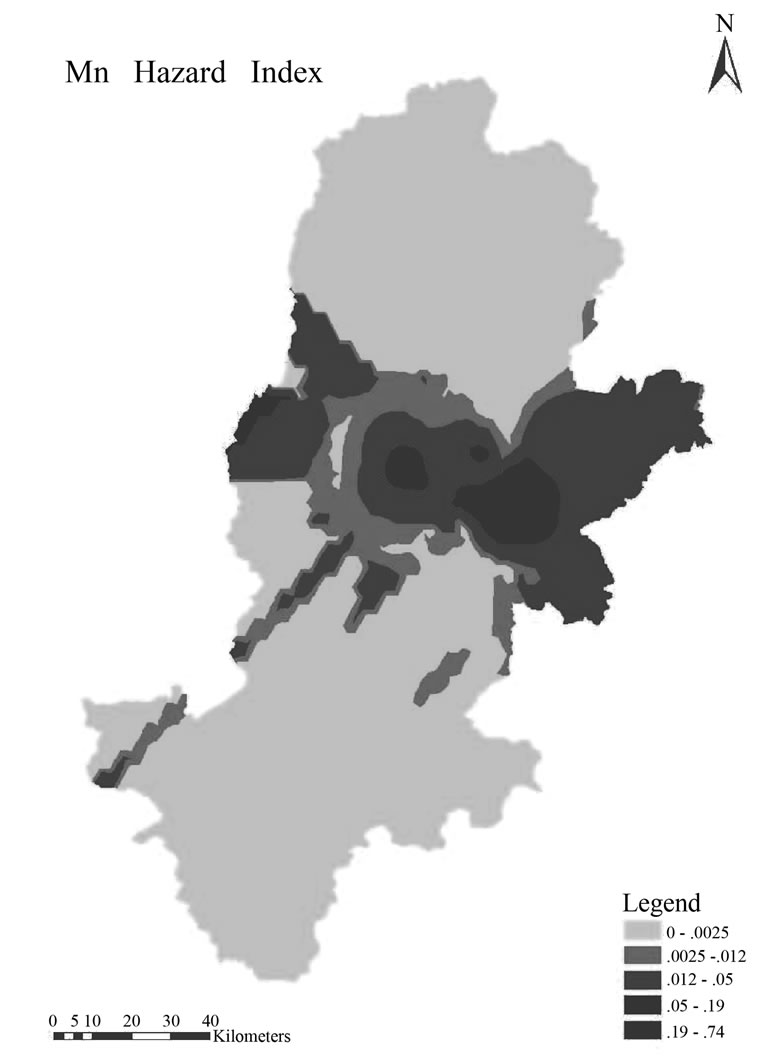
Figure 7. Mn hazard index.
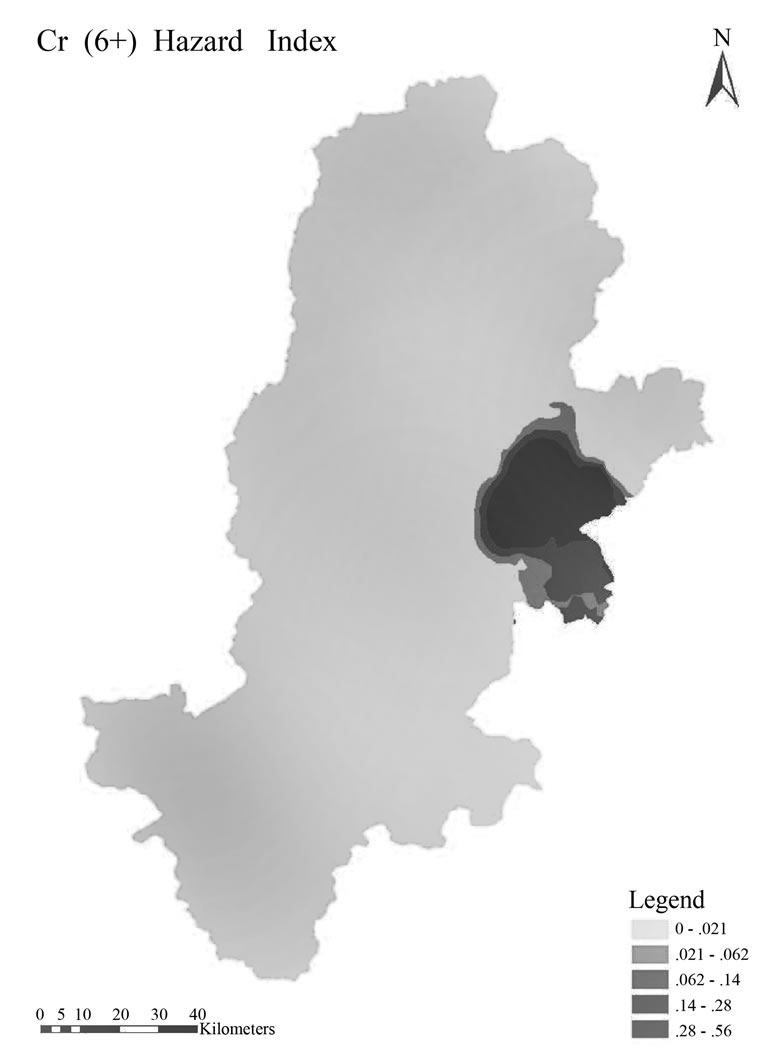
Figure 8. Cr (6+) hazard index.
od. And the thematic maps were formed, they were distribution maps of hazard index of Iron, manganese, fluoride, mercury, nitrate, arsenic, cadmium, chromium (6+), lead respectively. Obtained result indicated that: Fe mainly distributes in Mingshan County, while some areas of Tianquan County and Yingjing County also had a small quantity of distribution, and the distribution gradually decreased from north-east to south-west. Observing from the topographic map, series of vertical mountains could be seen on the contiguous areas of Mingshang County and Yucheng District, thus this coincided with the lay of the land and the stream direction. While, manganese distributed mainly in Yucheng District and some areas of Tianquan County, Mingshan County and Baoxing County. In a similar way, it could be found that the spatial analysis maps of the risk value of several other kinds of pollutants were also reasonable. The maximum of HI values of fluoride, arsenic, manganese, chromium (6+) greater than 0.5, hence their HI thematic maps were also shown in Figure 5, 6, 7, 8 respectively.
3.3. Total Risk Assessment of Water Quality of the Integrate Factors
Summed up the carcinogenic risk (R) and the non-carcinogenic risk (HI) of single factor of each water source respectively, the total risk of integrate factors of carcinogen and non-carcinogen of these water sources obtained respectively (shown in Figure 9 and 10). Then, summed up the total risk of integrate factors of carcinogen and non-carcinogen, and the total risk thematic map got (shown in Figure 11).
4. Analysis and Discussions
4.1. Single Factor Assessment of the Carcinogenic Risk
From Figure 2, 3 and 4, most of the cancerous risk indexes of the vast majority of water sources (about 94%) were the level of 10-7 and it belong to the safety extension. The main carcinogen in water sources were As, Cr6+ and Pb, their concentrations are in the ranges of 0.004-0.01, 0.05, 0.01mg/l respectively and such water source mainly distributed in Yucheng District and Mingshan County. According to Guidelines for Drinking Water Quality of WHO (Third Edition, 2008), the limit values of As, Cr6+ and Pb are 0.01, 0.05 and 0.01mg/l respectively, the measured values of As and Pb of 12 water sources in Yucheng District exceeded the limits, the measured value of Cr6+ of 7 water sources in Yucheng District exceeded the limit, the measured value of As of 1 water sources in Mingshan County exceeded the limit. About 149458 residents are exposed to concentration of As, Cr6+ and Pb exceeding 0.01, 0.05 and 0.01mg/l.
The cancerous risk indexes of As, Cr and Pb were in the range of 10-6-10-4, 10-7-10-6, 10-6 respectively and the indexes of some rural drinking water sources had ex
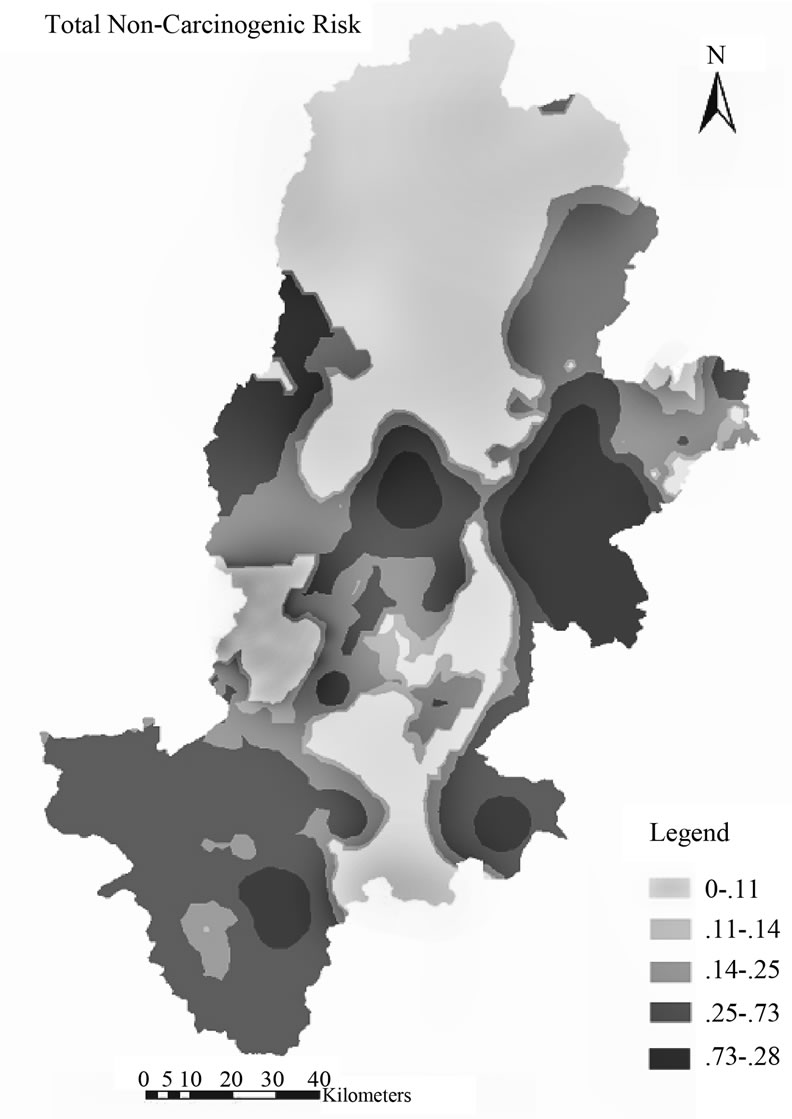
Figure 9. Total non-carcinogenic risk.
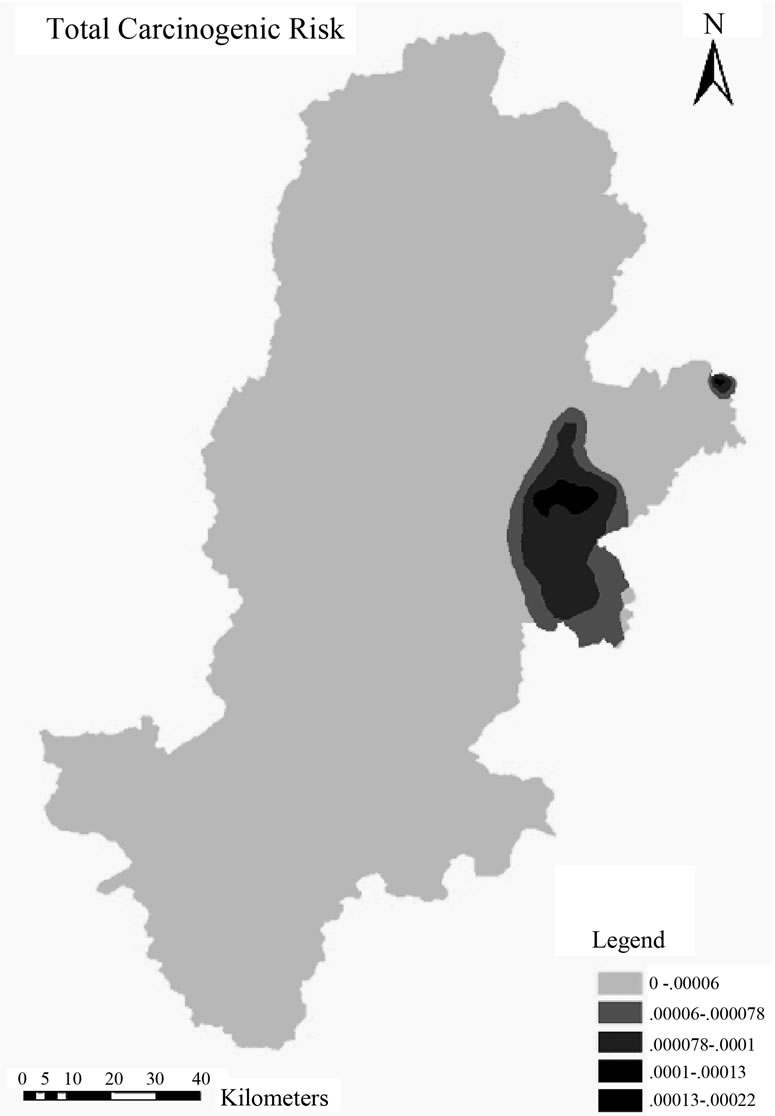
Figure 10. Total carcinogenic risk.
ceeded the drinking water management standard value of EPA. Among 12 water sources in Yucheng District, there was 7 that Cr6+ exceeded up to 1.6-5.2 times, 1 that As exceeded up to 107 times, 11 that As exceeded up to 86 times, 12 that Pb exceeded up to 7.9 times. Among 41 water sources in Mingshan County, there was 1 that As exceeded up to 214 times.
4.2. Single Factor Assessment of the Non-Carcinogenic Risk
From Figure 5, 6, 7 and 8, most of the non-cancerous hazard indexes of the vast majority of water sources (about 98%) were also less than the limit value 1 and will not harm the local people. The health risk of non-carcinogen comes mainly from fluoride and As, their concentrations were in the ranges of 0.1-4.2 and 0.004-0.01mg/l respectively. According to Guidelines for Drinking Water Quality of World Health Organization (Third Edition, 2008), the limit values of As and fluoride are 0.01 and 1.5mg/l respectively, the measured values of As of 1 water source in Mingshan county exceeded the limit, the measured values of fluoride of 1 water source in Shimian County, 1 water source in Hanyuan County and 2 water source in Tianquan County exceeded the limit. About 17460 residents were exposed to concentration of As and fluoride exceeding 0.01 and 1.5mg/l.
The non-cancerous hazard indexes of fluoride and As were in the range of 0.053-2.3 and 0.23-1.1 respectively
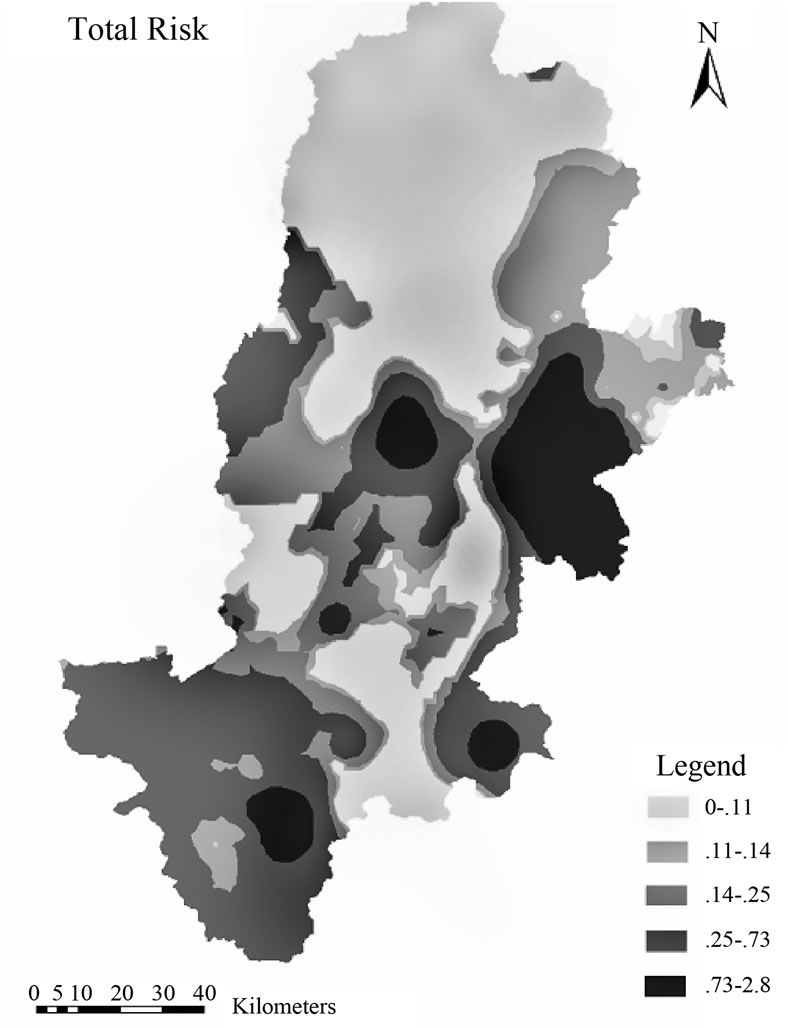
Figure 11. Total risk.
exceeded the drinking water management standard value of EPA. There was 1 water source in Mingshan County that As exceeded up to 1.11 times; There was 2,1 and 2 water sources in Shimian County, Hanyuan County and Tianquan County that fluoride exceeded up to 1.69-2.33, 1.17 and 1.22-1.33 times respectively.
4.3. Total Risk Assessment of Water Quality of the Integrate Factors
According to Figure 9, the total risk of non-carcinogenic are mainly distributed in several water sources in Yucheng District, Tianquan County, Hanyuan County and Shimian County, so we could basically confirm that drinking water supply of most water sources in Ya’an City didn’t have non-carcinogenic, chronic and poisoning effects on drinking crowd. According to Figure 10, the total risk of carcinogenic mainly distributed in several water sources in Yucheng District and Mingshan County. Total risk was shown in Figure 11.
From the above Figures, the analysis results in Figure 9 and Figure 11 were comparatively similar to each other, this indicated that the total risk come mainly from the non-carcinogenic hazard, and the risk distribution areas mainly included Yucheng District, Lushan County, Shimian County, Yingjing County, etc.
The results of the integrate factors health risk assessment showed that the total cancerous risk indexes were still at the level of 10-6, only 12 drinking water source investigation sites (5%) exceeded the drinking water management standard value of EPA (the limit value is 10-6); the total non-cancerous risk indexes are still in the range of 10-2-10-1, and will not harm the local residents either, only 18 drinking water source investigation sites (8%) exceeded the drinking water management standard value of EPA (the limit value is 1).
Thus, chemical carcinogens and non-carcinogens were primary and should be removed accordingly. The effective way of decreasing the health risk and hazard was to control and dispose the rural drinking water containing As, Cr (VI), Pb and fluoride (F). The results provided important information of water quality control and the early warning for rural drinking water.
5. Conclusions
Results of this study provided more deeply and broadly scientific information to the management and protection of rural water source in Ya’an City. This study expounded the water environmental risk level of rural drinking water in the research area, and the primary and secondary of pollutants and the priority of treatment of the pollutants. By doing these may provide the scientific basis for the risk management of drinking water quality in research area, and also provided the new mode and technical platform for water quality protection in rural water sources.
Based on ESRI’s ArcGIS, we did the store, the calculation, the analysis, the simulation and the display with the data of water quality of water sources. Then, thematic maps of spatial distribution of water quality risk had been drawn duly, and meanwhile the real-time monitoring, assessment and dynamic management of healthy risk of water quality of water sources were implemented. The using of ArcGIS in health risk evaluation on water quality of rural water sources has the following outstanding features such as rapidity, high accuracy, ability of dynamic monitoring, visualization and so on. A series of works done through the ArcGIS platform, such as the information input, the management, the inquiry, the analysis and the output, had provided important ways for dynamic assessment of regional water quality risk. ArcGIS integrated data from different sources, and demonstrated and made full use of the spatial information, so as to make the interpretation to the result more reasonable.
In the study, the data accuracy wasn’t well satisfied the demand of water quality assessment of regional micro-scale, far more samplings of the areas with poor water quality was still needed. In the subsequent researches, detecting instruments with higher accuracy needed to detect the quality of water sources, in order to obtain more meticulous analysis and assessment. Further analysis and assessment were recommended for the next step of research work.
In this study, the exposure way just took average drinking intake into consideration which excluded other toxic substances and their routes, for instance, inhaling by dermal touch and the form of steam and dieting. Actually, the exposure risk of pollutants was underestimated. The exposure risk by drinking was also closely bound up with residence time of water in domestic pipe network, consumer’s life style, consuming habit and career. So more complicated exposure assessment method was needed to get the average exposure dose by consumer touch, the daily distribution of pollutants exposure dose and the main exposure chance that individual was affected by pollutants [38].
6. Acknowledgement
This study was financed jointly by Sichuan Agricultural University youth science and technology innovation fund (00530300) and Sichuan Agricultural University introduced the talented person fund (00530301).
REFERENCES
- F. M. Geng, et al., “Risk degree assessment on water quality health hazard of drinking water sources,” Journal of Hydraulic Engineering, Vol. 37, No. 10, pp. 1242− 1245, October 2006.
- E. X. Li and B. Ling, “Effect of water pollution on human health,” Sanitary Engineering of China, Vol. 5, No. 1, pp. 3−5, May 2006.
- Y. R. Yin and Z. L. Deng, “Analysis on relationship between drinking water and health,” Scientific and Technological Information of China, pp .219−221, December 2006.
- J. Z. Qian, R. Z. Li, et al., “Health risk assessment on source water quality of urban water supply,” Journal of Hydraulic Engineering, pp. 1−5, August 2004.
- Y. H. QIN, “Processing technic and sanitation of drinking water,” Chemical Industry Press, Beijing, pp. 5−54, 2002.
- OAK RIDGE National Laboratory, “Risk assessment information system [EB/OL],” http://rais.ornl.gov/tox /tox_values, shtml, July 2006.
- U. S. Environmental Protection Agency,“Integrated risk information system [EB/OL],” http://www.epa.gov/iris /index, html, March 2006.
- International Agency for Research on Cancer, “Cancer database [EB/OL],”http://monographs.iarc.fr /ENG/ Classification/index.php.
- F. Q. Ni, et al., “Health risk evaluation on water quality of rural water sources of western margin of Sichuan Basin,” Progress in Natural Science (manuscript reviewing, awaiting publishing).
- X. L. Mao and Y. S. Liu, “Research progress on environmental risk assessment home and abroad,” Scientific Journal of Application Foundation and Engineering, Vol. 11, No. 3, pp. 266−273, November 2003.
- E. B. Hu, “Practical techniques and methods of environmental risk assessment,” State Environmental Science Press, Beijing, 2000.
- H. Hong, H. W. Chen, J. T. He, et al., “Theories and methods of health risk evaluation on contaminated sites,” Earth Science Frontiers, Vol. 13, No. 1, pp. 216−223, 2006.
- Mark and D. Sobsey, “Drinking water and health research:A look to the future in the united states and globally,” Journal of Water and Health, No. 4, pp. 17−22, 2006.
- R. Kumar, R. D. Singh, and K. D. Sharma, “Water resources of India, special section: Water,” Vol. 89, No. 5, pp. 793−811, September 2005.
- L. J. H. Lee, C. C. Chan, and C. W. Chung, “Health risk assessment on residents exposed to chlorinated hydrocarbons contaminated in groundwater of a hazardous waste site,” Journal of Toxicology and Environmental Health, Part A, No. 65, pp. 219−235, 2002.
- C. Carlsson and R. Fuller, “Fuzzy multiple criteria decision making: Recent developments,” Fuzzy Sets and Systems, pp. 139−153, Vol. 78, 1996.
- R. L. Sanson, “The development of a decision support system for an animal disease emergency,” Department of Veterinary clinical sciences Massey university, March 1993.
- Z. Y. Zang, Y. Zhao, L. Wei, et al., “Health risk assessment of an abandoned chemical plant in Beijing,” Journal of Ecotoxicology, Vol. 3, No. 1, pp. 48−55, February 2008.
- L. Huang, P. C. Li, and B. W. Liu, “Health risk assessment of groundwater pollution of Yangtze river delta,” Safety and Environmental Engineering, Vol. 15, No. 2, pp. 26−30, June 2008.
- Y. F. Liao, W. Y. Wang and L. Zhang, “Application study of GIS on urban NOx induced health risk assessment,” Progress in Geography, Vol. 26, No. 4, pp. 44−53, July 2007.
- T. J. Wang, X. F. Zha, and W. N. Xiong, “Preliminary evaluation of health risk assessment on heavy metal contamination of Karstic groundwater in Gaoping area, Zunyi city, Guizhou province,” Research of Environmental Sciences, Vol. 21, No. 1, pp. 46−51, January 2008.
- Z. Q. Wang, W. G. Sun, D. K. Wang, et al., “Appraisal report on present drinking water safety in rural areas of Ya’an city,” Unpublished data sources, Ya’an Water Conservancy and Hydropower Survey and Design Research Institute, April 2005.
- D. K. Wang, et al., “Application of healthy hazard assessment in environmental quality evaluation,” Environmental Pollution and Prevention, Vol. 7, No. 5, pp. 91−92, 1995.
- EPA, “Superfund public health evaluation manual,” EPA/540/186060.
- U. S. EPA, “Available information on assessment exposure from pesticides in food,” U. S. Environmental Protection Agency Office of Pesticides Programs, June 2000.
- EPA, “Supplement risk assessment,” Part 1, USA: EPA, pp. 26−35, 1989.
- J. J. Gao, L. P. Zhang, and S. B. Huang, “Preliminary evaluation on health risk of heavy metal pollutants in drinking water sources in Beijing,” Vol. 25, No. 2, pp. 47−50, 2004.
- G. M. Zeng, L. Zhuo, Z. L. Zhong, et al., “Water environmental health risk evaluation model,” Advances in Hydroscience , Vol. 9, No. 3, pp. 212−217, 1998.
- L. G. Chen, M. J. Chen, and L. H. Feng, “Safety evaluation of water source quality based on health risk assessment,” Journal of Hydraulic Engineering, Vol. 39, No. 2, pp. 235−244, February 2008.
- H. B. Luo, R. XU, X. L. Liu, et al., “The system design of water environmental health risk assessment in river,” Proceedings of the 5th International Conference on Urban Watershed Management & Mountain River Protection and Development, Chengdu, China, April 3−5, 2007.
- L. LI, W. Z. Zhang and W. Y. Chen, “GIS Technology and Application in Environmental Protection,” http:// www. tzwhx.com/ newOperate/html/5/51/511 /941.html.
- L. Zhang and T. J. Yan, “Application of GIS in resource and environment filed,” http: // qkzz.net/ magazine/ 1672−3198/ 2007/09/2110036.html.
- “Dynamic monitoring system of river water quality based on GIS,” http://www.ck365.cn/anli/1674.html.
- “Application of GIS in provincial water environment function regionalization,” Information Center of Environmental Protection in GanSu Province, Environmental Monitoring Center of Gansu Province, 2006.
- X. H. Zhou, X. J. Li, and C. R. Gao, “Application of geo-statistical analysis in water quality assessment based on GIS-A case study of Linhe city in Inner Mongolia,” Journal of Capital Normal University (Natural Science Edition), Vol. 29, No. 4, pp. 52−58, 2008.
- Y. S. Yang and J. L. Wang, “GIS-based dynamic risk assessment for groundwater nitrate pollution from agricultural diffuse sources,” Journal of Jilin University (Earth Science Edition), Vol. 37, No. 2, pp. 311−318, March 2007.
- Y. F. Hu, L. J. Deng, S. R. Zhang, F. Q. Ni and J. Zhang, “Spatial variability characteristics of iron and manganese contents in shallow groundwater of western margin of Sichuan Basin,” Journal of Ecology, Vol. 29, No. 2, pp. 797−803, February 2009.
- F. Q. Ni, et al., “Health risk assessment on rural drinking water safety: A case study in rain city district of Ya’an city of Sichuan province,” Journal of Water Resource and Protection, No. 2, pp. 128−135, 2009, doi:10.4236/ jwarp. 2009.12017 Published Online August 2009 (SciRP.org/ journal/ jwarp/).