Journal of Cancer Therapy
Vol. 4 No. 5A (2013) , Article ID: 31829 , 10 pages DOI:10.4236/jct.2013.45A006
Dietary Conjugated Linoleic Acids Arrest Cell Cycle Progression and Prevent Ovarian Cancer Xenografts Growth Suggesting a Trans-10 Cis-12 Isoform Specific Activity#
![]()
1Knight Cancer Research Institute, Oregon Health and Sciences University, Portland, USA; 2Department of Public Health and Preventive Medicine, Oregon Health and Sciences University, Portland, USA; 3Division of Gynecologic Oncology, Oregon Health and Sciences University, Portland, USA; 4Rich Graviss Pvt. Ltd., India; 5Cytopathology Lab, Legacy Emanuel Hospital, Portland, USA; 6Molecular and Medical Genetics, Oregon Health and Science University, Portland, USA.
Email: †thuillie@ohsu.edu
Copyright © 2013 Philippe Thuillier et al. This is an open access article distributed under the Creative Commons Attribution License, which permits unrestricted use, distribution, and reproduction in any medium, provided the original work is properly cited.
Received March 20th, 2013; revised April 21st, 2013; accepted April 28th, 2013
Keywords: Dietary Prevention; Ovarian Cancer; Cell Cycle; DNA Damage; Tumor Inhibition
ABSTRACT
Therapies for treating ovarian cancer (OvCa) successfully are largely inadequate. Alternative therapies and diet(s) with preventive potential to debilitate onset of, and reduce OvCa tumor burden in situ, have not been systematically studied. Preventive role of conjugated linoleic acids (CLAs) has been reported in many other cancers. We report the first systematic in vitro and in vivo study modeling potential preventive mechanism(s) of CLA, an octadecadienolic fatty acid in clear cell OvCa cell line TOV-21G. We demonstrate that a dose and time-dependent down-regulation of cyclin E and A proteins (p < 0.05) by CLA (t10,c12) was concomitant with cell cycle arrest of TOV-21G cell lines in S phase. To understand the molecular mechanism underlying CLA (t10,c12) induced S phase arrest, levels of cell cycle regulatory proteins were determined by western blot analyses. Exposure to CLA (t10,c12) increased p21(CIP1/WAF1), and p27(KIP1) protein levels in a time and dose-dependent manner. Interestingly CLA (t10,c12) did not significantly affect protein levels of cyclin-dependent kinase (cdk) 2, and p53 however, hyperphosphorylated form of pRb (p < 0.05) were abrogated. Exposure to CLA (c9,t11) indicated a modest increase in p21(CIP1/WAF1) and p27(KIP1) levels, but changes in cyclin A and E levels were statistically insignificant. These results indicate that CLA (t10,c12) mediated p27(KIP1) upregulation and inhibition of hyperphosphorylation of ppRb may be the possible mechanism for the S phase arrest in TOV-21G cell line. Our in vivo data showed that CLA reduced the progression of TOV-21G xenografts by >50%. Together our results provide evidence of CLA exerted preventive effect on OvCa cell and tumor growth. Tumor growth arrest may be resultant from CLA (t10,c12) mediated modulation of cell cycle arrest.
1. Introduction
Ovarian cancer (OvCa) is undisputedly a lethal disease. OvCa involves small distinct organ, the ovaries, but it is heterogeneous and difficult to treat as is reflected in a greater than 50% death statistics in patient populations in the US for the past twenty years [1] . Hence it is important to develop preventive intervention strategies which may reduce and prevent the onset and/or progression of OvCa in patients at greater risk of developing OvCa.
Limited dietary interventions targeting OvCa prevention include correlative case control and cohort studies between easily available foods including dairy food consumption and OvCa risk [2,3]. These studies have produced diverse findings. Fats and meats derived from dairy animals are a rich source of conjugated linoleic acids (CLA). CLA cis9-trans11 (c9,t11) and trans10- cis12 (t10,c12) isoforms consumed naturally through milk, dairy and ruminant meat, are the most biologically active isoforms [4]. CLA a strong antioxidant is readily incorporated into cell membrane phospholipids. CLA isoforms have been reported to influence various cell functions such as proapoptotic activity, cell cycle progression, inflammation, and angiogenesis [5]. CLA chemopreventive activities have been well documented in several cancers, including skin, breast, colon, and other cancers [6,7] However the role of CLA as a preventive agent has not been comprehensively studied in OvCa, specifically in difficult to treat ovarian clear cell carcinoma (OCCC) subtype.
Investigations into molecular basis for developing OvCa in the last two decades have yielded greater insights into the genetics of the ovarian tumor itself but a clear precursor genetic lesion for cancerous ovarian tumours remains elusive [8-12]. While high penetrance targetable genetic marker(s) and gene(s) have not definitively been identified in OvCa, a trend in low penetrance genes in several pathways including genes involved in the DNA damage repair pathway has emerged, leading to acknowledgment that OvCa can be classified into different genetic subtypes [12]; Genes involved in homologous DNA damage repair (DDR) including genes in the Fanconi Anemia (FA) pathway have strongly been implicated in OvCa pathology by several groups including our own group [9,13]. The DDR pathway gene expression has been reported to be coordinately regulated by the retinoblastoma (pRb)-elongation factor 2 (E2F) pathway [14] and cell cycle regulators [15].
We hypothesized that administration of CLA (c9,t11) and (t10,c12) to OCCC TOV-21G cells deficient in FANCF (a member of the FA family) would offer protection against the growth of cancer cells both in vitro and in vivo by promoting genomic stability through cell cycle modulation. Since modulation of cell cycle regulatory proteins through CLA could represent important preventive mechanism, we propose that these protective effects would be mediated through cell cycle arrest of cancer cells defective in DDR due to FANCF silencing.
2. Materials and Methods
2.1. Cell Culture
TOV-21G cells obtained from ATCC (Atlanta, GA, US) were cultured in 1:1 mixture of DMEM:RPMI 1640 supplemented with 15% FCS (Hyclone) containing, 10 g/ml Insulin (Sigma). Cells were harvested for protein preparation, chromosome breakage analysis, cell survival analysis, and apoptosis assays at indicated times. TOV-21G cells exhibit MMC hypersensitivity due to a FANCF deficiency as described below. Our CLA concentrations were comparable to those used in in vitro studies in human breast cancer cells [16]; All experiments were performed a minimum of three times.
2.2. Antibodies
We used following antibody dilutions: polyclonal anti p53 and pRb (Santa Cruz Biochemicals, 1:500, and 1:200 respectively); anti anti-phospho-Rb (Pharmingen, 1:250) anti cyclin E (Santa Cruz Biochemicals, 1:250 dilution); anti Cdk2 (Natutek, eBioscience, 1:200); anti antip21(CIP1/WAF1), anti-p27(KIP1) and anti-cyclin D1 and anticylin A (Cell Signaling, 1:1000), and anti-cyclin A (Cell Signaling, 1:500). Mouse monoclonal anti-actin and antia-tubulin antibody (Sigma, 1:20,000) were used as internal comparative and standard control.
2.3. Cell Proliferation Assay
Equal numbers of TOV-21G cells (5 × 10³) seeded in a 24 well dish in 200 l volume of complete medium and were allowed to attach overnight The treatment groups were treated with either 1 or 10 μM/L CLA (c9,t11) and CLA (t12,c10) in the culture medium over a period of 96 hours. Proliferation at indicated times was assessed by adding 5 mg/ml of 3-(4,5-Dimethyl-2-thiazolyl)-2,5- diphenyl-2H-tetrazolium bromide (MTT) solution in PBS (Gibco BRL) and incubating at 37˚C for 2 hours. After 2 hours, 200 μl of DMSO was added to each washed well to dissolve the formazan crystals. The absorbance at 540 nm was determined using a plate reader (Promega Corporation).
2.4. Chromosomal Breakage and MMC Sensitivity
Cells (3 × 10³ - 5 × 10³) were treated with 10 μM/L or 100 μM/L of each CLA (c9,t11), CLA (t12,c10) or an equimolar CLA mix for 72 hours and then incubated with Mitomycin C (MMC) (40 ng/ml) or diepoxybutane (DEB) (200 ng/ml) as described in Pejovic et al. [17]. After 72 hour incubation with MMC or DEB, sub-confluent monolayer of cells were washed once with DPBS and exposed to Colcemid (0.25 μg/ml) for two hours. Cells harvested at the conclusion of colcemid treatment by 0.75 M KCl hypotonic solution were fixed in 3:1 methanol: acetic acid solution. Slides were stained with Wright stain, and 50 metaphase cells were microscopically scored for chromosomal breaks and radial formation.
2.5. Flow Cytometry
Approximately 2 × 10⁵ - 4 × 10⁵ cells plated in 60 mm dishes were exposed to either 10, and 100 μM/L CLA (c9,t11), or CLA (t12,c10) and incubated for up to 96 hours. Cells harvested at 24 hour intervals by trypsinization followed by centrifugation (1000 rpm, 5 minutes, RT) were fixed gently (drop by drop) by the addition of 4˚C, 70% ethanol (in PBS). Fixed cells incubated 1 hour to overnight at 4˚C were resuspended in a PBS solution of 3.8 mM/L sodium citrate, 100 g/ml propidium iodide and 10 g/ml RNase A. Staining was carried out at 4˚C in the dark. These fixed and stained cells were were sorted for their DNA content by FACScalibur flow cytometer (BD Biosciences) equipped with an argon ion laser at 488 nm wavelength for their DNA content. Cell cycle distribution was determined and analyzed with Modfit software (Verity Software House)
2.6. Immunoblots
TOV-21G cells were treated in vitro for up to 72 hours with different concentrations of CLA (c9,t11) or CLA (t10,c12). Whole-cell extracts were prepared in lysis buffer (50mM/L Tris-HCL, pH7.4, 150 mM/L NaCl, 1% NP-40, 0.1% Sodium deoxycholate, 4 mM/L EDTA) supplemented with protease inhibitors (1 μg/ml leupeptin, 1 μg/ml pepstatin, 2 mg/ml aprotinin, and 1mM/L phenylmethylsulfonyl fluoride) and phosphatase inhibitors (2 mM/L sodium orthovanadate and 10 mM/L sodium fluoride). We analyzed 20 - 50 μg of proteins boiled in 1× Laemli buffer (2% SDS, 20% Glycerol, 0.5 M Tris-HCL (pH 6.8), 10% β-Mercaptoethanol). Proteins transferred to nitrocellulose membrane and blocked with either 5% nonfat dried milk, or 3% BSA in TBS-T (10 mM/L Tris, 150 mM/L NaCl (pH 8.0), 0.1% Tween 20) were incubated with primary antibodies diluted in TBS-T overnight. Horseradish peroxidase conjugated secondary antibodies were employed for antigen detection using Super Signal West Pico Chemiluminescence substrate (Pierce Biotechnology, Rockford, IL).
2.7. Xenograft
TOV-21G cells (1.2 million) mixed with matrigel (BD biosciences) in 100 μl volume were injected into the right flank of two months old B6CB17-PRKDC SCID/S female mice. The mice were randomly selected and divided into two groups. One group was provided the standard diet (Corn oil, 5.0%, Coconut oil, 10.0%, CLA (c9,t11), 0%, CLA (t10,c12), 0%, Casein, 20 g/100g, Dextrose, 65 g/100g, Cellulose, 5 g/100g DL-Methionine, 0.3 g/100g, Choline bitartrate, 0.2 g/100g Mineral mix AIN-76, 3.50 g/100g, Vitamin mix AIN-76, 1.00 g/100g), the second group was fed normal diet supplemented with CLA (Corn oil, 5.0%, Coconut oil, 8.50%, CLA (c9,t11), 0.75%, CLA (t10,c12), 0.75%, Casein, 20 g/100g, Dextrose, 65 g/100g, Cellulose, 5 g/100g DL-Methionine, 0.3 g/100g, Choline bitartrate, 0.2 g/100g Mineral mix AIN-76, 3.50 g/100g, Vitamin mix AIN-76, 1.00 g/100g). Both diets were isocaloric. All mice were provided water and food ad libidum. Tumours were measured using Vernier’s calipers every week for the first three weeks and twice a week till experiment termination. Body weight of each mouse was recorded at the same time. When the control untreated tumor volume reached a volume > 1200 mm3, experiment was humanely terminated.
2.8. Statistics
Data, from 3 independent replicates of cells or animals, was presented as the mean ± standard deviation (SD) and was analyzed with student’s t test. The p-value of less than 0.05 was considered to be statistically significant.
3. Results
3.1. CLA Inhibits TOV-21G Growth
A time-course and dose response experiment was performed to determine the effects of CLA on TOV-21G cell proliferation. As shown in Figure 1, TOV-21G cells treated with CLA (c9,t11) and (t10,c12) for 96 hours show that the number of viable TOV-21G cells in the cultures treated with CLA (t10,c12) declined in a dosedependent manner compared with vehicle-treated cells. A maximum of 45% reduction in viable TOV-21G cells was observed at 10 μM/L of CLA (t10,c12) dose. The differences in viable cell numbers were significant at this concentration, with p < 0.05. The effect of CLA (c9,t11) on the proliferation TOV-21G cells in culture over time is also shown in Figure 1. Whereas the control (vehicle treated) cells continue to proliferate the proliferation of 10 μM/L CLA (c9,t11) treated cells was inhibited by 10% but was statistically not significant (p < 0.3). We did not detect cell death as evidenced by trypan blue ex-
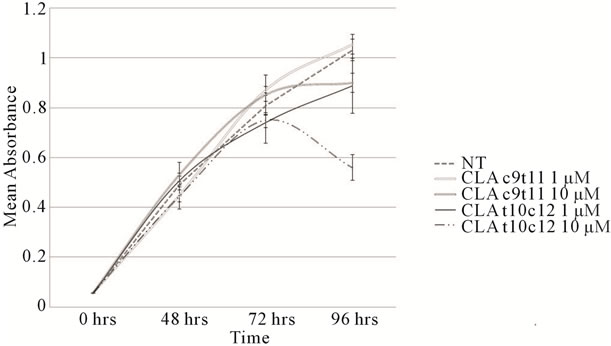
Figure 1. Cell proliferation profiles. TOV-21G cells plated at 5000 cells/well in 24-well tissue culture dishes were allowed to adhere overnight. Cells were then incubated for up to 96 hours in the absence or presence of the indicated concentrations of CLA isomers (c9,t11) and (t10,c12). Luminescence was quantified to assess proliferation as described in methods. Proliferation values were counted at 24 hour interval in at least three independent experiments in triplicates. NT = Not Treated.
clusion analysis (data not reported) and did not observe dead cells floating in the medium in any of the treatments.
3.2. CLA Blocks Cell Cycle Progression
The effect of CLA isomers on TOV-21G cell cycle distribution were examined by flow cytometry. The flow cytometry data indicated that asynchronous TOV-21G cells cultured in control medium, showed an overall distribution of cells as 47.2% ± 9% G0/G1, 34% ± 4% S phase and 19% ± 4.4% G2/M phase (Figure 2, Table S1(a)). However, treatment with 10 μM/L and 100 μM/L CLA (c9,t11) for up to 72 hours had no significant effect on the fraction of cells occupying the S (37.9% - 42.1%)
or G2/M window (17% - 19%) (Figure 2, Table S1(a)). Interestingly there was a progressive increase in the percentage of S phase cells over time with CLA (t10,c12) treatment. Exposure of the cells with 100 μM CLA (t10,c12) for 72 hours delayed cells in the S phase (51% - 57%) while 26% ± 5.6% cells occupied the G2/M fraction. (Table S1(a)). S phase arrest has been associated with the inappropriate expression of Rb/E2Ffamily of proteins or failure to inactivate the E2F-1/DP-1 complex through phosphorylation of cdk enzymes [14,18]. The cdk2 complex responsible for the phosphorylation of the E2F-1/DP-1 complex and its subsequent inability to bind to E2F-1 consensus sequences [19] may promote cell cycle arrest in the S phase [18,19].
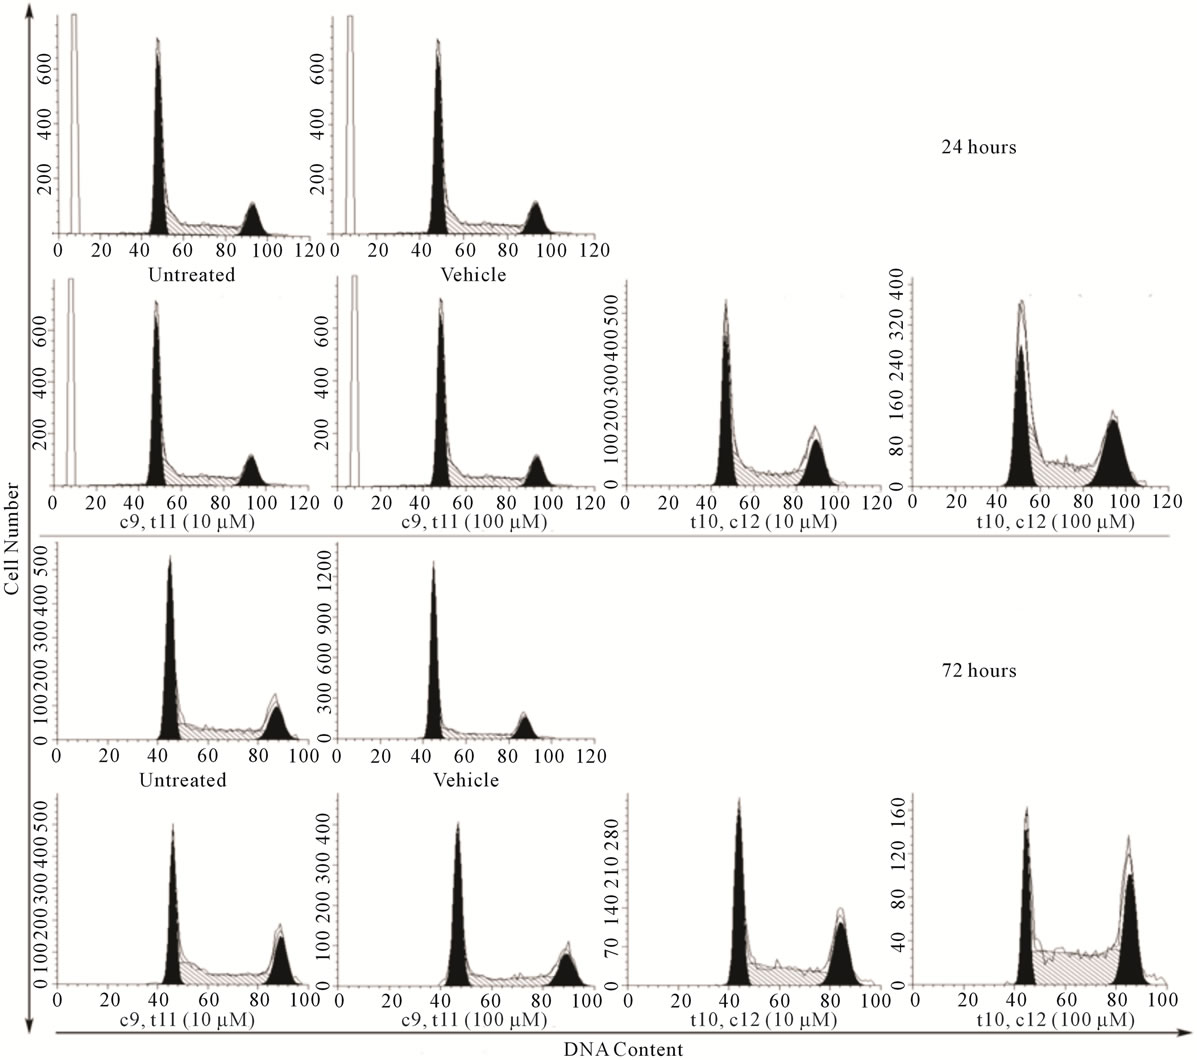
Figure 2. CLA (t10,c12) exposure arrests TOV-21G cells in S phase of cell cycle. TOV-21G cultures exposed to two different dosage of CLA isomers (c9,t11) and (t10,c12) as described in materials and methods were harvested after 24 and 72 post CLA (c9,t11) and CLA (t10,c12) exposure and stained with propidium iodide for DNA content. Histograms represent 110 events where cell cycle profiles were determined using MODFIT. After 72 hours of CLA (t10,c12) at 100 μM exposure cell numbers in the S phase ( 50% - 52%) increased compared with S phase in controls (30% - 38%).
3.3. CLA Differentially Modulates Cell Cycle Regulatory Proteins
We subsequently analyzed proteins associated with the control of cell cycle progression such as p53, pRb, and their target molecules p21(CIP1/WAF1), p27(KIP1) after 72 hours of CLA exposure in TOV-21G cells. Western blot analysis of total cell lysates indicated that the CLA-induced cell cycle arrest was paralleled by insignificant differences in p53 levels (Figure 3(a), Table S2). Significantly higher levels of p21(CIP1/WAF1), and p27(KIP1) with both the CLA (c9,t11) and CLA (t10,c12) treatments (Figures 3(b) and (c), Table S2) were observed. Significantly enhanced p21(CIP1/WAF1) p27(KIP1) levels may results in cell cycle arrest by inhibiting the cyclin E and A cdk2 complexes (Figures 3(b) and (c), Table S2). This data may indicate the cell cycle arrest in the OCCC TOV-21G cells is dependent upon p21(CIP1/WAF1) and p27(KIP1), but independent of p53. The phosphorylation profile of retinoblastoma protein (pRb) in CLA (c9,t11) treated TOV-21G cells showed hyperphosphorylation at 10 μM/L, but 100 μM/L treatment reduced the phosphorylation of pRb (Figure 3(d)). However pRb was hypophosphorylated at 10 and 100 μM/L CLA (t10,c12) treated cells indicating that pRb is in an active state, inhibiting cell cycle progression. The total pRb protein
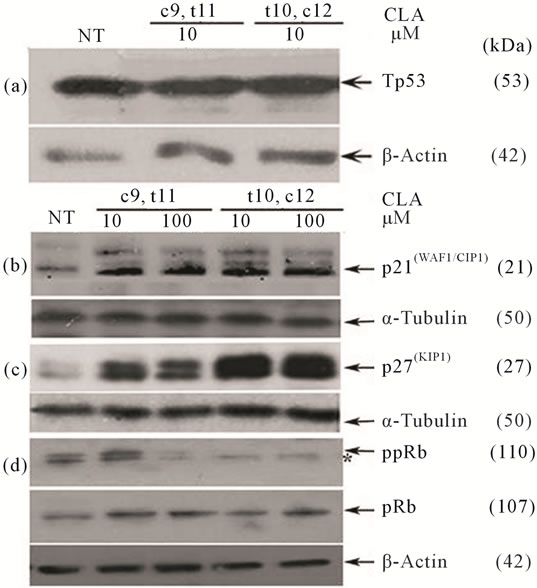
Figure 3. Effect of CLA isomers on cell cycle regulatory protein levels 72 hours post exposure. Immunoblots from the same experiment represent (a) p53; (b) p21(CIP1/WAF1); (c) p(27KIP1); and (d) Phospho-pRb and total pRb. Clear elevation in p21(CIP1/WAF1), p27(KIP1) and a reduction of pRb phosphorylation was observed following treatment with CLA (t10,c12). Symbol (*) denotes hypophosphorylated species of pRb. α-Tubulin and β-Actin were used as intersample and intrasample loading control (n = 3).
levels for corresponding samples are shown below the ppRb panel (Figure 3(d)).
We investigated various cell cycle associated cyclin proteins, cyclins A, D, E and cdk2. A representative experiment is shown in Figure 4, (Figure 4(b)). Cyclin D is the first cyclin produced in cycling cells in response to extracellular signals. However higher levels of cyclin D in CLA (t10,c12) treated cells were not statistically significant as compared with the CLA (c9,t11) treated cells (Table S2). Next we found that cyclin E levels in CLA (t10,c12) treated TOV-21G cells were reduced compared to untreated control and CLA (c9,t11) treated cells (Figure 4(a)). We did not detect a significant difference in cdk2 levels with either CLA (t10,c12) or CLA (c9,t11) exposure (Figure 4(d), Table S2). Further, cyclin A, the only cyclin which regulates multiple steps in cell cycle by binding cdk2 and cdk1 [20], was significantly low in cells treated with CLA (t10,c12) whereas its levels were similar to untreated controls in cells treated with CLA (c9,t11) (Figure 4(c)). Together our results of high levels of p27(KIP1), hypophosphorylated pRb and low levels of cyclin, E and A strongly indicate inhibiting cdk2 function during S phase transition to G2/M phase. This protein profile may also act to inhibit the activity of other cdks, including cdk1, either directly or indirectly (Figures 3 and 4 and Table S2).
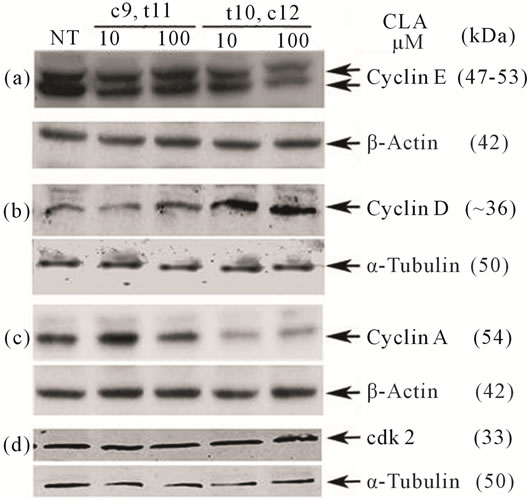
Figure 4. Effect of CLA isomers on cyclin proteins and cdk2 in TOV-21G after 72 hours of CLA (c9,t11) and CLA (t10,c12) exposure. Equal volumes of whole cell extracts containing 50 μg of protein were separated on 12.5% SDSPAGE and electrophoretically blotted. Immunoblots shown are from the same experiment. (a) Cyclin E; (b) Cyclin D; (c) Cyclin A; and (d) cdk2. Levels of cyclin E and A were reduced and cyclin D were elevated after CLA (t10,c12) treatment. The levels of cdk2 were not significantly altered. Housekeeping proteins α-Tubulin and β-Actin were used as an intersample and intrasample loading control (n = 3).
3.4. CLA Inhibits DNA Damage as Shown by Radial Formation
TOV-21G cells derived from primary malignant clear cells ovarian carcinoma (OCCC) were exposed to CLA for 72 hours. The radial formation with MMC or DEB was scored manually after treatment (Table 1). TOV- 21G cells have higher chromosomal instability as they carry a biallelic silencing of the FA pathway FANCF gene [21]. The extent of crosslinking in the cancer cells pointed to pro-apoptotic cell population. Between 0% - 15% of cells were assessed to be inherently apoptotic and hence formed DNA radials. As shown in Table 1, TOV- 21G sensitivity to MMC and DEB results in radial formation. In the presence of CLA this pro-apoptotic population showed a significant deviation from the untreated cells. Treatment with a 50/50 mixture of CLA (c9,t11) and (t10,c12) resulted in a decrease in DNA damage as revealed by reduced MMC crosslinking while DEB crosslinking showed increased radial formation. Interestingly, CLA (c9,t11) and CLA (t10,c12) induced opposite response to MMC crosslinking. Cells treated with CLA (c9,t11) had no increase in MMC induced DNA crosslinking but a significant increase in DEB induced cell sensitization to DNA damage. In contrast CLA (t10,c12) significantly decreased DNA damage sensitivity as shown by both MMC and DEB crosslinking profile. These observations prompt us to infer that CLA (t10,c12) may exert preventive effect on DNA damage in these cells.
The combined effect of CLA on cell cycle arrest and DNA damage suggested that prolonged action of CLA might stall cells from cycling and promote their death in vivo and thereby impede tumor growth.
3.5. CLA Retards Growth of Xenograft in Mice
Healthy two month old female immunodeficient SCID mice on C57BL/6 background (B6CB17-PRKDC
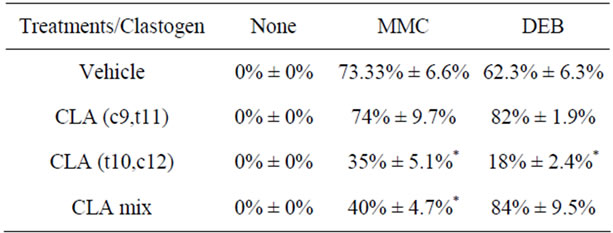
Table 1. Chromosomal crosslinking with clastogens. Characteristic 50G-banded metaphase chromosome analysis after crosslinking with Mitomycin C (MMC) and diepoxybutane (DEB) for each sample showed breaks, gaps, radial formation and rearrangements. Averaged scores for control samples and experimental conditions are shown (n = 3). Standard deviations are indicated for each sample and each condition.
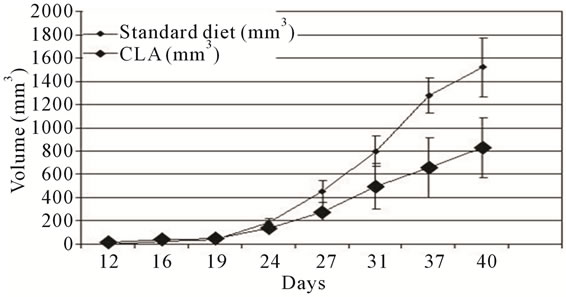
SCID/S) were injected with 1.2 million cells on the right flank as described in the materials and methods section. The mice were randomly separated into three cages and one cage containing 4 mice was maintained on the control diet whereas the other 2 cages were fed standard diets supplemented with 1.5% CLA (c9,t11 and t10,c12 mixture). One of the mice in the group that received CLA did not develop tumours at all. Average tumour volume from the rest of the mice is shown in Figure 5(a). By week five, the tumours in the untreated group of animals were visually larger and by week 6, the TOV-21G tumor in untreated animals reached close to maximum allowable 1.2 cm3 mass. The tumor load in the treatment group in the first three weeks was equivalent to the untreated group. Tumors in the treatment groups had slower growth at later time points. At the conclusion of the experiment the average tumor volume derived from treated groups was, 54.8% ± 1% of the average tumor volume in the untreated group. Animals were euthanized at this time; macroscopic examination consistently revealed the presence of primary tumors in untreated and treated ani-
 (a)
(a)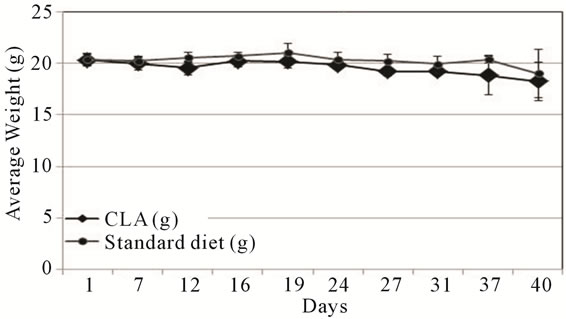 (b)
(b)
Figure 5. TOV-21G xenograft tumor progression. (a) Nude mice were injected subcutaneously (s.c.) with TOV-21G cells and allowed to grow up to 42 days post s.c. cell injection. Mice in randomly divided groups were fed either standard (black circles) or diet supplemented with CLA (black diamonds). The error bars represent standard deviation in tumor size among the mice in standard and CLA diet groups; (b) The average weight of mice during the duration of the experiment is shown. Error bars represent the standard deviation among the mice in a group.
mals on the flank. Additional tumors metastatic growth elsewhere, or clinical symptoms were not detected in any of the animals. We also monitored the weights of all participating mice throughout the experiment. Individual mouse body weights did not fluctuate during the experiment and average weights of animals between the two groups did not vary significantly (Figure 5(b)).
4. Discussion
The inhibition of multifactorial cellular processes by naturally occurring chemopreventive agents with lower toxicities may provide molecular basis for chemoprevention. Several cancer models have noted isoform specific effect of CLA positional isomer CLA (t10,c12) and CLA (c9,t12) on carcinogenesis (Figure 6). However, to date no studies have investigated CLA chemopreventive effects in ovarian cancer cells or animal models. We report here for the first time that CLA (t10,c12) has a growth inhibitory activity in an isomer specific manner in TOV-21G cells. TOV-21G cells harbor a biallelic silencing of FANCF, which may have an effect on DDR pathway. This defect makes cells sensitive to cross linking agent such as MMC and DEB [22,23]. Clearly, CLA (t10,c12) might offer protection to these cells by reducing the number of DS DNA breaks and resultant radial formation in the genome. The mechanisms by which this may occur are consistent with a role of CLA on oxidative stress by regulation of reactive oxygen species and activation of the phase II antioxidant pathway [22,23].
Cell cycle control plays a critical role in the regulation of tumor cell proliferation. Many cytotoxic agents arrest cell cycle at the G1, S, or G2-M phase. We observed that CLA (t10,c12) induced S phase cell cycle arrest in TOV-21G cells. The cell cycle arrest was concomitant with significant increase in the p21(CIP1/WAF1), p27(KIP1), and cyclin D protein levels, and significant reduction in cyclin E and cyclin A levels. We observed that pRb protein was hypophosphorylated in CLA (t10,c12) treated samples in a dose and time dependent manner. pRb is a classic tumor suppressor and cell cycle regulator that controls cell cycle progression through the late G1 phase and promotes entry to S phase [15,24]. Kinases responsible for pRb phosphorylation in vivo are known to include members of the cdk family including cdk2 and cdk4 and
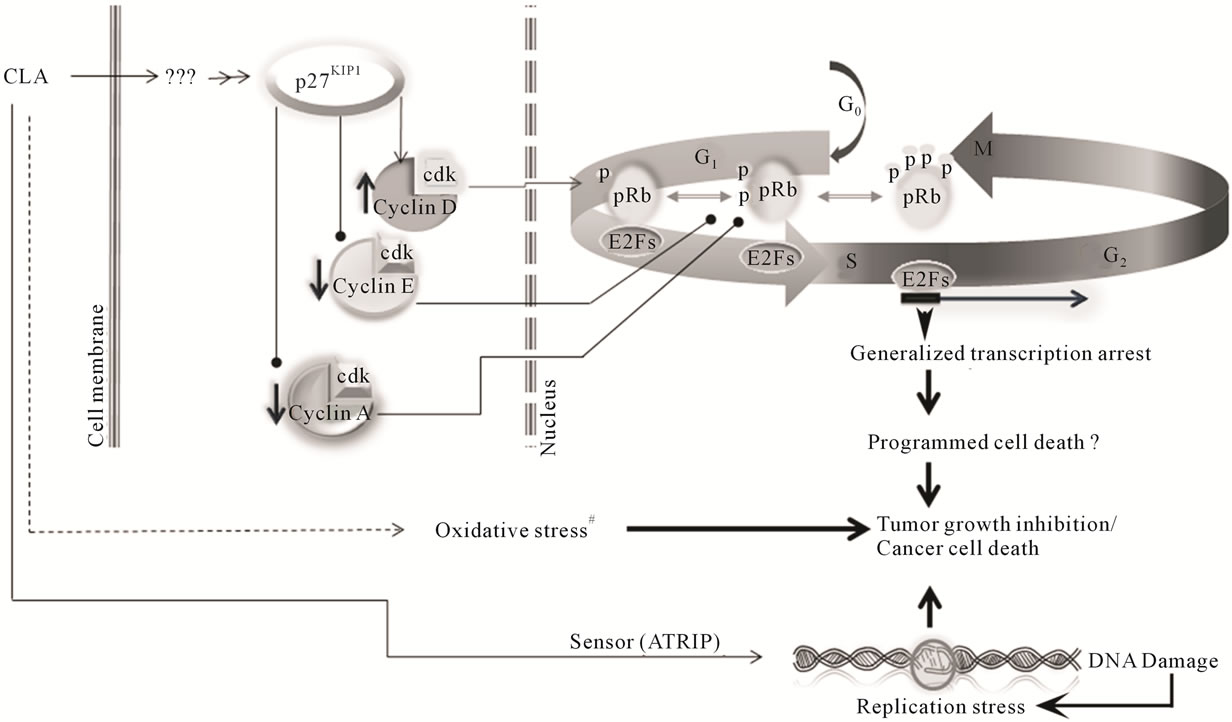
Figure 6. Working model for CLA chemopreventive effects in ovarian cancer cells. CLA (t10c,12) induces p27(KIP1) to high levels probably through an as yet unidentified intermediate. The p27(KIP1) has been shown to bind cyclin D cdk4 complexes. The elevated cyclin D1 complexes then lead to phosphorylation of retinoblastoma protein (pRb) allowing release of transcription factor E2F to promote expression of genes leading to progression from the G1 phase to the S phase of the cell cycle. However, reduced cyclin E levels, in response to high p27(KIP1) create a negative feedback loop leading to the loss of phostphorylation of pRb. The dephosphorylation of pRb arrests transcription activation and consequent arrest in DNA replication. Cyclin A reduction at the S phase boundary further contributes to this negative loop, arresting cells in the S phase. #Indicates pathways previously described by our group and others [7,16,17,27,29].
cdk6. cdk2 associates with cyclin E and A, whereas cdk4/6 associate with D type cyclin [24]. However CLA (t10,c12) did not have any significant effect on the levels of cdk2. Distinct cyclin/cdk complexes phosphorylate different serine and threonine residues in pRb during cell cycle progression [24]. This suggests that phosphorylation of different pRb sites by distinct cdks may result in differential regulation of downstream effector pathways. Our observation that phosphorylation levels of Rb were lower in CLA (t10,c12) treated cells probably stems from a decrease in the cyclin E/cdk2 complex and coincides with reports from others. Phosphorylated pRb is unable to interact with E2F-transcritption transactivators, thus leaving large pool of free E2F transcription factors driving the G1/S cell cycle transition through transcription activation [25]. E2F transcription factors are over expressed in roughly half of the ovarian cancers and are involved in the transcription of key cell cycle regulatory proteins [25]. Profound differences in p21(CIP1/WAF1) and p27(KIP1) levels after treatment with both CLA isomers may be the cause of differential levels of cyclins D, E and A, however, we did not observe a significant difference in p53 protein levels between untreated controls and cell treated with CLA. Therefore the regulatory mechanism governing cell cycle progression under the influence of CLA might be independent of p53 [26].
Our mouse study presents direct evidence that an equimolar mixture of CLA (c9,t11) and CLA (t10,c12) inhibited TOV-21G xenografts growth by more than 50%. This inhibition demonstrates an efficient growth inhibitory property of CLA against OCCC tumours. The effectiveness of CLA (1.5% in diet) is consistent with our previous work [7]. Our results are remarkable since orally delivered CLA reduced tumor growth by more than 50% as compared with untreated mice group. An implication of oral administration of CLA is economic, since the health-care delivery cost compared with injection-only drugs (such as adjuvant chemotherapies) requiring administration by health-care professionals is considerable. Our in vivo data warrants larger animal studies and exploration of therapeutic applications of CLA in OCCC.
Consistent with our findings CLA (t10,c12) was effective in inducing apoptosis in colon, prostate and breast cancer [27]. In contrast some recent in vivo studies in breast cancer [28] and colon cancer [29] suggest that CLA (t10,c12) actually promoted growth of cancerous tumours in transgenic mouse models overexpressing ErbB2 and β-catenin respectively. However this difference in in vivo studies and in vitro studies may arise from the artifacts of the in vivo systems where an oncogene is constitutively being overexpressed. The overexpression of an oncogene may affect its upstream and downstream interactome abnormally resulting in enhanced tumorigenesis. To the best of our knowledge TOV-21G cells have normal ErbB2 expression [30] and have an active β-catenin pathway. Thus the contradictory findings in in vivo studies and our observation of response to the CLA (t10,c12) may be due to other yet uncharacterized differences in β-catenin and ErbB2 pathway.
Our findings warrant follow-up studies with robust biochemical description in vivo so we can fully understand the regulatory mechanism(s) controlling cell cycle progression and cell growth arrest with CLA isomers. The growth arrest mechanism(s) might potentiate the use of this natural preventive agent with lower toxicities as adjuvant therapy to treat cancer.
The combined effects of CLA on oxidative stress, DNA damage and cell cycle arrest results in a synergistic targeted program cell death and tumor growth arrest. Mechanisms for these effects still remain to be elucidated.
REFERENCES
- N. Howlader, et al., “Use of Imputed Population-Based Cancer Registry Data as a Method of Accounting for Missing Information: Application to Estrogen Receptor Status for Breast Cancer,” American Journal of Epidemiology, Vol. 176, No. 4, 2012, pp. 347-356. doi:10.1093/aje/kwr512
- J. M. Genkinger, S. A. Smith-Warner, et al., “A Pooled Analysis of 12 Cohort Studies of Dietary Fat, Cholesterol and Egg Intake and Ovarian Cancer,” Cancer Causes Control, Vol. 17, No. 3, 2006, pp. 273-285. doi:10.1007/s10552-005-0455-7
- S. C. Larsson, N. Orsini and A. Wolk, “Milk, Milk Products and Lactose Intake and Ovarian Cancer Risk: A Meta-Analysis of Epidemiological Studies,” International Journal of Cancer, Vol. 118, No. 2, 2006, pp. 431-441. doi:10.1002/ijc.21305
- A. Bhattacharya, et al., “Biological Effects of Conjugated Linoleic Acids in Health and Disease,” Journal of Nutritional Biochemistry, Vol. 17, No. 12, 2006, pp. 789-810. doi:10.1016/j.jnutbio.2006.02.009
- A. Kennedy, et al., “Antiobesity Mechanisms of Action of Conjugated Linoleic Acid,” Journal of Nutritional Biochemistry, Vol. 21, No. 3, 2010, pp. 171-179. doi:10.1016/j.jnutbio.2009.08.003
- N. S. Kelley, N. E. Hubbard and K. L. Erickson, “Conjugated Linoleic Acid Isomers and Cancer,” Journal of Nutrition, Vol. 137, No. 12, 2007, pp. 2599-25607.
- P. Thuillier, et al., “Activators of Peroxisome Proliferator-Activated Receptor-Alpha Partially Inhibit Mouse Skin Tumor Promotion,” Mol Carcinog,. Vol. 29, No. 3, 2000, pp. 134-142.
- D. J. Slamon, et al., “Studies of the HER-2/Neu ProtoOncogene in Human Breast and Ovarian Cancer,” Science, Vol. 244, No. 4905, 1989, pp. 707-712. doi:10.1126/science.2470152
- A. Bellacosa, et al., “Molecular Alterations of the AKT2 Oncogene in Ovarian and Breast Carcinomas,” International Journal of Cancer, Vol. 64, No. 4, 1995, pp. 280- 285. doi:10.1002/ijc.2910640412
- L. Shayesteh, et al., “PIK3CA Is Implicated as an Oncogene in Ovarian Cancer,” Nature Genetics, Vol. 21, No. 1, 1999, pp. 99-102. doi:10.1038/5042
- M. L. McCoy, C. R. Mueller and C. D. Roskelley, “The Role of the Breast Cancer Susceptibility Gene 1, No. (BRCA1) in Sporadic Epithelial Ovarian Cancer,” Reproductive Biology and Endocrinology, Vol. 1, 2003, p. 72. doi:10.1186/1477-7827-1-72
- P. Spellman, et al., “Integrated Genomic Analyses of Ovarian Carcinoma,” Nature, Vol. 474, No. 7353, 2011, pp. 609-615. doi:10.1038/nature10166
- W. Z. Wysham, et al., “BRCAness Profile of Sporadic Ovarian Cancer Predicts Disease Recurrence,” PLoS One, Vol. 7, No. 1, 2012, p. e30042. doi:10.1371/journal.pone.0030042
- E. E. Hoskins, et al., “Coordinate Regulation of Fanconi anemia Gene Expression Occurs through the Rb/E2F Pathway,” Oncogene, Vol. 27, No. 35, 2008, pp. 4798- 4808. doi:10.1038/onc.2008.121
- M. Tategu, et al., “Systems Biology-Based Identification of Crosstalk between E2F Transcription Factors and the Fanconi Anemia Pathway,” Gene Regul Syst Bio, Vol. 1, 2007, pp. 1-8.
- B. Majumder, et al., “Conjugated Linoleic Acids, No. (CLAs) Regulate the Expression of Key Apoptotic Genes in Human Breast Cancer Cells,” FASEB Journal, Vol. 16, No. 11, 2002, pp. 1447-1449.
- T. Pejovic, et al., “Cytogenetic Instability in Ovarian Epithelial Cells from Women at Risk of Ovarian Cancer,” Cancer Research, Vol. 66, No. 18, 2006, pp. 9017-9025. doi:10.1158/0008-5472.CAN-06-0222
- H. S. Zhang, et al., “Exit from G1 and S Phase of the Cell Cycle Is Regulated by Repressor Complexes Containing HDAC-Rb-hSWI/SNF and Rb-hSWI/SNF,” Cell, Vol. 101, No. 1, 2000, pp. 79-89. doi:10.1016/S0092-8674,No.00)80625-X
- Y. Zhang, et al., “S-Phase Arrest and Apoptosis Induced in Normal Mammary Epithelial Cells by a Novel Retinoid,” Cancer Research, Vol. 60, No. 7, 2000, pp. 2025- 2032.
- N. Bendris, et al., “Cyclin A2 Mutagenesis Analysis: A New Insight into CDK Activation and Cellular Localization Requirements,” PLoS One, Vol. 6, No. 7, 2011, p. e22879. doi:10.1371/journal.pone.0022879
- T. Taniguchi, et al., “Disruption of the Fanconi AnemiaBRCA Pathway in Cisplatin-Sensitive Ovarian Tumors,” Nature Medicine, Vol. 9, No. 5, 2003, pp. 568-574. doi:10.1038/nm852
- G. Pagano, “Mitomycin C and Diepoxybutane Action Mechanisms and FANCC Protein Functions: Further Insights into the Role for Oxidative Stress in Fanconi’s Anaemia Phenotype,” Carcinogenesis, Vol. 21, No. 5, 2000, pp. 1067-1068. doi:10.1093/carcin/21.5.1067
- G. Pagano and H. Youssoufian, “Fanconi Anaemia Proteins: Major Roles in Cell Protection against Oxidative Damage,” Bioessays, Vol. 25, No. 6, 2003, pp. 589-595. doi:10.1002/bies.10283
- J. Bloom and F. R. Cross, “Multiple Levels of Cyclin Specificity in Cell-Cycle Control,” Nature Reviews Molecular Cell Biology, Vol. 8, No. 2, 2007, pp. 149-160. doi:10.1038/nrm2105
- D. Reimer, et al., “Expression of the E2F Family of Transcription Factors and Its Clinical Relevance in Ovarian Cancer,” Annals of the New York Academy of Sciences, Vol. 1091, 2006, pp. 270-281. doi:10.1196/annals.1378.073
- K. H. Vousden and C. Prives, “Blinded by the Light: The Growing Complexity of p53,” Cell, Vol. 137, No. 3, 2009, pp. 413-431. doi:10.1016/j.cell.2009.04.037
- M. A. Belury, Inhibition of Carcinogenesis by Conjugated Linoleic Acid: Potential Mechanisms of Action,” Journal of Nutrition, Vol. 132, No. 10, 2002, pp. 2995- 2998.
- M. M. Ip, et al., “The t10,c12 Isomer of Conjugated Linoleic Acid Stimulates Mammary Tumorigenesis in Transgenic Mice Over-Expressing erbB2 in the Mammary Epithelium,” Carcinogenesis, Vol. 28, No. 6, 2007, pp. 1269-1276. doi:10.1093/carcin/bgm018
- J. Rajakangas, et al., “Adenoma Growth Stimulation by the Trans-10, Cis-12 Isomer of Conjugated Linoleic Acid, No. CLA) Is Associated with Changes in Mucosal NF-kappaB and Cyclin D1 Protein Levels in the Min Mouse,” Journal of Nutrition, Vol. 133, No. 6, 2003, pp. 1943-1948.
- N. Presneau, et al., “Patterns of Expression of Chromosome 17 Genes in Primary Cultures of Normal Ovarian Surface Epithelia and Epithelial Ovarian Cancer Cell Lines,” Oncogene, Vol. 22, No. 10, 2003, pp. 1568-1579. doi:10.1038/sj.onc.1206219
Supplementary
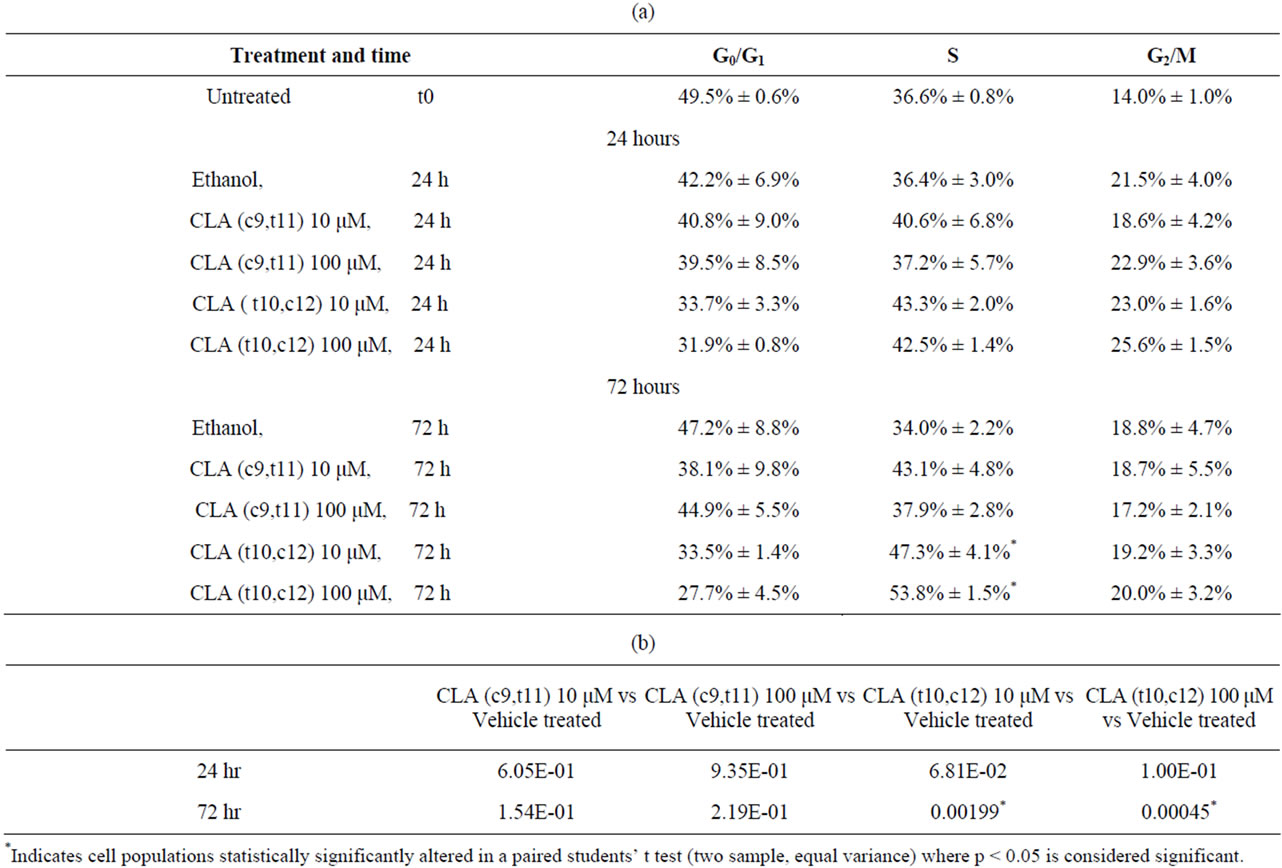
Table S1. Quantification of cell cycle profile in Figure 2. After treatment, the DNA content was assessed by flow cytometric analysis. The percentages of cells in G0/G1, S, G2/M, and sub-G1 were quantified by WinMDI 2 software. Data are presented as means ± SEMs. *Represents p < 0.05, students’ t test where data set is tested for equal variance. Results are representative of three or more independent experiments. (a) Percent distribution of cells in cell cycle phases; (b) Statistically significantly paired students’ t test for S phase cell population over time.
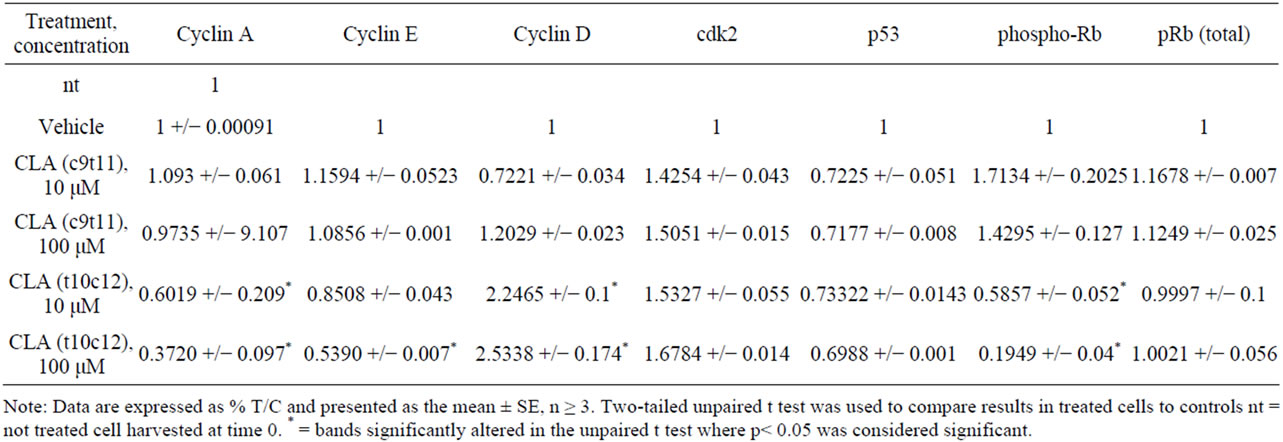
Table S2. Quantification of protein bands in western blots in Figures 3 and 4. Protein bands in western blots were quantified by densitometric assessment using Image J software. The bands of interest were normalized to corresponding control band in the same blot. Fold change was calculated in comparison with the untreated or vehicle treated control bands of protein of interest in the same blot. Data are presented as means ± SEMs. *Represents p < 0.05 students t test where data set is tested for equal variance results are representative of three or more independent experiments.
NOTES
#This work was supported by grant CA112083-01 (PT), and by Circle of Giving (NTP).
*Equal contribution and authorship.
†Corresponding author.