Journal of Cancer Therapy
Vol.2 No.1(2011), Article ID:4105,11 pages DOI:10.4236/jct.2011.21006
Comparative Kinetics of Immune Responses and Changes in Cellular Sub-Sets Detected in Colorectal Cancer Patients Vaccinated with MVA-5T4 (TroVax) Administered Alongside Two Different Chemotherapy Regimens
![]()
1Oxford BioMedica (UK) Ltd., The Medawar Centre, Oxford Science Park, Oxford, UK;
2The Christie Hospital, Manchester, UK;
3St. James University Hospital, Leeds, UK.
Email: r.harrop@oxfordbiomedica.co.uk
Received January 26th, 2011; revised February 11th, 2011; accepted February 16th, 2011.
Keywords: Immune Response, MVA-5T4 (TroVax), Chemotherapy
ABSTRACT
Modified vaccinia Ankara (MVA) virus encoding the tumor antigen 5T4 (MVA-5T4; TroVaxâ) has been tested in two open-label phase II studies in metastatic colorectal cancer patients alongside two chemotherapy regimens, 5-fluorouracil, folinic acid and irinotecan (IrMdG) or 5-fluorouracil, folinic acid and oxaliplatin (OxMdG). The aim of this study was to investigate the kinetics of immune responses and changes in cellular sub-sets before, during and after treatment with each chemotherapy regimen. In total, 23 patients received the complete course of treatment which comprised 2 injections before, during and after completion of chemotherapy. Antibody and cellular responses specific for 5T4 and MVA were monitored throughout the study and changes in immune cell subsets were determined. All 23 evaluable patients mounted MVAand 5T4-specific cellular and/or humoral responses. Patients on both trials showed significant reductions in the numbers of neutrophils and the proportion of regulatory T cells (Treg) within the CD4+ T cell population. Monocyte and NK cell numbers decreased significantly in patients treated with IrMdG but not OxMdG. The largest increase in 5T4-specific cellular responses was observed 2 weeks following the completion of chemotherapy which was coincident with a decrease in Treg levels. Both chemotherapy regimens resulted in a significant decrease in the proportion of peripheral Tregs. Levels of Tregs during chemotherapy showed an inverse correlation with 5T4 cellular responses detected immediately post-chemotherapy. These data may support a rationale for sequencing chemotherapy with immunotherapy strategies at time points when Treg levels are predicted to be low.
1. Introduction
Chemotherapy remains one of the cornerstones of cancer treatment despite the side-effects associated with treatment. The common feature of cytotoxic chemotherapy products is the ability to orchestrate tumor cell death leading to a reduction in tumor burden and/or prevention of disease recurrence. It has been postulated that cytotoxic chemotherapy regimens increase the exposure of tumor antigens to cells of the immune system through the release of tumor cell fragments from dead or dying cells. The failure of this enhanced exposure to tumor antigens to induce an efficacious anti-tumor immune response that can control residual disease may be explained by the immuno-suppressive nature of both the cancer itself and the chemotherapeutic agent. For example, chemotherapy often induces neutropenia and/or lymphopenia [1] and therefore may compromise the immunological responsiveness of a recipient.
In contrast, cancer immunotherapy approaches depend upon the induction of efficacious anti-tumor responses and the generation of long-term memory [2]. Since tumor antigens are usually “self”, there is the added challenge that immune tolerance needs to be overcome. Therefore, the combination of an immunotherapy (such as a cancer vaccine) with an immuno-suppressive chemotherapy regimen has long been regarded as counter-intuitive. We have tested this paradigm by using modified vaccinia Ankara (MVA) to deliver the tumor antigen 5T4 (MVA- 5T4; TroVax®) to colorectal patients receiving standard chemotherapy regimens.
The tumor antigen being targeted, 5T4, is a 72 kDa transmembrane glycoprotein that is highly expressed on a broad range of carcinomas, but has restricted expression on normal tissues. Over expression of 5T4 is associated with metastatic spread and poor prognosis in patients with colon [3], gastric [4] and ovarian [5] carcinoma.
Currently, the majority of patients with newly diagnosed metastatic colorectal cancer are treated with irinotecan or oxaliplatin in combination with 5 fluorouracil (5-FU) and leucovorin as standard first-line chemotherapies [6]. Given the widespread use of these chemotherapy regimens and emerging data which suggest that some forms of chemotherapy may actually modulate immune responses, we undertook two phase II studies in metastatic colorectal cancer patients in which MVA-5T4 was administered in combination with OxMdG [7] or IrMdG [8]. Both studies demonstrated that MVA-5T4, used alongside these chemotherapy regimens, was well tolerated and capable of inducing 5T4-specific cellular and humoral immune responses in the majority of patients. Furthermore, immune responses were shown to correlate with clinical benefit [7].
Here, we provide a detailed description of immune response kinetics and changes in cellular sub-sets before, during and after treatment with each chemotherapy regimen.
2. Patients and Methods
2.1. Patient Characteristics
All data reported here are from two open-label phase II trials in which MVA-5T4 was administered by intramuscular injection to patients with metastatic colorectal cancer who were receiving either 5-FU/folinic acid plus oxaliplatin (OxMdG) or 5-FU/folinic acid plus irinotecan (IrMdG) as first line therapy [7,8]. All patients had histologically proven colorectal cancer, a WHO performance status of 0-2, a life expectancy of ≥ 3 months, were aged ≥ 18 years and had adequate hematological and liver function. Detailed descriptions of the patient characteristics have been published elsewhere [7,8].
2.2. Clinical Trial Design
Patients received either OxMdG or IrMdG at 2 week intervals starting at week 4 with up to 12 cycles being administered, depending on clinical response and tolerance. The vaccination and blood sampling schedule was identical for both trials; two MVA-5T4 immunizations were administered before chemotherapy (weeks 0 and 2), two during (weeks 11 and 17) and two following completion of chemotherapy (weeks X + 2 and X + 6; completion of chemotherapy being indicated as week X). Patients received approximately 5 × 10⁸ pfu MVA-5T4 via intramuscular injection in a volume of 1ml into the deltoid muscle. Blood was taken 2 weeks after each immunization to assess the induction of immune responses to test (5T4 and MVA) and control (Tetanus toxoid) antigens.
2.3. Measurement of Antibody and Cellular Responses
The enzyme linked immunosorbent assay (ELISA) was used to measure 5T4 and MVA specific antibody titers as described previously [9]. All test sera were compared against a pool of sera taken from 5 healthy (vaccinia naïve) donors. Antibody titer was defined as the greatest dilution of plasma at which the mean optical density (O.D.) of the test plasma was ≥ 2 fold the mean O.D. of the negative control (normal human serum; NHS) at the same dilution. If a pre-existing antibody response was detected, a positive response due to vaccination was reported if the post-injection antibody titer was ≥ 2 fold the antibody titer determined prior to MVA-5T4 immunization.
Proliferative responses were measured by 3H-thymidine incorporation following stimulation of 2 x 10⁵ PBMCs for 7 days with medium alone (RPMI/10; negative control), PHA (positive control), Tetanus toxoid (control antigen) or test antigens (5T4 protein, MVA) as described previously [10]. All protein antigens were used at a final concentration of 5 μg/ml and U.V. inactivated MVA at a concentration of 5 × 10⁶ pfu/ml. A stimulation index (S.I.) ≥ 2 was considered to be positive. In addition, a positive response due to vaccination was defined as an S.I. which was ≥ 2 and which was also ≥ 2 fold greater than the highest S.I. induced by the antigen at either of the pre-injection baseline time points.
2.4. Analysis of Changes in Cellular Sub-Sets and Cell Phenotypes
In order to determine the impact of chemotherapy on the levels of different cellular subsets, PBMCs collected at six different time points were analyzed. The 6 sampling time points represented three stages of the trial: 1) prior to chemotherapy (Pre-Chemo; weeks -2 to 4); 2) during chemotherapy (In-Chemo; weeks 6 to 19); and 3) following completion of chemotherapy (Post-Chemo; weeks X + 2 to X + 14). It should be noted that during the period that patients received chemotherapy, blood samples were usually collected 7 days post-infusion.
PBMCs were analyzed by flow cytometry using a FACSCalibur (Becton Dickenson, CA, USA). Frozen PBMCs were thawed and equilibrated in RPMI with 10% FBS for 1-2h before staining with antibodies against numerous cellular markers. The following monoclonal antibodies (mAbs) were used: anti-CD3-FITC (clone UCHT1), anti-CD4-biotin (Serotec; clone RPA-T4), antiCD8-biotin (Serotec; clone LT8), anti-CD14-APC (clone M5E2), anti-CD16-FITC (clone 3G8), anti-CD19-PE (Clone HIB19), anti-CD25-PE (clone M-A251), antiCD40-APC (clone 5C3). Unless otherwise stated the mAbs and appropriate immunoglobulin isotype controls were obtained from Becton Dickenson (CA, USA). Streptavidin conjugated to PerCP (peridinin chlorophylla-protein; BD Cat. no. 554064) was used to detect the biotinylated CD4 and CD8 antibodies. CD4+CD25high Tregs were identified as CD4+ cells which showed brighter CD25 staining than that of the CD4- population [11].
Staining for intracellular FoxP3 using clone PCH101 was performed using the anti-human Foxp3 staining set (eBioScience, CA, USA) according to the manufacturer’s instructions.
2.5. Statistical Analysis
For the analysis of changes in cellular subsets, all variables were log-transformed before analysis. For each subject, the mean of the transformed data was taken over each phase (Pre-Chemo, In-Chemo and Post-Chemo) separately; these means were the analysis variables.
The within-subject analyses were performed within each regimen (IrMdG, OxMdG) separately. Estimates were produced of the mean at each phase and the mean difference between the pre-chemotherapy phase and the other two phases. Then means and their differences were back-transformed to geometric means and their ratios for presentation.
Data were compared between the two trials/cohorts using Student’s t-test. The mean difference between the cohorts at pre-chemotherapy, and the mean difference between the cohorts in change from pre-chemotherapy to the later two phases was estimated and a P-value calculated. The differences were back-transformed to a ratio for presentation. A P-value < 0.05 was deemed significant.
3. Results
3.1. Patients
The disease characteristics and demographics of patients recruited to both trials were very similar [7,8]. In total, 12 patients in the MVA-5T4 + IrMdG trial (TV-IrMdG) and 11 patients in the MVA-5T4 + OxMdG trial (TVOxMdG) were evaluable for assessment of immune responses having had blood samples taken for immunological monitoring following each of the 6 vaccinations.
3.2. Antibody Responses
As reported previously, 20 of 23 (87%) patients, who were evaluable for assessment of immune responses, mounted positive 5T4-specific antibody responses following MVA-5T4 vaccination [7,8]. Two patients in the TV-IrMdG trial and 1 patient in the TV-OxMdG study failed to sero-convert. All 23 patients mounted MVAspecific antibody responses.
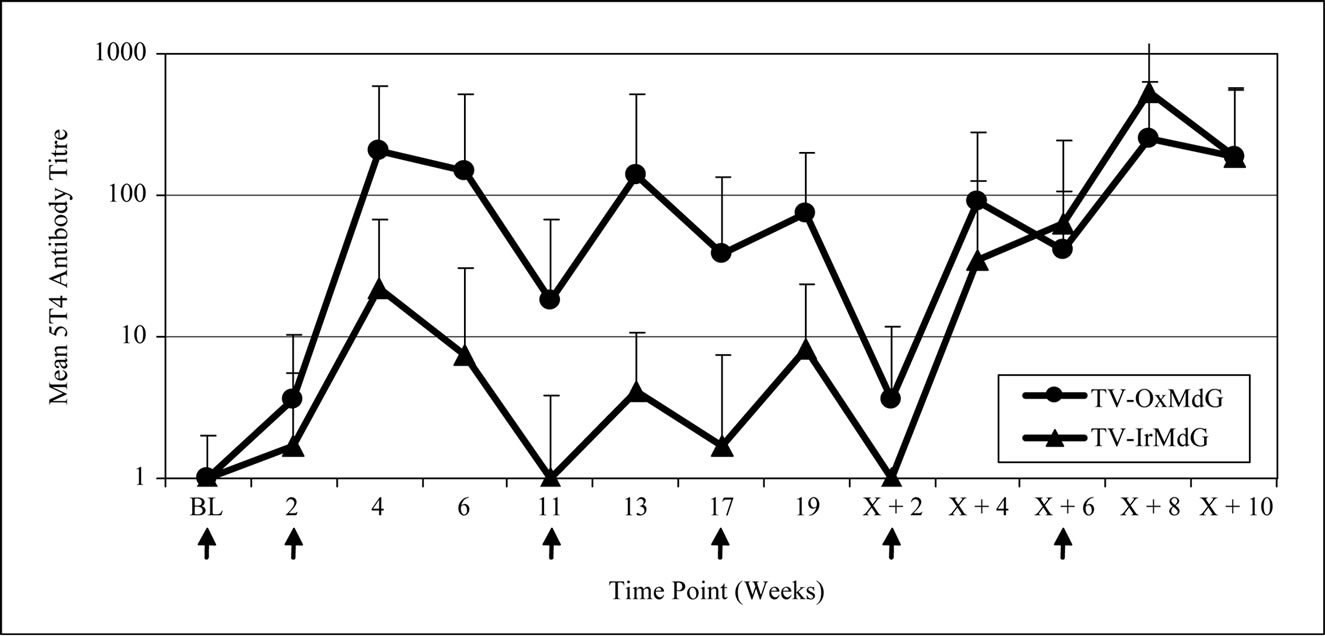
The kinetics of 5T4 and MVA antibody responses in both trials are compared in Figure 1(a) and 1(b) respectively. The pattern of 5T4 antibody response kinetics is similar for both trials across the vaccination time course (Figure 1(a)). However, the magnitude of the 5T4 response was lower in the TV-IrMdG trial than those detected in patients in the TV-OxMdG trial at the majority of sampling time points. In particular, the mean 5T4 antibody response was significantly lower in the TV-IrMdG trial than the TV-OxMdG trial at weeks 4 (p = 0.027) and 6 (p = 0.008) and this trend was still apparent at 17 (p = 0.084), 19 (p = 0.056) and X + 2 (p = 0.093) weeks.
The kinetics of MVA antibody responses was also similar between the two trials (Figure 1(b)), but the magnitude was significantly lower in TV-IrMdG trial at weeks 13 (p = 0.048), 19 (p = 0.027) and X + 2 (p = 0.017) and this trend was still apparent from weeks X + 4 to X + 10 (all p ~ 0.1).
3.3. Cellular Responses
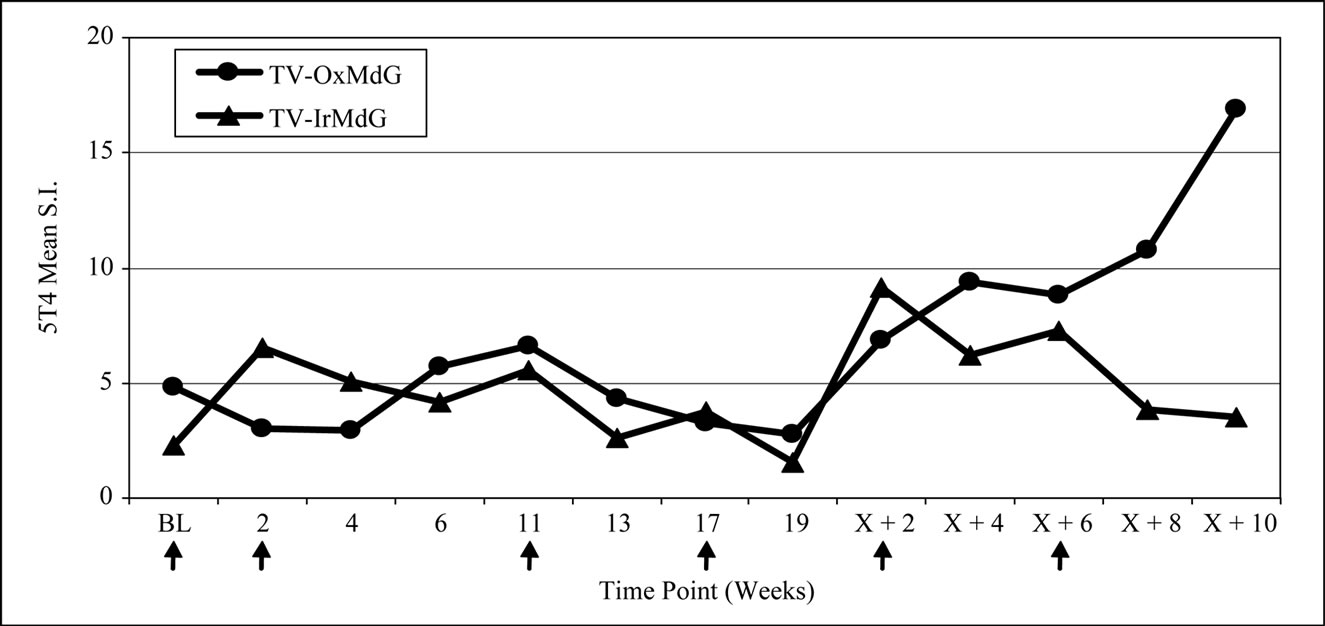
Proliferative responses specific for 5T4 protein were induced in 8 of the 11 (73%) evaluable patients on the TV-OxMdG trial and in 7 of 12 (58%) patients on the TV-IrMdG trial (data not shown). MVA-specific proliferative responses were induced in all 23 evaluable patients (data not shown). The kinetics of 5T4- and MVAspecific proliferative responses are illustrated in Figure 2(a) and 2(b) respectively. In general, the pattern of 5T4 and MVA proliferative responses was similar throughout both trials. However, 5T4 proliferative responses were significantly lower in TV-OxMdG trial than in the TV-IrMdG trial at week 0 (pre-treatment; p = 0.019) and 2 (p = 0.028), while the magnitude was significantly higher at week X + 8 (p = 0.016). No significant differences were detected in the mean MVA proliferative responses between trials at individual time points; however, responses were significantly higher during the period that patients received OxMdG (weeks 6 – 19) compared to those treated with IrMdG (p = 0.044).
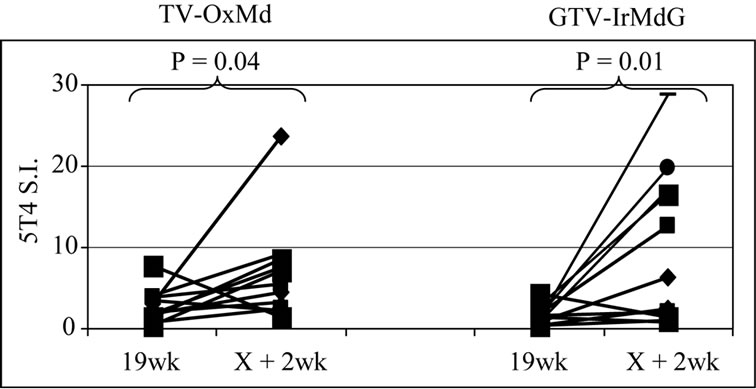
The frequency of positive proliferative responses to test (5T4 and MVA) and control (TT) antigens during chemotherapy (In-Chemo) and following completion of chemotherapy (Post-Chemo) as well as the fold increase in mean responses relative to baseline are detailed in Table 1. There was little difference in either the frequency or the fold increase of TT-specific responses during chemotherapy compared to post-chemotherapy in both trials. In contrast, both the fold increase and frequency of positive 5T4 and MVA proliferative responses were greater following completion of chemotherapy compared to during chemotherapy in both the TV-OxMdG and TV-IrMdG trials. The largest increase in 5T4-specific proliferative responses occurred between week 19 (during chemotherapy) and week X + 2 (the first sampling time point following completion of chemotherapy) in both trials. The time interval between week 19 and X + 2 was approximately 9 weeks, during which time no MVA- 5T4 vaccinations were administered. The 5T4-, MVAand TT-specific proliferative responses detected in each patient at week 19 and X + 2 are illustrated in Figure 3. The mean proliferative response for 5T4 increased significantly from 2.8 at week 19 to 6.9 at week X + 2 in the TV-OxMdG trial (p = 0.042) and from 1.6 to 9.9 in the TV-IrMdG trial (p = 0.014). However, mean proliferative responses specific for MVA or TT showed little or no increase between week 19 and X + 2 in the TV-OxMdG
 (a)
(a)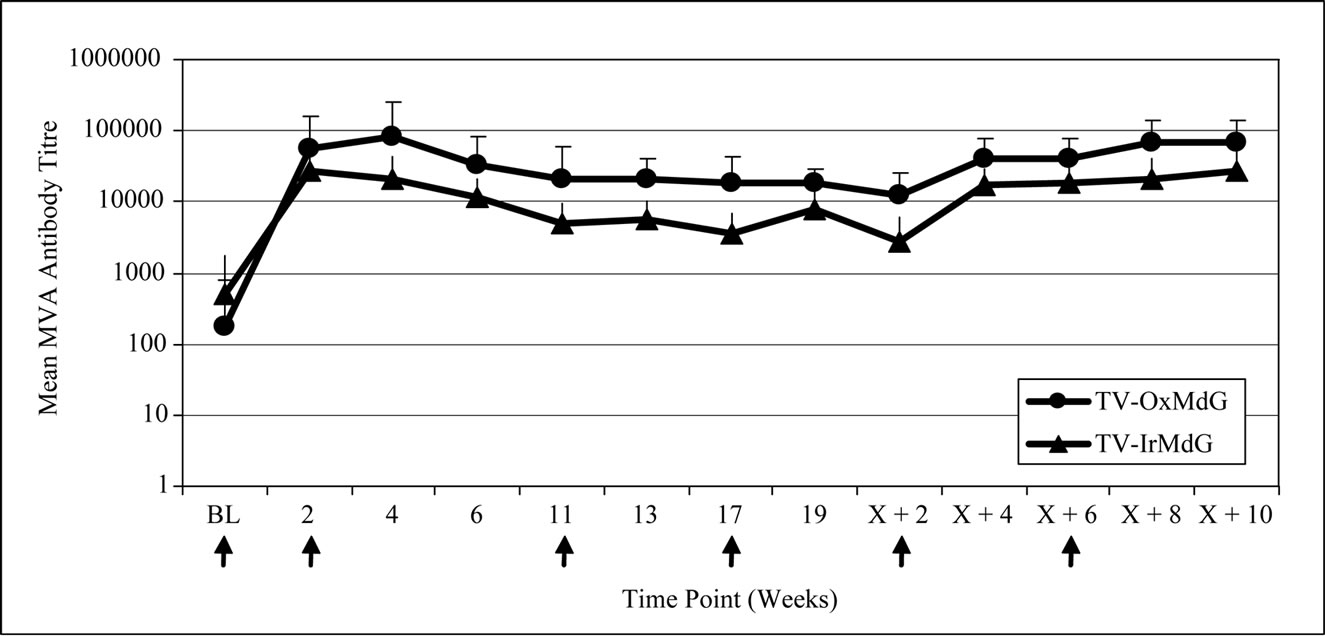 (b)
(b)
Figure 1. (a) 5T4 antibody responses; (b) MVA antibody responses.
 (a)
(a)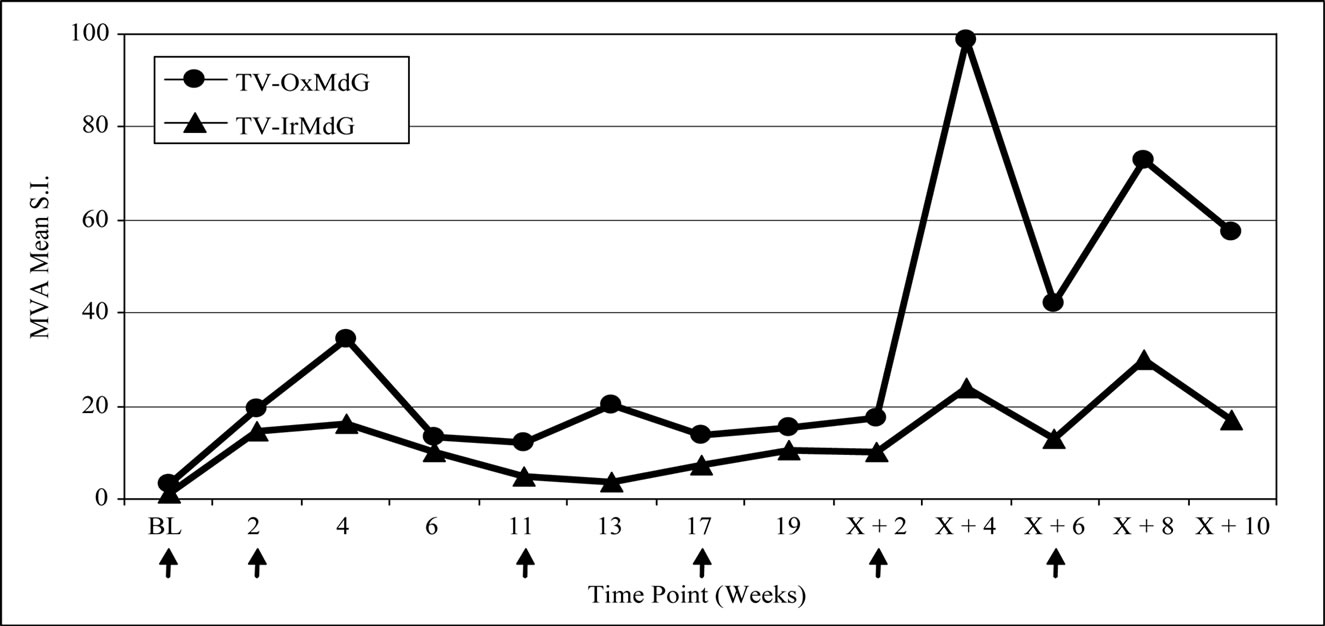 (b)
(b)
Figure 2. (a) 5T4 proliferative responses; (b) MVA proliferative responses.
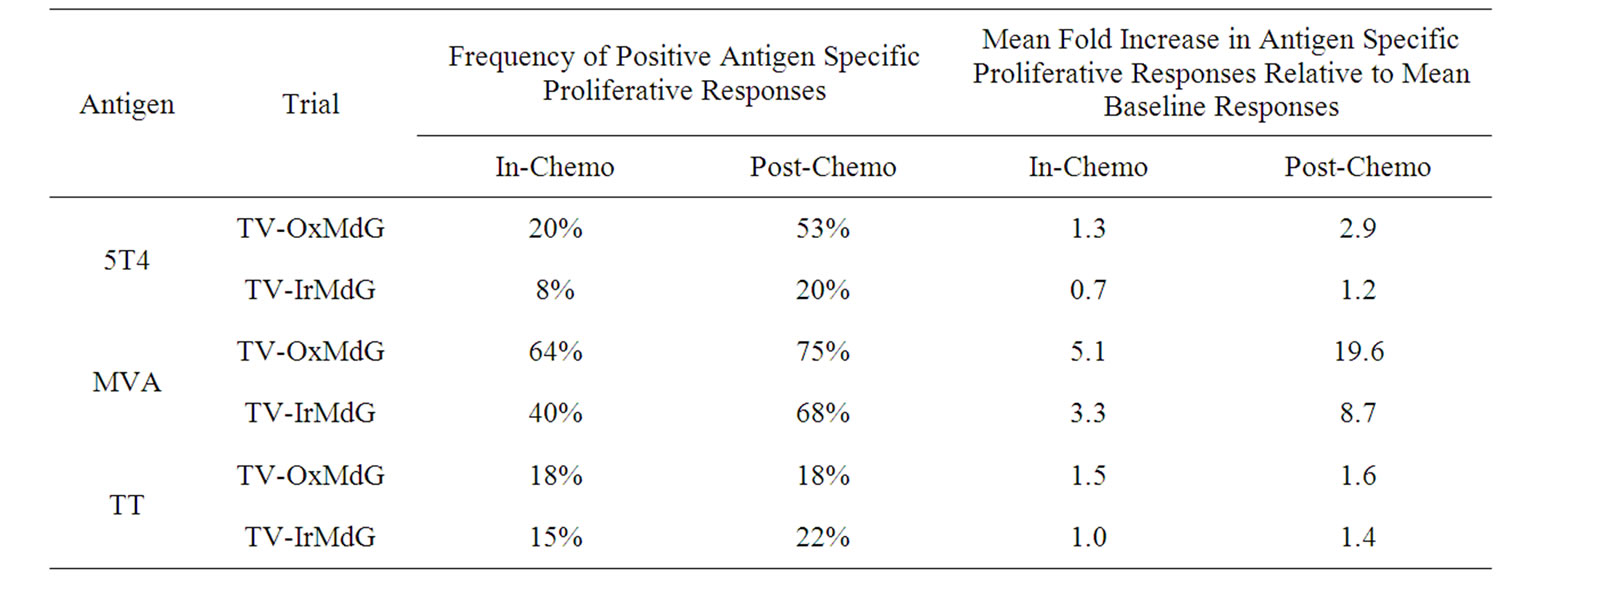
Table 1. Antigen-specific proliferative responses during chemotherapy (In-Chemo) and following completion of chemotherapy (Post-Chemo). The table details both the frequency and mean fold increase in antigen-specific proliferative responses.
 (a)
(a)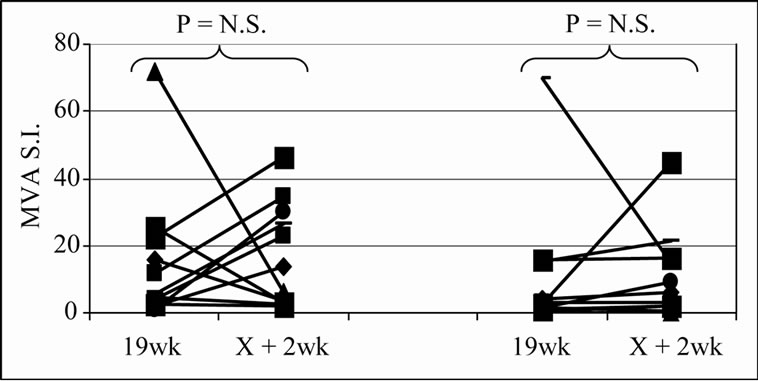 (b)
(b)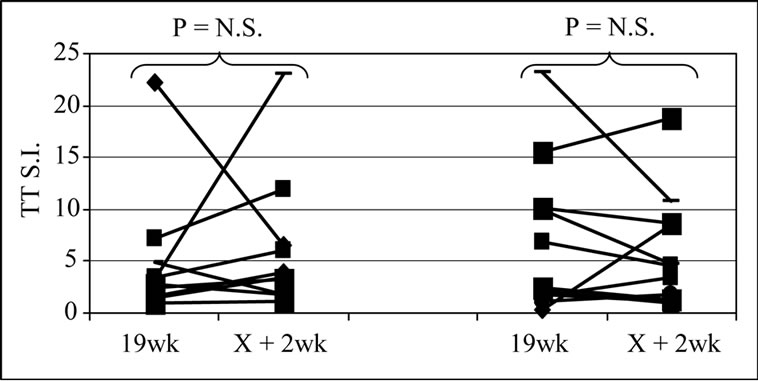 (c)
(c)
Figure 3. Proliferative responses specific for 5T4 (a), MVA (b) or TT (c).
trial (15.2 to 17.4 for MVA (p = 0.64) and 5.0 to 6.3 for TT (p = 0.49)) or the TV-IrMdG trial (10.5 to 11.0 for MVA (p = 0.32) and 6.8 to 5.9 for TT (p = 0.54)).
3.4. Changes in Cellular Sub-Sets throughout the Clinical Trial Time Course
Routine hematological analysis was performed throughout both trials at baseline and at weeks 4, 6, 8, 10, 12, 14, 16, 18, X and X + 2. Both chemotherapy regimens induced a significant decrease in absolute numbers of white blood cells (p < 0.0001), which was mainly driven by significant decreases in neutrophil numbers (p < 0.0001; data not shown).
A more detailed analysis of cellular sub-sets was undertaken on PBMCs collected for immunological analyses. Unfortunately, only 12 patients had sufficient PBMCs on which to undertake a detailed phenotypic analysis at sampling time points prior to, during and after treatment with IrMdG (n = 7 patients) or OxMdG (n = 5 patients). The numbers of B cells, T cells (CD4+ or CD8+), monocytes and NK cells were monitored before, during and after treatment with OxMdG or IrMdG (PreChemo, In-Chemo and Post-Chemo, respectively). No significant changes in cell numbers were detected before, during or after treatment with OxMdG (Table 2(a)). Similarly, patients treated with IrMdG showed no significant change in the mean numbers of B cells, T cells, CD4+ T cells and CD8+ T cells (Table 2(b)); however significant decreases in the mean numbers of monocytes (p < 0.001) and NK cells (p = 0.003) were observed during chemotherapy compared to pre-chemotherapy. CD14+ monocytes decreased from 2.37 × 10⁸/L prior to chemotherapy to 0.44 × 10⁸/L during the IrMdG cycles while NK cells (CD3-CD16+) decreased from 1.69 × 10⁸/L prior to chemotherapy to 0.70 × 10⁸/L during chemotherapy. Following completion of chemotherapy, the mean numbers of both monocytes and NK cell subsets returned to the levels observed prior to chemotherapy.
Patients treated with both OxMdG and IrMdG showed significant reductions in the mean proportion of CD4+CD25high Tregs during the period that chemotherapy was administered compared to pre-chemotherapy (p < 0.0001; Figure 4). Following completion of chemotherapy, the proportion of Tregs within the CD4+ population returned to the levels detected prior to chemotherapy (in the majority of patients levels had returned to pre-chemo levels by week X + 2). The regulatory phenotype of the CD4+CD25high cells was further defined by intracellular staining of FoxP3. In the majority of samples tested, 74-99% of CD4+CD25high T cells were positive for FoxP3
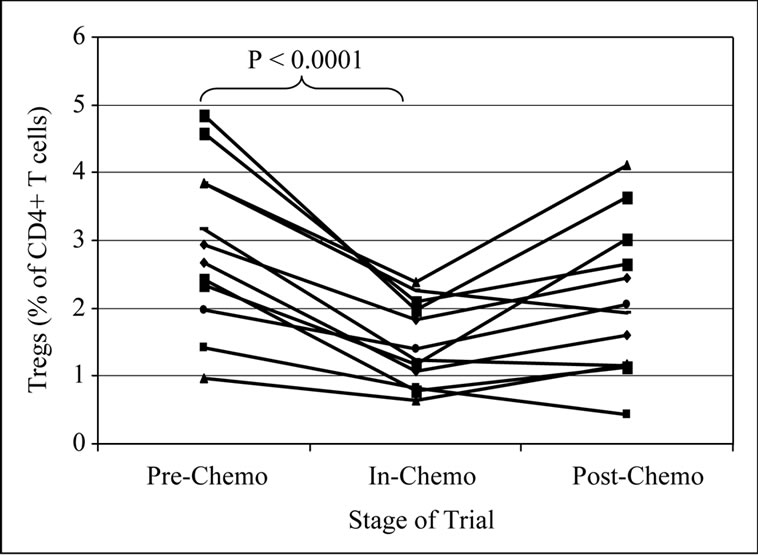
Figure 4. Change in Tregs before, during and after chemotherapy.
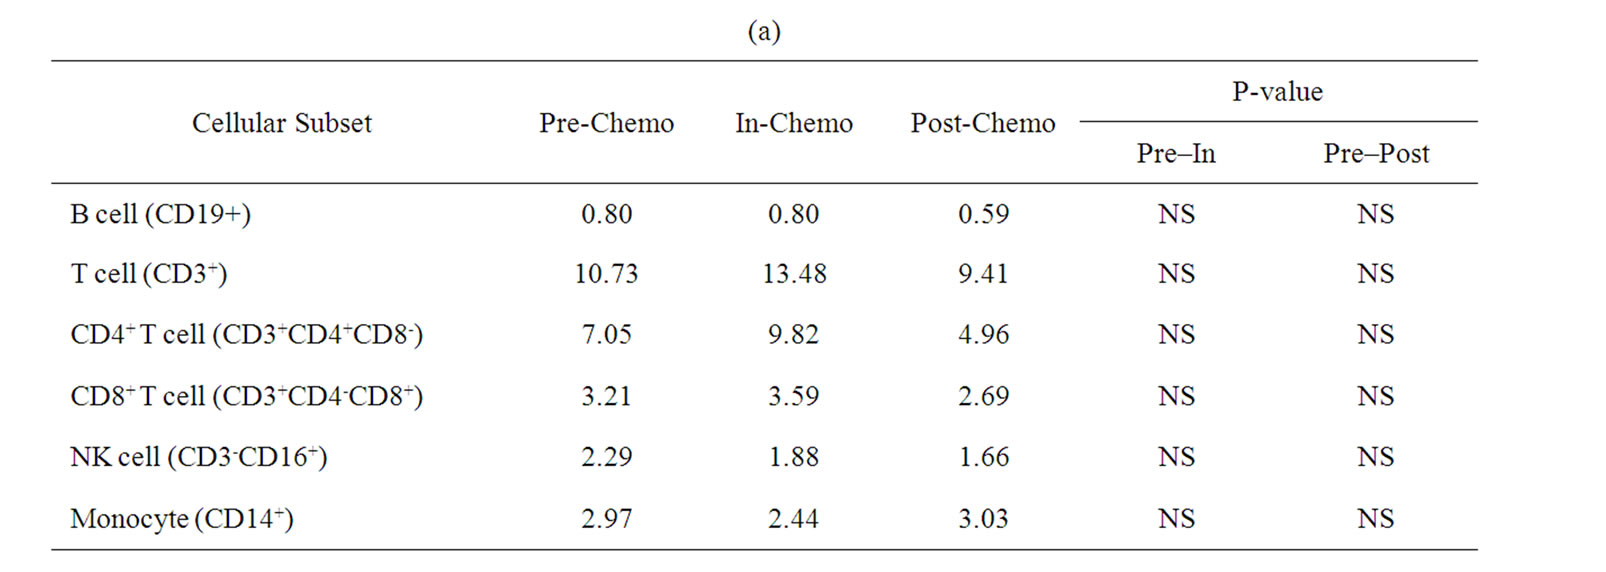
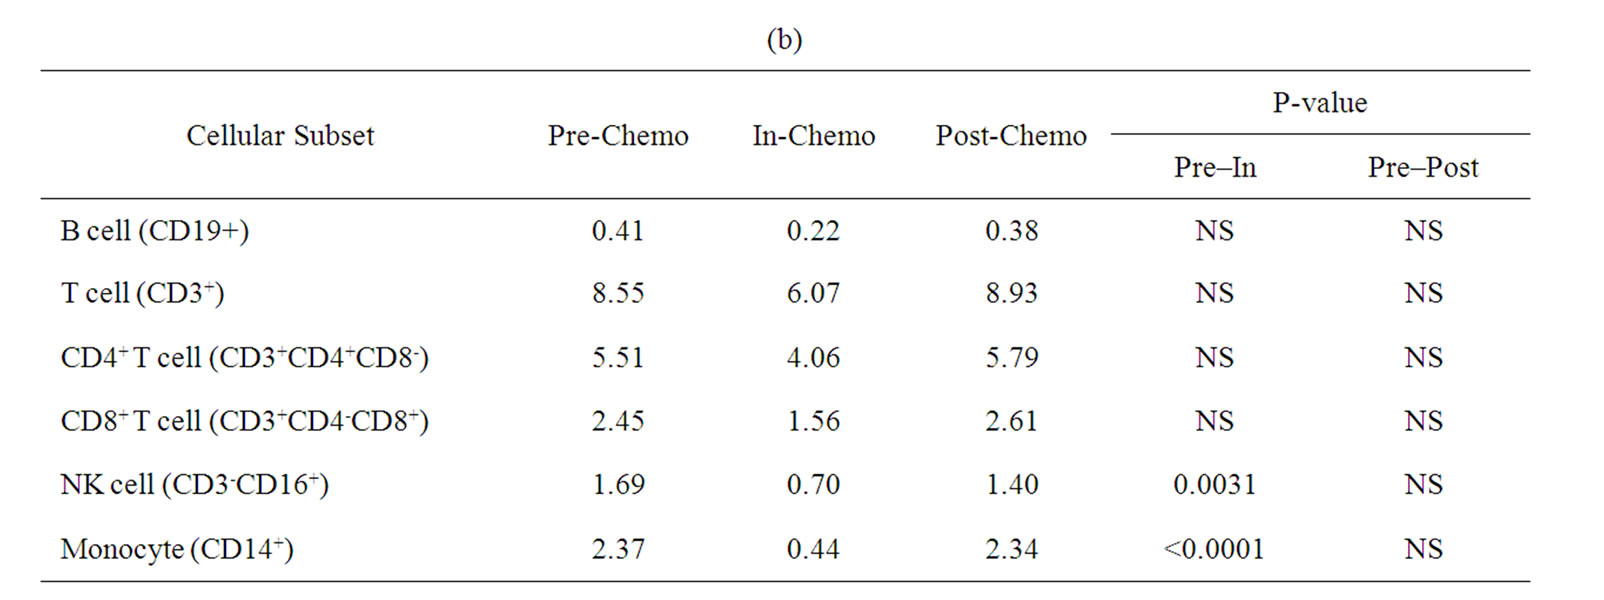
Table 2. Mean numbers of B, T, Natural killer (NK) cells and monocytes (108/L) in frozen PBMCs prepared from peripheral blood collected from. (a) TV-OxMdG patients (n = 5) and (b) TV-IrMdG patients (n = 7). P values are only stated if significant (P < 0.05).
expression (data not shown). Due to restricted availability of PBMCs we were unable to confirm suppressive activity in vitro.
Differences in the ratios of cellular subsets between the two trials were determined by using the Student’s T-test (Table 3). The most striking differences between the two chemotherapeutic regimens were changes in monocyte and, to a lesser extent, NK cell levels which were significantly lower in patients treated with IrMdG (p = 0.0002 and p = 0.0322 respectively) compared to patients receiving OxMdG. The proportion of Tregs within the CD4+ population was significantly higher (p = 0.0361) prior to chemotherapy in the TV-OxMdG patients compared to that of the TV-IrMdG patients, but not during chemotherapy or following the completion of chemotherapy. No other significant differences between any other cellular subset studied at any stage of the trial was observed between the patients on the two different chemotherapy regimens that were analyzed.
Exploratory analyses were undertaken to investigate potential relationships between the level of Tregs detected in the periphery and antigen-specific cellular responses. In particular, we looked for associations between mean Treg levels detected during the time period in which chemotherapy was administered and proliferative responses against 5T4, MVA and TT at weeks 19 (during chemotherapy) and X + 2 (the first sampling time point following completion of chemotherapy). A significant correlation was seen between Treg levels detected during chemotherapy and the magnitude of 5T4-specific proliferative responses at both weeks 19 and X + 2 (Table 4), although the direction of the correlation differed. Surprisingly, there was a statistically significant (P = 0.01) positive correlation between the magnitude of Tregs detected during chemotherapy and 5T4 proliferative responses at week 19. However, at the next analysis time point, which was following the completion of chemotherapy (week X + 2), the correlation was also statistically significant (P = 0.04), but negative. The strong correlations persisted even when the analysis was performed within each individual trial dataset (data not shown). Although the change in direction of the correlation was also seen for MVA and TT, these were not statistically significant.
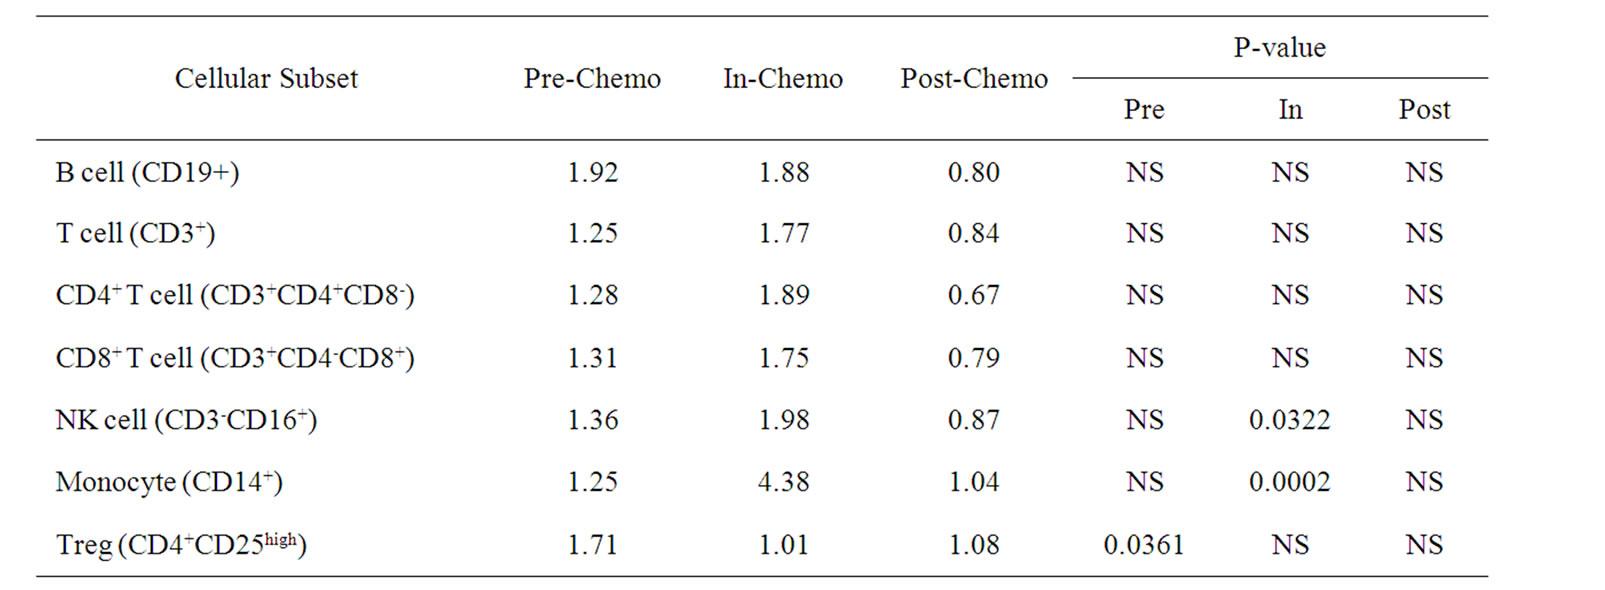
Table 3. Ratio of mean numbers of B, T, Natural killer (NK) cells and monocytes (108/L) in frozen PBMCs prepared from peripheral blood collected from TV-OxMdG patients (n = 5) compared to TV-IrMdG patients (n = 7) during different stages of the trial. P values (T-test) are only stated if significant (P < 0.05).
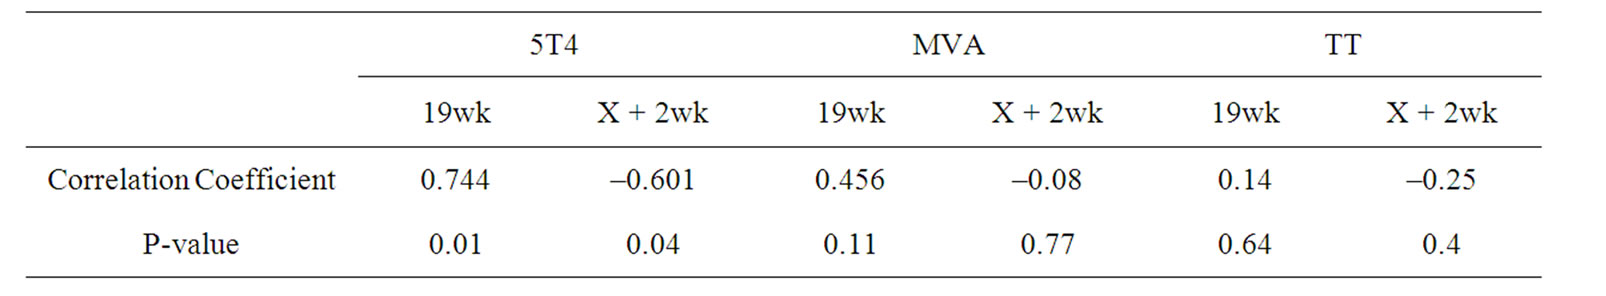
Table 4. Correlation between Treg levels during chemotherapy and antigen-specific proliferative responses detected during (19wk) and immediately following chemotherapy (X + 2wk).
4. Discussion
Relatively few studies have tested the combination of chemotherapy with a therapeutic cancer vaccine [12] and we are not aware of any that have analyzed immune responses induced by vaccinations given before, during and after chemotherapy, alongside phenotyping of lymphocyte subsets. Our studies demonstrated that the administration of MVA-5T4 in combination with IrMdG and OxMdG chemotherapy regimens was well tolerated and induced 5T4-specific immune responses in the majority of patients. Furthermore, changes were detected in certain lymphocyte subsets during and after chemotherapy which appeared to impact on the immune responses generated during the course of each trial.
The kinetics of both 5T4 and MVA antibody titers showed similar patterns throughout the monitoring time course between the two trials, although titers were generally lower in the TV-IrMdG trial compared to the TV-OxMdG trial, especially during the period that chemotherapy was administered. Given that the vaccination regimen used was identical for both studies, it is unclear why a difference in antibody responses was observed; however, a disparity in the numbers of B cells may provide one potential explanation. Prior to treatment, B cell numbers were lower in patients enrolled on the TVIrMdG trial compared to those on the TV-OxMdG trial, which could result in a decreased capacity to mount antibody responses. Another potential explanation for the lower antibody responses detected in the TV-IrMdG trial could be reduced availability of antigen presenting cells (APCs). As APCs are critical for the generation of potent immune responses, we examined the numbers of monocytes in PBMCs since these are the precursors of myeloid antigen presenting cells, differentiating into macrophages and dendritic cells. While no changes were observed in the mean number of monocytes in patients treated with OxMdG, a significant reduction (p < 0.0001) was seen during IrMdG chemotherapy. The size of the reservoir of available antigen presenting cells may be important for the generation of 5T4-specifc responses and could potentially explain the lower 5T4 and MVA antibody titers detected during treatment with IrMdG.
We have shown that the absolute numbers of B cells and T cells (CD4+ and CD8+ T cells) did not change during either chemotherapy regimen, but a significant decrease in the proportion of CD4+CD25high T regulatory cells within the CD4+ T cell population was observed. There is growing evidence to suggest that increases in the frequency of Tregs may be responsible for inhibiting host T cell responsiveness against tumor associated antigens [13]. Therefore, depletion of this suppressive T cell population may be beneficial for cancer vaccine approaches. If standard chemotherapy regimens have a transient effect on the proportion of this cellular sub-set, a better understanding of the kinetics may help to inform the optimal time to administer an immunotherapy product such as a cancer vaccine.
In both trials, the most dramatic increase in 5T4-specific proliferative responses occurred between weeks 19 (during chemotherapy) and X + 2 (the time point immediately following chemotherapy). In contrast, proliferative responses specific for the foreign antigens MVA and TT showed no significant change during the same time period. This observation was particularly surprising since no vaccinations occurred between these two time points; the obvious differences were the absence of chemotherapy at the later time point and the fact that patients had received 4 more cycles of chemotherapy. It was also interesting to note that the proportion of CD4+CD25high Tregs in the CD4+ T cell population decreased significantly during the period that patients received chemotherapy. Due to the limitations on cell numbers, we were not able to demonstrate that the Tregs measured in this study were suppressive in functional assays. However, it is tempting to speculate that the induction and expansion of 5T4-specific immune responses prior to chemotherapy was suppressed by the presence of high levels of Tregs and that during chemotherapy responses were constrained by the presence of a cytotoxic agent. Previous studies have demonstrated that the depletion of Tregs in vitro has unmasked CD4+ T cell responses specific for 5T4 in PBMCs from colorectal cancer patients [14] and from healthy individuals [15]. Furthermore, adoptive transfer of Treg depleted autologous T cells in renal cancer patients following conditioning chemotherapy resulted in enhanced immune responses to 5T4 [16]. Consistent with these observations, we detected a significant inverse correlation between the proportion of Tregs detected during chemotherapy and the 5T4-specific proliferative response measured immediately following completion of chemotherapy. However, what was not predicted was the detection of a positive correlation between the proportion of Tregs detected during chemotherapy and 5T4-specific proliferative responses during chemotherapy (week 19). An explanation for this observation is not immediately obvious, although recent reports suggest that the Treg cells can display diversity and plasticity, particularly in response to changes in their microenvironment such as lymphopenic and/or inflammatory conditions. Indeed, Tregs have been shown to help in the development of memory responses, promote the migration of effector T cells to the site of antigen exposure, and even function as effector cells [17-19]. Furthermore, several publications have reported that Tregs are associated with either a positive or a negative prognosis in patients with colon cancer [20,21]. No significant correlations were detected between Treg levels and either MVA or TT-specific responses, potentially suggesting a differential impact of the IrMdG and OxMdG chemotherapy regimens on auto-reactive Tregs. Although speculation, it is possible that the positive correlation between Treg levels and 5T4 proliferative responses during chemotherapy may be a function of two factors: (a) high Treg levels are also indicative of the presence of a strong autoreactive immune response and (b) chemotherapy acting on Tregs in a manner which interferes with their ability to suppress responses. Upon completion of chemotherapy, the Tregs are then able to resume their suppressive function, hence the negative correlation between Tregs and 5T4 proliferative responses post-chemotherapy.
Other chemotherapy regimens have been shown to have an impact on regulatory T cells. In particular, it has been shown that cyclophosphamide not only reduces Treg numbers, but also inhibits their suppressive capacity by increasing their apoptosis, decreasing their homeostatic proliferation [22], and down-regulating expression of two Treg-associated proteins GITR and FoxP3 [22]. A number of other chemotherapies have also been shown to modulate Tregs, including temozolomide [23], and GOLF (gemcitabine [GEM], oxaliplatin, LF and FU; [24]). How the two chemotherapy regimens used in this study orchestrate their effects on various cell types remains uncertain. While both caused a reduction in the mean numbers of neutrophils and Tregs, only IrMdG caused a reduction in monocytes and NK cells, suggesting a difference in their modes of action on specific cellular subsets.
Although modulation of the suppressive activities of Tregs can enhance tumor immune responses, complete absence of Tregs is not sufficient to treat established tumors expressing self antigens [25,26]. This suggests that in order to promote tumor regression, vaccination against a tumor antigen is needed to induce an efficacious immune response. Further, to optimize the generation of antigen-specific effector cells, vaccination should be timed to coincide with periods when Treg levels and/or their suppressive activity are known to be low.
Critical to the design of efficacious tumor vaccines, is achieving the optimal balance between both regulatory and effector T cell functions that results in the induction and maintenance of responses against tumor antigen(s). The careful timing of administration of both cytotoxic chemotherapy and immunotherapy agents may well be crucial to the success of such combined therapeutic approaches [27-29]. It could be possible to further optimize the timing of vaccination during the period that a patient receives chemotherapy through a more exquisite analysis of Treg numbers after each chemotherapy cycle. In summary, we have demonstrated that combining OxMdG or IrMdG with immunotherapy is possible and, if timed correctly, may decrease some of the immuno-suppressive signals resulting in more potent immune responses.
REFERENCES
- R. A. Lake and B. W. Robinson, “Immunotherapy and Chemotherapy - A Practical Partnership,” Nature Reviews Cancer, Vol. 5, No. 5, 2005, pp. 397-405.
- M. Rescigno, F. Avogadri and G. Curigliano, “Challenges and Prospects of Immunotherapy as Cancer Treatment,” Biochimica et Biophysica Acta, Vol. 1776, No. 1, 2007, pp. 108-123.
- T. Starzynska, P. J. Marsh, P. F. Schofield, S. A. Roberts, K. A. Myers and P. L. Stern, “Prognostic Significance of 5T4 Oncofetal Antigen Expression in Colorectal Carcinoma,” British Journal of Cancer, Vol. 69, No. 5, 1994, pp. 899-902.
- T. Starzynska, V. Rahi and P. L. Stern, “The Expression of 5T4 Antigen in Colorectal and Gastric Carcinoma,” British Journal of Cancer, Vol. 66, No. 5, 1992, pp. 867-869.
- E. Wrigley, A. T. McGown, J. Rennison, R. Swindell, D. Crowther, T. Starzynska and P. L. Stern, “5T4 Oncofetal Antigen Expression in Ovarian Carcinoma,” International Journal of Gynecological Cancer, Vol. 5, No. 4, 1995, pp. 269-274.
- J. P. Kuebler and A. de Gramont, “Recent Experience with Oxaliplatin or Irinotecan Combined with 5-Fluorouracil and Leucovorin in the Treatment of Colorectal Cancer,” Seminars in Oncology, Vol. 30, No. 4, 2003, pp. 40-46.
- R. Harrop, N. Drury, W. Shingler, P. Chikoti, I. Redchenko, M. W. Carroll, S. M. Kingsman, S. Naylor, A. Melcher, J. Nicholls, H. Wassan, N. Habib and A. Anthoney, “Vaccination of Colorectal Cancer Patients with Modified Vaccinia Ankara Encoding the Tumor Antigen 5T4 (TroVax) Given alongside Chemotherapy Induces Potent Immune Responses,” Clinical Cancer Research, Vol. 13, No. 15, 2007, pp. 4487-4494.
- R. Harrop, N. Drury, W. Shingler, P. Chikoti, I. Redchenko, M. W. Carroll, S. M. Kingsman, S. Naylor, R. Griffiths, N. Steven and R. E. Hawkins, “Vaccination of Colorectal Cancer Patients with TroVax Given Alongside Chemotherapy (5-Fluorouracil, Leukovorin and Irinotecan) is Safe and Induces Potent Immune Responses,” Cancer Immunology, Immunotherapy, Vol. 57, No. 7, 2008, pp. 977-986.
- J. P. Braybrooke, A. Slade, G. Deplanque, R. Harrop, S. Madhusudan, M. D. Forster, R. Gibson, A. Makris, D. C. Talbot, J. Steiner, L. White, O. Kan, S. Naylor, M. W. Carroll, S. M. Kingsman and A. L. Harris, “Phase I Study of MetXia-P450 Gene Therapy and Oral Cyclophosphamide for Patients with Advanced Breast Cancer or Melanoma,” Clinical Cancer Research, Vol. 11, No. 4, 2005, pp. 1512-1520.
- R. Harrop, M. G. Ryan, H. Golding, I. Redchenko and M. W. Carroll, “Monitoring of Human Immunological Responses to Vaccinia Virus,” Methods in Molecular Biology, Vol. 269, 2004, pp. 243-466.
- C. Baecher-Allan, J. A. Brown, G. J. Freeman and D. A. Hafler, “CD4+CD25high Regulatory Cells in Human Peripheral Blood,” Journal of Immunology, Vol. 167, No. 3, 2001, pp. 1245-1253.
- A. K. Nowak, R. A. Lake and B. W. Robinson, “Combined Chemoimmunotherapy of Solid Tumours: Improving Vaccines?” Advanced Drug Delivery Reviews, Vol. 58, No. 8, 2006, pp. 975-990.
- E. Elkord, E. M. Alcantar-Orozco, S. J. Dovedi, D. Q. Tran, R. E. Hawkins and D. E. Gilham, “T Regulatory Cells in Cancer: Recent Advances and Therapeutic Potential,” Expert Opinion on Biology Therapy, Vol. 10, No. 11, 2010, pp. 1573-1586.
- S. L. Clarke, G. J. Betts, A. Plant, K. L. Wright, T. M. El-Shanawany, R. Harrop, J. Torkington, B. I. Rees, G. T. Williams, A. M. Gallimore and A. J. Godkin, “CD4 + CD25 + FOXP3 + Regulatory T Cells Suppress Anti-Tumor Immune Responses in Patients with Colorectal Cancer,” PLoS ONE, Vol. 1, No. 1, 2006, p. e129. doi:10.1371/journal.pone.0000129
- E. Elkord, A. Dangoor, D. J. Burt, T. D. Southgate, S. Daayana, R. Harrop, J. W. Drijfhout, D. Sherlock, R. E. Hawkins and P. L. Stern, “Immune Evasion Mechanisms in Colorectal Cancer Liver Metastasis Patients Vaccinated with TroVax (MVA-5T4),” Cancer Immunology, Immunotherapy, Vol. 58, No. 10, 2009, pp. 1657-1667.
- F. C. Thistlethwaite, E. Elkord, R. W. Griffiths, D. J. Burt, A. M. Shablak, J. D. Campbell, D. E. Gilham, E. B. Austin, P. L. Stern and R. E. Hawkins, “Adoptive Transfer of T(reg) Depleted Autologous T Cells in Advanced Renal Cell Carcinoma,” Cancer Immunology, Immunotherapy, Vol. 57, No. 5, 2008, pp. 623-634.
- M. Murai, P. Krause, H. Cheroutre and M. Kronenberg, “Regulatory T-Cell Stability and Plasticity in Mucosal and Systemic Immune Systems,” Mucosal Immunology, Vol. 3, No. 5, 2010, pp. 443-449.
- X. Zhou, S. L. Bailey-Bucktrout, L. T. Jeker, C. Penaranda, M. Martinez-Llordella, M. Ashby, M. Nakayama, W. Rosenthal and J. A. Bluestone, “Instability of the Transcription Factor Foxp3 Leads to the Generation of Pathogenic Memory T Cells in Vivo,” Nature Immunology, Vol. 10, No. 9, 2009, pp. 1000-1007.
- S. Vendetti, T. S. Davidson, F. Veglia, A. Riccomi, D. R. Negri, R. Lindstedt, P. Pasquali, E. M. Shevach and M. T. De Magistris, “Polyclonal Treg Cells Enhance the Activity of a Mucosal Adjuvant,” Immunology and Cell Biology, Vol. 88, No. 7, 2010, pp. 698-706.
- P. Correale, M. S. Rotundo, M. T. Del Vecchio, C. Remondo, C. Migali, C. Ginanneschi, K. Y. Tsang, A. Licchetta, S. Mannucci, L. Loiacono, P. Tassone, G. Francini and P. Tagliaferri, “Regulatory (FoxP3+) T-Cell Tumor Infiltration is a Favorable Prognostic Factor in Advanced Colon Cancer Patients Undergoing Chemo or Chemoimmunotherapy,” Journal of Immunotherapy, Vol. 33, No. 4, 2010, pp. 435-441.
- F. A. Sinicrope, R. L. Rego, S. M. Ansell, K. L. Knutson, N. R. Foster and D. J. Sargent, “Intraepithelial Effector (CD3+)/Regulatory (FoxP3+) T-Cell Ratio Predicts a Clinical Outcome of Human Colon Carcinoma,” Gastroenterology, Vol. 137, No. 4, 2009, pp. 1270-1279.
- M. E. Lutsiak, R. T. Semnani, R. De Pascalis, S. V. Kashmiri, J. Schlom and H. Sabzevari, “Inhibition of CD4(+)25+ T Regulatory Cell Function Implicated in Enhanced Immune Response by Low-dose Cyclophosphamide,” Blood, Vol. 105, No. 7, 2005, pp. 2862-2868.
- Y. B. Su, S. Sohn, S. E. Krown, P. O. Livingston, J. D. Wolchok, C. Quinn, L. Williams, T. Foster, K. A. Sepkowitz and P. B. Chapman, “Selective CD4+ Lymphopenia in Melanoma Patients Treated with Temozolomide: A Toxicity with Therapeutic Implications,” Journal of Clinical Oncology, Vol. 22, No. 4, 2004, pp. 610-616.
- P. Correale, M. G. Cusi, K. Y. Tsang, M. T. Del Vecchio, S. Marsili, M. L. Placa, C. Intrivici, A. Aquino, L. Micheli, C. Nencini, F. Ferrari, G. Giorgi, E. Bonmassar and G. Francini, “Chemo-Immunotherapy of Metastatic Colorectal Carcinoma with Gemcitabine plus FOLFOX 4 Followed by Subcutaneous Granulocyte Macrophage Colony-Stimulating Factor and Interleukin-2 Induces Strong Immunologic and Antitumor Activity in Metastatic Colon Cancer Patients,” Journal of Clinical Oncology, Vol. 23, No. 35, 2005, pp. 8950-8958.
- P. A. Antony, C. A. Piccirillo, A. Akpinarli, S. E. Finkelstein, P. J. Speiss, D. R. Surman, D. C. Palmer, C. C. Chan, C. A. Klebanoff, W. W. Overwijk, S. A. Rosenberg and N. P. Restifo, “CD8+ T Cell Immunity against a Tumor/Self-Antigen is Augmented by CD4+ T Helper Cells and Hindered by Naturally Occurring T Regulatory Cells,” Journal of Immunology, Vol. 174, No. 5, 2005, pp. 2591-2601.
- P. A. Antony and N. P. Restifo, “Do CD4+ CD25+ Immunoregulatory T Cells Hinder Tumor Immunotherapy?” Journal of Immunology, Vol. 25, No. 3, 2002, pp. 202- 206.
- J. F. Curtin, M. Candolfi, T. M. Fakhouri, C. Liu, A. Alden, M. Edwards, P. R. Lowenstein and M. G. Castro, “Treg Depletion Inhibits Efficacy of Cancer Immunotherapy: Implications for Clinical Trials,” PLoS One, Vol. 3, No. 4, 2008, p. e1983.
- L. G. de Pillis, W. Gu and A. E. Radunskaya, “Mixed Immunotherapy and Chemotherapy of Tumors: Modeling, Applications and Biological Interpretations,” Journal of Theoretical Biology, Vol. 238, No. 4, 2006, pp. 841-862.
- Y. J. Ko and M. B. Atkins, “Chemotherapies and Immunotherapies for Metastatic Kidney Cancer,” Current Urology Reports, Vol. 6, No. 1, 2005, pp. 35-42.