Journal of Cancer Therapy
Vol.1 No.1(2010), Article ID:1433,7 pages DOI:doi:10.4236/jct.2010.11006
Sum-Based Meta-Analytical Enrichment of Gene Expression Data to Identify Pathway Signatures of Cancers
![]()
1Interdisciplinary School of Scientific Computing, University of Pune, Pune, India; 2Advanced Centre for Treatment, Research and Education in Cancer, Navi Mumbai, India; 3Centre for Advanced Computing, University of Pune campus, Pune, India; *Current Address: Michigan Center for Translational Pathology, Department of Pathology, University of Michigan Ann Arbor, MI, USA; §Corresponding authors
Email: kavi@issc.unipune.ernet.in, vprasanna@actrec.gov.in, vsundar@cdac.in, chakumar@med.umich.edu
Received November 13th, 2009; revised January 26th, 2010; accepted January 31st, 2010.
Keywords: Gene Expression, Microarray, Enrichment, Meta-Analysis
ABSTRACT
A new method for analysis of microarray gene expression experiments referred to as Sum-based Meta-analytical Enrichment (SME) is proposed in this manuscript. SME is a combined enrichment and meta-analytical approach to infer on the association of gene sets with particular phenotypes. SME allows enrichment to be performed across datasets, which to our knowledge was not earlier possible. As a proof of concept study, this technique is applied to datasets from Oncomine, a publicly available cancer microarray database. The genes that are significantly up-/down-regulated (p-value ≤ 10-4) in various cancer types in Oncomine were listed. These genes were assigned to biological processes using GO annotations. The SME algorithm was applied to identify a list of GO processes most deregulated in 4 major cancer types. For validation we examined whether the processes predicted by SME were already documented in literature. SME method identified several known processes for the 4 cancer types and identified several novel processes which are biologically plausible. Nearly all the pathways identified by SME as common to the 4 cancers were found to contribute to processes which are widely regarded as cancer hallmarks. SME provides an intuitive yet objective ‘process-centric’ interpretation of the ‘gene-centric’ output of individual microarray comparison studies. The methods described here should be applicable in the next-generation sequencing based gene expression analysis as well.
1. Introduction
Microarray based gene expression profiling studies have led to the identification of hundreds of genes differentially expressed across diverse sample sets which has resulted in the characterization of several biomarkers and genes of interest. But the bigger promise of providing an insight into underlying biological phenomena continues to be challenging.
The problem considered here is that of whole transcriptome gene expression analysis by microarrays, where genes corresponding to virtually the whole genome (25–30,000 genes) are simultaneously interrogated for their relative expression in a disease type (or subtype) and compared against their normal counterpart. For example, breast cancer transcriptome compared against normal breast transcriptome. This analysis provides a list of genes measured as either over-expressed or underexpressed in the test samples relative to normal. A variety of approaches have been developed in the last decade to identify gene expression features specific to different cancer types. Rhodes et al. [1] provide a categorization of these methods.
Statistics based differential analysis lists individual genes which are differentially expressed in a dataset of microarray experiments. Clustering [2,3] was the earliest attempt to further analyze this list by grouping genes on the basis of similarities in their differential expression. Both these methods are regarded as standard. In contrast, integrated analysis methods examine data in terms of cancer signatures from other data or other types of genomic data. These include methods for meta-analysis and functional enrichment.
Meta-analysis has been defined as analysis of multiple datasets. For instance, comparative meta-profiling [4] can be used to identify signatures of genes commonly activated across datasets.
Functional enrichment attempts to interpret the list of differential expressed genes derived from one dataset using gene annotations like biological process, molecular function and cellular localizations. These methods give a formal framework for biological interpretation which was subjective in the clustering methods. These include over-representation approach (ORA) [5], functional class scoring (FCS) [6,7] and gene set enrichment analysis [8,9].
Some of the other reported methods include those based on theory of partially ordered sets [10], random forests (LeFe) [11], non-parametric pathway based regression models, [12] and more recently, impact analysis based on systems biology approach [13].
In this paper a new method is proposed, which involves a combined enrichment and meta-analytical comparison, to infer on the association of gene sets (for example those constituting Gene Ontology, GO) with the specific phenotypes investigated in a set of microarray experiments. We refer to the method as Sum-based Meta-analytical Enrichment (SME). SME allows enrichment to be performed across datasets, which to our knowledge was not possible earlier. Our premise is that in order to implicate a ‘process’ (eg. GO Processes) in the mechanism of a pathology (eg. cancer), the various independent ‘events’ (expression changes in individual genes) constituting and/or contributing to the process serve as surrogates to studying the process itself. Greater the evidence of association of such constituent events with a pathology, greater is the confidence in the 'process-association’ hypothesis. SME is a heuristic extension of this notion. In order to calculate the significance of a gene-set phenotype association, it considers both – 1) the number of genes in the set which are differentially expressed in a microarray study, and 2) the number of studies which report each of the genes as differentially expressed. Permutation testing has been used to rule-out chance associations.
As a proof of concept, this technique was applied to a publicly available cancer-microarray database (Oncomine) to identify Gene Ontology processes dysregulated in four different cancer types and an assessment was carried to examine whether the identified associations were already reported in literature.
2. Methods
Given a collection of microarray gene-expression datasets for a phenotype, the significance of association of a query gene-set with the phenotype, is evaluated with following steps:
1) Determination of number of studies reporting differential expression of a gene
On each dataset in the collection, studies are performed for differential expression across logical groupings of samples [14] using Student’s t-test. Study specific gene p-values (or false discovery rates) [15,16] are considered to determine the number of studies which infer differential expression of a gene at a particular cut-off. The results for this step are readily available in Oncomine.
2) Calculation of Sum-based Meta-analytical Enrichment Score (S) for query gene-set
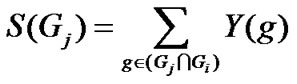
Genes common to the query gene-set and dataset collection are identified. For each of the genes in this common set, we consider the number of studies in which the gene is differentially expressed. The sum of the number of such studies for all genes in the common set gives the SME score (S) of the query gene-set.
3) Calculation of significance of the SME score
To evaluate the significance of the score, SME score for a million random gene sets, each having the same number of genes as the common set (derived in previous step) is computed. The fraction of the number of random gene-sets for which the SME score is greater than or equal to the statistic for the gene-set in question, gives the s-value for the association. The term s-value is used to differentiate it from the analogous p-value, since the distribution computed in step 2 is a surrogate for the null distribution. The null-distribution cannot be accurately determined due to dearth of information about process-phenotype associations.
2.1 Mathematical Description of SME
A) Input for the method:
Gi : set of genes in the collection of microarray datasets.
Gj : the query gene set
B) Steps:
1) Determination of number of studies reporting differential expression of a gene Let Y(g) give the total number of studies across logical groupings in individual datasets which infer that a gene g is differentially expressed on the basis of a p-value/q-value cut-off.
2) Calculation of SME score (S) for query gene-set
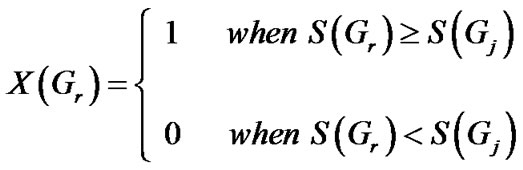
3) Determination of significance of the score
With the above formula, S (Gr) is calculated for very large number of random gene sets (Gr) from Gi, such that |Gr| = |Gj ∩ Gi |
The s-value is given by,

where for large number n of Gr
2.2 Case Study
Oncomine is a publicly available cancer microarray database [17]. The SME method was applied to datasets in Oncomine (Version 2.0) to identify Gene Ontology processes associated with and common to four major cancer types — breast cancer, prostate cancer, leukemia and lymphoma. Oncomine was queried for all the human genes (listed at NCBI) to obtain the number of studies reporting a gene as differentially expressed for a p-value cut-off of 10-4. All of the Gene Ontology biological process terms were listed from the GO database (http://www.geneontology.org) [18]. In GO database, processes are segregated as biological processes, cellular components and/or molecular functions and genes contributing to each process are annotated. For each of the GO biological processes, the contributing human genes were obtained by querying with the GO association “contributes to”. Of the 9561 GO biological processes, those which had insufficient information in oncomine were excluded. This was done by excluding processes which had less than 10 of their contributing genes listed in oncomine. Further, processes which have more than 50 genes represented in oncomine were excluded to remove highly generic processes. 323 processes remained, and the association of each process with 4 cancer types was tested. SME was applied to obtain the s-value of association of the processes with each of the 4 cancer types and the GO processes with s-value ≤ 0.01 (empirically approximated) were listed.
For example, to test the association of the GO process “insulin receptor signaling pathway” (GO: 0008286) with breast cancer, a query was performed on GO database to get all the genes annotated to this processes with the relation “contributes to”. There are 21 such genes from which information is available for 12 genes, in Oncomine. Oncomine lists the number of breast cancer studies reporting any of these genes as differentially expressed (with default p-value cut-off of 10-4), in various class comparisons. These are summed (score=12) and this score is used to calculate the s-value of association between “insulin receptor signaling pathway” and “breast cancer” by forming one million random sets of 12 genes and calculating the SME score for the random sets; the number of random gene sets with an SME score equal to or more than 12 is divided by the total number of random gene sets (one million) to get the s-value of 0.000534 (Figure 1).
For validation, an assessment was made whether the processes identified for the four major cancer types have already been reported to be associated with the particular cancer types. Further, the set of processes common to the four cancer types were analyzed.
2.3 Implementation
The algorithm was implemented on a Linux (Fedora core 6) system using Perl and MySQL database, with the permutation testing module implemented in C++. A web-based front-end for calculating significance of association of a gene-set with a particular cancer type was based on the discussed algorithm, using apache server and Support-Vector-Graphics. The tool was tested for its precision of s-value determination for a set of GO processes. As seen in Figure 2, overall the standard deviation of the s-value was less than 0.0008 and decreased towards the extremes, which ensures the accuracy of results.
3. Results and Discussion
To facilitate the assessment similar GO processes were grouped by clustering on basis of the overlap of constituent gene sets.
In case of leukemia, platelet activation, hemoglobin biosynthesis and thymic T cell activation could be readily associated with the physiology and metabolism of blood cells and lymphocytes. A leukemia-associated CD9 glycoprotein antigen is known to have groups of N-acetyl glucosamine residues, which may explain the identification of acetyl glucosamine metabolism [19].
Involvement of sphingolipid metabolism is known in hematological malignancies and sphingolipids have been investigated as mediators of apoptosis triggered in response to anti-leukemic agents [20].
As seen for leukemia, several pathway changes listed for lymhpoma are also physiologically relevant. Some of these are associated with chemokine (interleukine) and chemokine receptor genes. These chemokines and their receptors are involved in the development and differentiation of immune cells. They have also been found to be
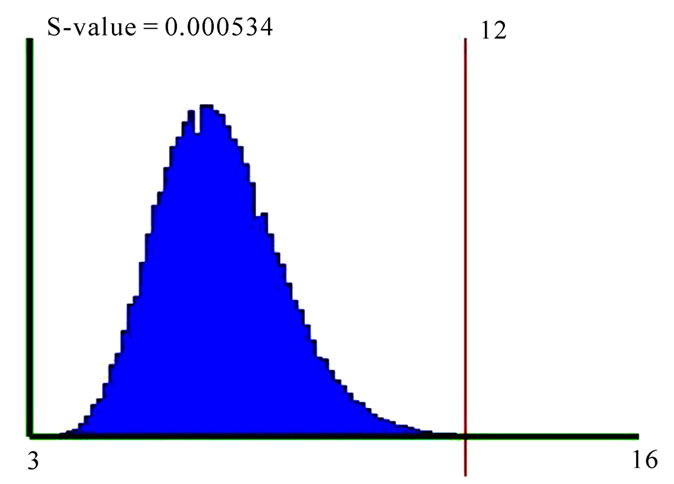
Figure 1. Significance testing
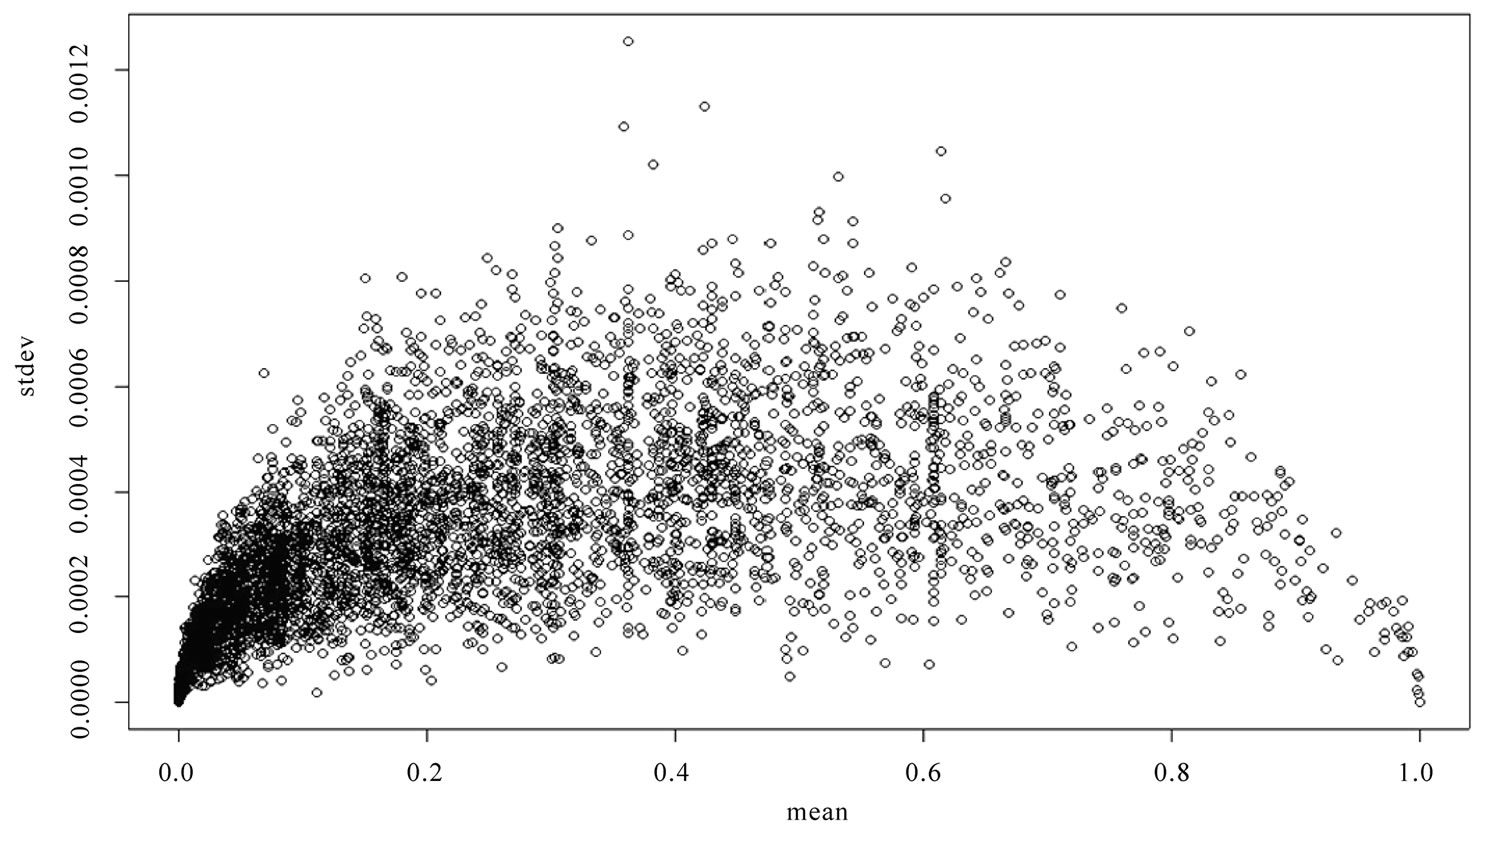
Figure 2. Plot of mean vs. standard deviation was obtained by multiple runs of the tool for a subset of GO processes from the study
present in cells from other carcinomas like those of colon. The receptors are GTP binding and specific association of these receptors with lymphoma, a result emerging from our study is noteworthy [21–24]. Matrix metalloproteinases (MMPs) have been implicated in lymphomas [25] and MMPs are known for collagenolysis [26], which is identified by SME.
In contrast to both the liquid tumors, the two major solid tumor types — breast and prostate showed diverse pathway associations. In the case of breast cancer, small GTPase Rho signaling pathways are known to regulate breast cancer cells [27]. The human epidermal growth factor receptor (HER-2) oncogene is known to encode a transmembrane tyrosine kinase receptor which increases invasiveness of breast cancer [28]. HER-2 has been targeted for therapy.
In the case of prostate cancer, androgen receptor is known to interact with an array of growth factor signal transduction events including epidermal growth factor and vascular endothelial growth factor [29]. Pathways that involve smooth muscle contraction and sugar transport have been shortlisted. These processes are vital to the normal functions associated with the prostate gland. The dominant association of matrix adhesion pathways may be due to their role in metastasis [30]. Bone and lymph node metastasis are common in prostate cancer.
The pathways common to the four cancers (see Figure 3) included NF-kappaB (nuclear factor-kappa-B) -mediated survival pathway. This is widely regarded as the mechanism by which cancer cells evade apoptosis, a process which is regarded as an hallmark of cancer [31].
Regulation (dysregulation) of mitosis which grants limitless replicative potential to cancers has been aptly identified in our analysis as well. Cell cycle check point genes maintain sensitivity to growth signals in normal cells. JAK-STAT cascade is downstream of many cytokine and growth hormone receptors. The activation of transcription factors of the STAT (signal transducer and activator of transcription) protein family by JAK (Janus activated kinase) is reported to be constitutively activated in a many types of cancers [32]. Intracellular receptor mediated signaling pathways are known to impart carcinogenic attribute of self sufficiency of growth signals. Regulation of the actin cytoskeleton is critically involved in endothelial cell migration required for angiogenesis [33], which is an important hallmark of cancer. Cellular protein catabolism represents the cachexia which is seen in endstage of cancers and mediators of protein catabolism have been targeted as cure for cancer cachexia [34]. Identification of steroid hormone receptor signaling pathway conforms to the knowledge that steroid group, among all hormones is known to act as growth factor promoting an array of different cancers [35]. In summary nearly all the identified common pathways, were found to contribute to processes which are widely regarded as cancer hallmarks.
Apart from sharing some of the outcomes projected by other studies which have attempted to identify pathway changes, our analysis has several unique advantages due
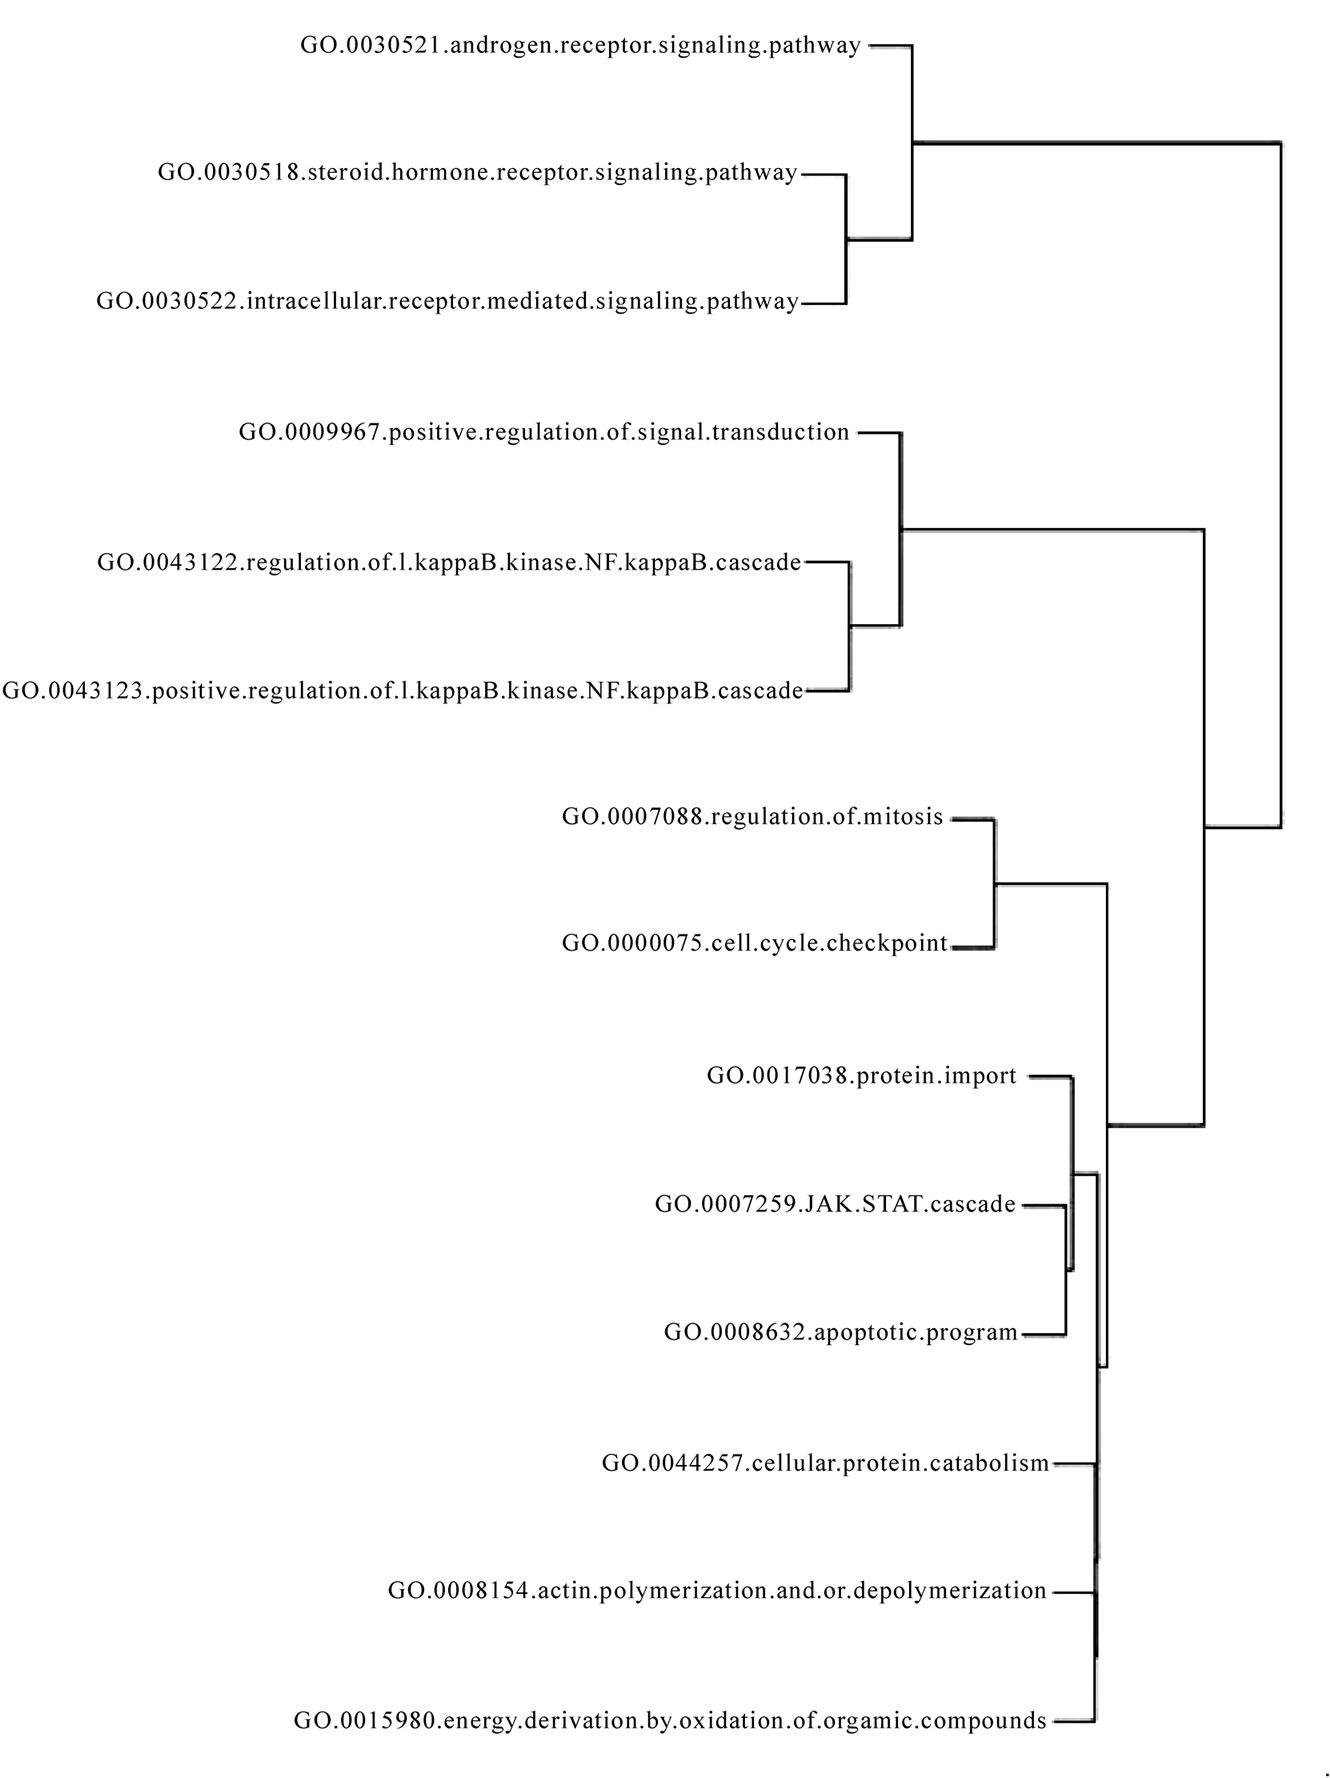
Figure 3. Pathways common to breast cancer, prostate cancer, leukemia and lymphoma
to the analytical method employed and the use of experimental sets — a) A feature of the method is the large scale combined analysis of data which intrinsically provides noise-reduction and highlights the consistent features associated with the phenotype. b) Most importantly all the data used for analysis are from human samples.
This obviates the analytical problems that are often associated with animal models.
3.1 Limitations
One limitation of SME is that extrapolation of the s-value of the intersection (of genes annotated to a GO process and present in the microarray experiments) to a GO process becomes less reliable when the gap between the intersection and the annotation widens, such as for processes higher in the GO hierarchy. This problem could be circumvented by excluding the processes which have a gap greater than an optimal cut-off. Also, the analysis could be made more stringent with a correction for multiple hypothesis testing. In the present analysis, we have avoided both the cut-off for intersection gaps and the multiple hypothesis correction; because our analysis is exploratory in nature and processes higher in the GO hierarchy at times help to establish a context for the delineated children.
4. Conclusions
SME method identified several known processes for selecting cancer types. Moreover novel processes were delineated which are biologically plausible and have potential utility. Nearly all the pathways identified by SME as common to different cancers were found to contribute to processes which are widely regarded as cancer hallmarks. With the accrual of micro-array results in repositories, expansion of GO database and further optimizations, the method can be expected to lead to increasingly accurate output. SME makes it possible to draw inferences based on a large scale combined analysis of microarray data by reducing noise and has an advantage in its intuitive yet objective approach.
5. Authors’ Contributions
KBW and CKS developed the algorithm and conceived the design of the case study.
KBW and VS formulated the algorithm and implemented the case study. They also conceived and conducted the automated evaluation.
PV and CKS assessed the utility of the method to provide biological insight into the case study.
All authors wrote the manuscript and approved it.
6. Acknowledgements
We are thankful for the developers of Gene Ontology, Oncomine, GoPubMed and NCBI for making their data/tools available for free public access. The technical assistance given by Chitra Alavani (ISSC, University of Pune) is duly acknowledged. We thank Dr. Gadre (Director, ISSC) for making computational resources available for this study.
REFERENCES
- D. R. Rhodes and A. M. Chinnaiyan, “Integrative analysis of the cancer transcriptome,” Nature Genetics, supplement Vol. 37, pp. S31–S37, 2005.
- A. A. Alizadeh, et al., “Distinct types of diffuse large B-cell lymphoma identified by gene expression profiling,” Nature, Vol. 403, No. 6769, pp. 503–511, 2000.
- L. J. van 't Veer, et al., “Gene expression profiling predicts clinical outcome of breast cancer,” Nature, Vol. 415, No. 6871, pp. 530–536, 2002.
- D. R. Rhodes, et al., “Large-scale meta-analysis of cancer microarray data identifies common transcriptional profiles of neoplastic transformation and progression,” Proceedings of the National Academy of Science, U S A, Vol. 101, No. 25, pp. 9309–9314, 2004.
- P. Khatri and S. Draghici, “Ontological analysis of gene expression data: Current tools, limitations, and open problems,” Bioinformatics, Vol. 21, No. 18, pp. 3587– 3595, 2005.
- J. J. Goeman, et al., “A global test for groups of genes: Testing association with a clinical outcome,” Bioinformatics, Vol. 20, No. 1, pp. 93–99, 2004.
- P. Pavlidis, et al., “Using the gene ontology for microarray data mining: a comparison of methods and application to age effects in human prefrontal cortex,” Neurochemical Research, Vol. 29, No. 6, pp. 1213–1222, 2004.
- V. K. Mootha, et al., “PGC-1alpha-responsive genes involved in oxidative phosphorylation are coordinately down regulated in human diabetes,” Nature Genetics, Vol. 34, No. 3, pp. 267–273, 2003.
- A. Subramanian, et al., “From the Cover: Gene set enrichment analysis: A knowledge-based approach for interpreting genome-wide expression profiles,” Proceedings of the National Academy of Science, U S A, Vol. 102, No. 43, pp. 15545–15550, 2005.
- R. Barriot, D. J. Sherman, and I. Dutour, “How to decide which are the most pertinent overly-represented features during gene set enrichment analysis,” BMC Bioinformatics, Vol. 8, pp. 332, 2007.
- G. S. Eichler, et al., “The LeFE algorithm: Embracing the complexity of gene expression in the interpretation of microarray data,” Genome Biology, Vol. 8, No. 9, pp. R187, 2007.
- Z. Wei and H. Li, “Nonparametric pathway-based regression models for analysis of genomic data,” Biostatistics, Vol. 8, No. 2, pp. 265-284, 2007.
- S. Draghici, et al., “A systems biology approach for pathway level analysis,” Genome Research, Vol. 17, No. 10, pp. 1537–1545, 2007.
- D. R. Rhodes, et al., “Oncomine 3.0: genes, pathways, and networks in a collection of 18,000 cancer gene expression profiles,” Neoplasia, Vol. 9, No. 2, pp. 166–180, 2007.
- J. Quackenbush, “Computational analysis of microarray data,” Nature Reviews Genetics, Vol. 2, No. 6, pp. 418– 427, 2001.
- D. Stekel, Microarray Bioinforamtics, Cambridge University Press, Cambridge, 2003.
- Oncomine, Available from: http://www.oncomine.org. 2007.
- M. A. Harris, et al., “The Gene Ontology database and informatics resource,” Nucleic Acids Research, Vol. 32 (Database issue), pp. D258–D261, 2004.
- Y. Komada and M. Sakurai, “Shedding of CD9 antigen in acute lymphoblastic leukemia,” Leukemia and Lymphoma, Vol. 12, No. 5-6, pp. 365–372, 1994.
- C. Ricci, F. Onida, and R. Ghidoni, “Sphingolipid players in the leukemia arena,” Biochimica et Biophysica Acta, Vol. 1758, No. 12, pp. 2121–2132, 2006.
- R. Huang, A. Wallqvist, and D. G. Covell, “Targeting changes in cancer: Assessing pathway stability by comparing pathway gene expression coherence levels in tumor and normal tissues,” Molecular Cancer Therapeutics, Vol. 5, No. 9, pp. 2417–2427, 2006.
- H. Kulbe, et al., “The chemokine network in cancer--much more than directing cell movement,” International Journal of Developmental Biology, Vol. 48, No. 5-6, pp. 489–496, 2004.
- J. Meijer, et al., “The CXCR5 chemokine receptor is expressed by carcinoma cells and promotes growth of colon carcinoma in the liver,” Cancer Research, Vol. 66, No. 19, pp. 9576–9582, 2006.
- G. Opdenakker and J. Van Damme, “The countercurrent principle in invasion and metastasis of cancer cells. Recent insights on the roles of chemokines,” International Journal of Developmental Biology, Vol. 48, No. 5-6, pp. 519–527, 2004.
- J. L. Lauer-Fields, D. Juska, and G. B. Fields, “Matrix metalloproteinases and collagen catabolism,” Biopolymers, Vol. 66, No. 1, pp. 19–32, 2002.
- A. E. Kossakowska, S. J. Urbanski, and A. JanowskaWieczorek, “Matrix metalloproteinases and their tissue inhibitors-expression, role and regulation in human malignant non-Hodgkin's lymphomas,” Leukemia and Lymphoma, Vol. 39, No. 5–6, pp. 485–493, 2000.
- Y. Tang, et al., “Role of Rho GTPases in breast cancer,” Frontiers in Bioscience, Vol. 13, pp. 759–776, 2008.
- J. S. Ross, et al., “The HER-2 receptor and breast cancer: Ten years of targeted anti-HER-2 therapy and personalized medicine,” Oncologist, Vol. 14, No. 4, pp. 320–368, 2009.
- M. L. Zhu and N. Kyprianou, “Androgen receptor and growth factor signaling cross-talk in prostate cancer cells,” Endocrine-Related Cancer, Vol. 15, No. 4, pp. 841 –849, 2008.
- S. Varambally, et al., “Integrative genomic and proteomic analysis of prostate cancer reveals signatures of metastatic progression,” Cancer Cell, Vol. 8, No. 5, pp. 393– 406, 2005.
- D. Hanahan and R. A. Weinberg, “The hallmarks of cancer,” Cell, Vol. 100, No. 1, pp. 57–70, 2000.
- A. C. Pfeifer, J. Timmer and U. Klingmuller, “Systems biology of JAK/STAT signaling,” Essays in Biochemistry, Vol. 45, pp. 109–120, 2008.
- J. T. Durham and I. M. Herman, “Systems biology of JAK/STAT signalling: Inhibition of angiogenesis in vitro: a central role for beta-actin dependent cytoskeletal remodeling,” Microvascular Research, Vol. 45, No. 3, pp. 109–120, 2008.
- J. M. Argilés, et al., “Catabolic mediators as targets for cancer cachexia,” Drug Discovery Today, Vol. 8, No. 18, pp. 838–844. 2003.
- S. Cheng and S. Balk, Steroid Hormone Receptor Signaling in Cancer.