Intelligent Information Management
Vol.6 No.3(2014), Article ID:46065,13 pages DOI:10.4236/iim.2014.63014
Evolutionary Approach to Forex Expert Advisor Generation
Alaa Eldin M. Ibrahim
University of Sharjah, Sharjah, UAE
Email: aitrade2010@yahoo.com, amibrahim@sharjah.ac.ae
Copyright © 2014 by author and Scientific Research Publishing Inc.
This work is licensed under the Creative Commons Attribution International License (CC BY).
http://creativecommons.org/licenses/by/4.0/


Received 6 April 2014; revised 28 April 2014; accepted 11 May 2014
[22] GenShade’s ShaderBank Digital Collection 1999-2014, Keywords: Shaderbank Collection. www.turbosquid.com
ABSTRACT
We have developed a genetic algorithm approach for automatically generating expert advisors, computer programs that trade automatically in the financial markets. Our system, known as GenFx or Genetic Forex, evaluates evolutionarily generated expert advisors strategies using predetermined fitness functions to automatically prioritize parents for breeding. GenFx simulates several key factors in natural selection. It employs a multiple generation breeding population, a notion of gender, and the concept of aging to maintain diversity while providing many breeding opportunities to highly successful offspring. The approach is also especially efficient running in a multiple processor, multiple selection-strategy mode using multiple settings. We found out that a multi-processor gender-based running of the system outperformed all single runs of the system. This system is inspired by GenShade, a previous system that we have developed for evolutionary generating procedural textures. The methods described in this paper are not limited to the Forex market or financial problems only but are applicable to many other fields.
Keywords:Genetic Algorithms, Forex, Expert Advisors, Trading Strategy

1. Introduction
Forex is such a huge market with very high daily liquidity. Many big financial intuitions and individual traders are using automatic trading techniques to try to profit in such a very efficient market. Genetic Algorithms are suitable to deal with such complex and huge market. Genetic algorithms [1] -[5] are a family of computational models inspired by natural evolution [6] . These algorithms typically encode a potential solution to a specific problem on a simple chromosome-like data structure and apply recombination operators to produce new solutions.
A modification to this basic scheme was introduced by Syswerda [7] , whose steady-state GA reproduction approach does a continuous replacement of individuals in the current population rather than a complete replacement of the current population by a new population as in standard genetic algorithm (generational GAs).
Many researchers [8] -[10] have investigated different selection and replacement strategies in steady-state GA. The main goal is to keep the balance between selective pressure [11] and population diversity. Selective pressure gives individuals with higher fitness, a higher chance of being selected for reproduction, mutation, and survival. Without selection pressure, the search process becomes random and promising regions of the search space would not be favored over no-promising regions. Population diversity, on the other hand, is crucial to a steadystate GA’s ability to continue the rewarding exploration of the search space. If the lack of population diversity takes place too early, a premature stagnation of the search is caused. In other words, the GA should search simultaneously the best chromosomes and the ones that provide more diversity to the GA population Godart and Kruger [12] introduced parallel steady-state reproduction, running several steady-state reproduction processes concurrently. This approach allows the simultaneous use of multiple strategies.
The standard genetic algorithm approach has its limitations. First, strong offspring may dominate the population eventually resulting in stagnation. Second, even if the population does not stagnate, convergence may be slow. Recent research [13] proposes partial re-initialization of population if stagnation occurs. In our problem domain, the space of expert advisors is huge. Sampling this space using a standard genetic algorithm would require a very large population size.
There have been many approaches to using artificial intelligence in financial markets [14] . Researchers have been working on various prediction techniques such as neural networks, fuzzy logic [15] , statistical analysis [16] , and evolutionary algorithms [17] -[19] .
In thinking about the problem of automatically generating expert advisors, we wanted to be able to generate a portfolio of successful expert advisors for live forex trading. The generation method had to be reasonably fast, and robust. Resulting expert advisors need to have powerful features such as the most net profit and profit factor and minimal drawdown. In addition, they have to handle complex situations very well so that traders can use them for real life trading situations. These have been our goals in designing and implementing the GenFx (Genetic Forex).
We have favored the steady-state reproduction method to preserve successful offspring and employed the notion of gender. Our experience with the system showed that breeding one parent that is strong on Net Profit feature, for example, with another parent that is strong on Profit Factor gives high chance of having a child strong on both features and consequently, scores high on other features as well with the proper settings and enough generation numbers. We have favored the parallel steady-state reproduction method to speed up the generation process and to improve the overall system performance by allowing several processes to contribute to the evolution of the population using multiple strategies. GenFx system is inspired by our previous system Gen Shade [20] , a previous system that we have developed for evolutionary generating procedural textures [21] .
The reader is referred to the Appendix for explanation of trading terms mentioned in this study.
2. Gen Fx System Architecture
2.1. Genome Representation
We have built another system known as EATree [22] to create expert advisors. In EATree, expert advisors are created by connecting boxes together. Boxes may contain MQL functions, technical indicators, custom indicators, or values. Outputs of one box may be connected to inputs of another box to form a “tree of boxes” or in fact, directed acyclic graph of boxes. GenFx, reads expert advisors layouts created in EATree and represents them internally as directed acyclic graph of nodes, or what we call strategies. GenFxalso generates random expert advisors layouts. As shown in Figure 1, the nodes themselves are functions or indicators written in the Meta Trader expert advisor language MQL5 [23] . The system generates MQLcode from the directed acyclic graph of nodes or boxes. It handles nodes that contain indicators very carefully to ensure that generated expert advisors work well in demo or live trading.
2.2. Multiple Generation Population (MGP)
Figure 2 shows the basic GenFx generation process. In order to maintain a large and diverse population, avoid stagnation, and give ample opportunity to strong genetic material, GenFx uses a multiple-generation population of expert advisors. This architecture allows us to preserve a large set of the best scored expert advisors across a
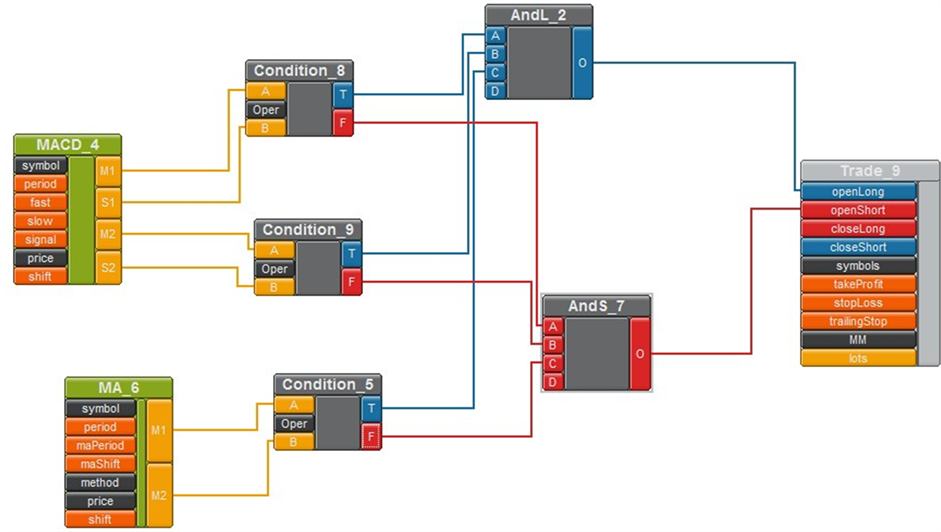
Figure 1. Genome representation.
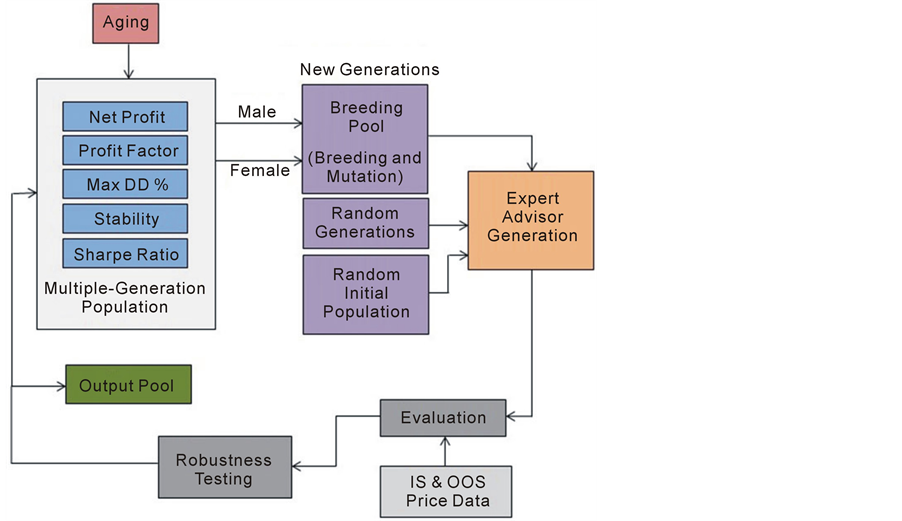
Figure 2. GenFx generation process.
range of generations, and means that we can experiment knowing that there is nothing to lose by producing a generation of “poor” expert advisors. In the worst case, the population will remain essentially as it is. Our experiments have used a maximum population size between two and three hundred. Expert advisors are inserted into the population in sorted order, with higher scored expert advisors replacing lower scored ones when the population maximum is exceeded. The multiple-generation population allows parents and children to coexist in the same population, which models an important feature of natural evolution. Initially, the system retrieves expert advisors from a predefined database of expert advisors and inserts the best scored expert advisors into these populations. Expert advisors are inserted into Net Profit, Profit Factor, Maximum Draw Down percentage, Stability and Sharpe Ratio populations based on their fitness scoring.
2.3. Output Pool
The Output Pool stores the top scored expert advisor strategies generated so far.
2.4. Aging
Aging is simulated in the multiple-generation population, to allow successful expert advisors several opportunities to produce direct offspring, while assuring that no single expert advisor continues to dominate the population forever. This provides a good balance between keeping strong genetic material in the pool and assuring diversity in the population. Each expert advisor in the population is allowed to survive intact up to a certain generation threshold. The default is ten generations. After the generation threshold is reached, an exponentially decreasing aging factor is applied to reduce an expert advisors’ score and therefore its probability of being selected for breeding and to increase its probability of being removed from the population, determines the rate of aging. The aging factor is selected so that once the generation threshold is passed; the expert advisor disappears quickly from the population, modeling another feature of natural evolution.
2.5. Gender-based Selection
“Parent” expert advisors are selected from the multiple-generation population in gender based pairs and bred to create new children for the ongoing population.
As indicated earlier, our experience with the system showed that breeding one parent that is strong on Net Profit, with another parent that is strong on Profit Factor gives high chance of having a child strong on both features and consequently, scores high on other features as well with the proper settings and enough generation numbers. In GenFx, we are aiming at strengthen five features, two at a time. It is hard to label one “male” and the other “female”, but we call this process gender-based selection.
This notion has the appeal of being similar to the notions of “male” and “female” in real populations, where some of the standards of suitability for mating are highly gender determined. The selection procedure selects pairs of expert advisors from the high net profit population for breeding with expert advisors in the profit factor population based on their rank. GenFx uses a probabilistic selection procedure based on the Gaussian distribution. There are two major selection strategies. The first is to focus on high scored expert advisors by using a small standard deviation. The second is to introduce diversity by using a high standard deviation. A selection strategy that we have found to be very useful is to alternate generations, where the first strategy is used in odd generations and the second in even ones.
2.6. Breeding
When breeding two hierarchies of expert advisors, the breeding procedure selects a random node in each hierarchy and swaps the subtrees under these nodes if the nodes are of the same data type. Figure 3 shows an example of breeding two expert advisors. Selection of a subtree to be swapped is made by first choosing a node level and then selecting a node from within that level. Selecting node level can be uniform, Gaussian with fixed mean, or Gaussian with mean based on evaluation score. In the latter, the higher the score the smaller the substructure swapped and therefore the smaller the change. This leads to narrowing the “search” process for highly successful expert advisors and broadening it for less successful ones. Once a level is chosen, the node is randomly selected from a uniform distribution.
2.7. Mutation
Mutation is used to introduce diversity into the population. After breeding, the hierarchy is traversed, and depending on a user assigned mean mutation rate, leaf node input variables are randomly selected from a uniform distribution and changed to other valid values. Similarly, a node function can mutate to another type of function, for example a MACD indicator may mutate to a Moving Average indicator, and selected subtrees may be
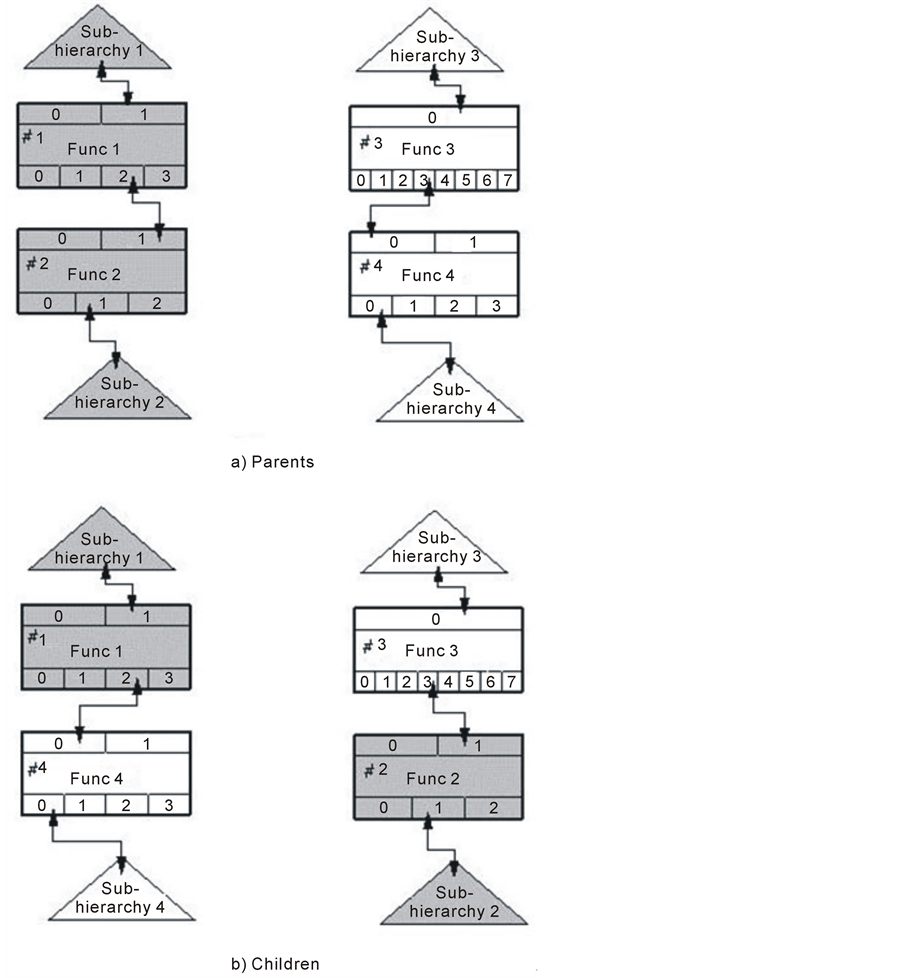
Figure 3. Breeding.
replaced by predefined nodes or subtrees from a prebuilt library.
2.8. Phenome Generation
As we consider a hierarchy of expert advisor our genome, the corresponding phenome or offspring is a MetaTrader expert advisor source code. To create an expert advisor code from a hierarchy, hierarchy nodes are traversed to create a text file formatted in the MetaTrader MQL5 language [23] . First the hierarchy is traversed to define all input variables. All unlinked input variables are output as instance variables, with predefined values. All linked variables are output as local variables. The hierarchy is then traversed again. Each linked output variable is visited and an assignment statement is output, whose left side is the name of the input variable in the parent node that the output variable is linked to, and whose right side is an expression that operates on the input variables in the current node. Variables can be of the types: integer, double, string, color, etc. The system provides conversion between types. This compiled expert advisor is then attached to a chart in MetaTrader for backtesting using historical data or for demo or live trading.
2.9. Evaluation (Fitness Function)
The system evaluates expert advisors using a fitness function. First, it calculates the performance criteria such as Net Profit, Profit Factor, and Maximum Draw Down percent, Stability and Sharpe Ratio. Then it converts the criteria into a fitness function ranging between 0 and 100 using a special formula. If needed, it combines fitness based on weights. For example, the combined fitness score of Net Profit and Profit Factor is calculated using weights of 1:1 respectively. When inserting new expert advisors into the Net Profit pool of the multiple generation population, the net profit fitness function is used, but while inserting new expert advisors into the output pool, a combined fitness function of weights of 1 of each of the five performance criteria.
2.10. Robustness Testing
Before inserting an expert advisor into multiple population generations, it has to pass robustness testing; first it has to be retested on unknown data or out of sample data to re-evaluate its performance. Second, it has to pass different robustness testing such as changing the data range, eliminating some trades, or changing a number of parameters.
2.11. Multiple Processor Algorithm Extension
Because of its organization, it is easy to configure GenFx to run in a multiple process mode, where each process contributes to the evolution of the multiple-generation population. Besides increasing speed, this has the advantage that each process may use different generation parameters and selection strategies. Figure 4 shows GenFx running in multiple processes mode, with all processes updating the common multiple-generation population. Reproduction takes place in parallel, which models another feature of natural evolution. We have implemented this in communicating parallel processors sharing a common data store.
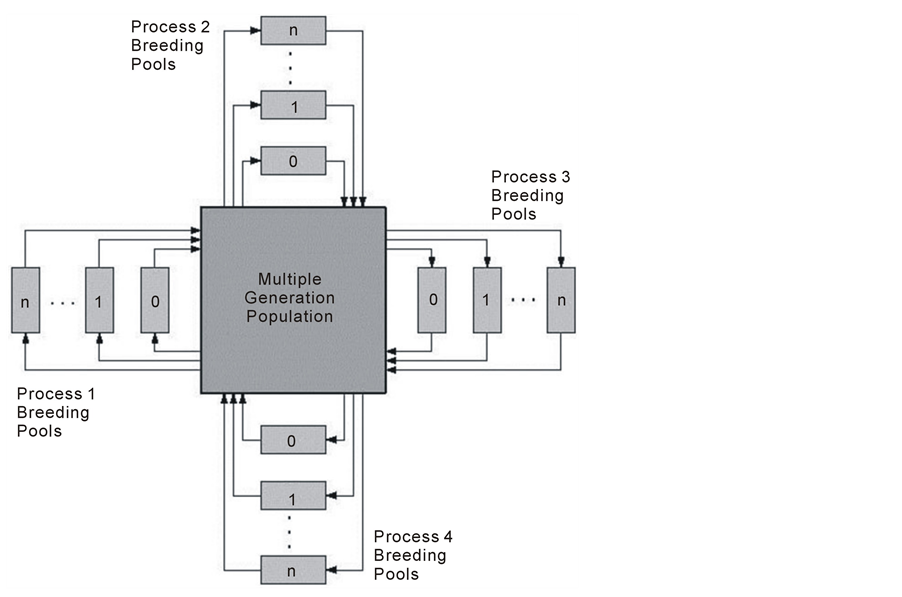
Figure 4. Multiple processes mode.
3. Experimental Results
In order to demonstrate the performance of GenFx features, several experiments were conducted. The same generation parameters were used in all of the experiments. However, in each successive experiment, an additional extension to the selection and breeding algorithms was used. Each experiment was run for 200 generations, with 100 parent pairs (200 parents total) selected for breeding in each generation, with each pair, producing two children (200 children total). The fitness function is combination of Net Profit and Profit Factor with weights of 1:1 respectively.
In the genetic algorithm literature plots such as this generally show the best solution over time. Here we plot mean rather than best score since the focus in this study is on the quality of the entire population and not only on the best strategy. Statistics of running GenFx have shown that 95% of CPU time is taken by calling MetaTrader to compile expert advisors and run backtesting on historical data. The remaining 5% is taken by all other GenFx calculations.
In the following sections, we describe each extension and the experiment results.
3.1. Standard Genetic Algorithm
First experiment is the base case, using a standard genetic algorithm approach. In this experiment, initial population is chosen based on Gaussian ranking selection. Population size was set to 200 expert advisors strategies. The following parameters were used:
1) Mutation value of 0.05: providing a probability of 0.05 to select an element to be mutated.
2) Hierarchy level value of 5, to allow medium selection of subtrees to be selected for swapping when breeding strategies.
3) Gaussian standard deviation of 10.0, to select strategies within a certain rank range.
The 200 initial parents are bred together generating 200 new offspring. The standard genetic algorithms uses an implementation of Elite [2] , keeping the best three strategies in every generation. Figure 5 shows the results of using a standard genetic algorithm. It is clear that there is premature convergence as few expert advisor variations take over the population and the fitness score doesn’t improve much.
3.2. Standard Genetic Algorithm with Restarting Option
In this experiment, a Standard Genetic Algorithm used with option to restart the generation process if there was stagnation for over five generations. Best generated expert advisor strategies were inserted into the output pool. Figure 5 shows the mean score of output pool during the experiment. It is clear that results have improved from last experiment
3.3. Multiple Generation Population
In this experiment, the base experiment has been extended to use a multiple generation population of size 200. Each two parents were selected from the output pool of the multiple generation population. In Figure 5, we can see improvement, in the mean score, over the standard genetic algorithm, and comparable results to last experiment. We also see that progress is monotonic, with no drops in score. The flat curve, between generations 100 and 200, shows stagnation and lack of progress.
3.4. Gender Based Selection
In this experiment we use gender based selection by selecting one parent from the Net Profit pool and the other parent from Profit Factor pool. Generated children will be inserting into the multiple generation replacing weaker or lower score ones. Figure 5 shows the results of using a gender selection along with using multiple generation population of size 200. It shows that Gender Based Selection extension improves over multiple generation population. It seems that the gender-based selection is a favorable extension to the multiple generation population.
3.5. Aging Decay
Figure 5 shows results of applying aging to a multiple generation population with gender. As shown in the Figure, the resulting strategies improve from one generation to the other. It seems that adding aging decay helps improve
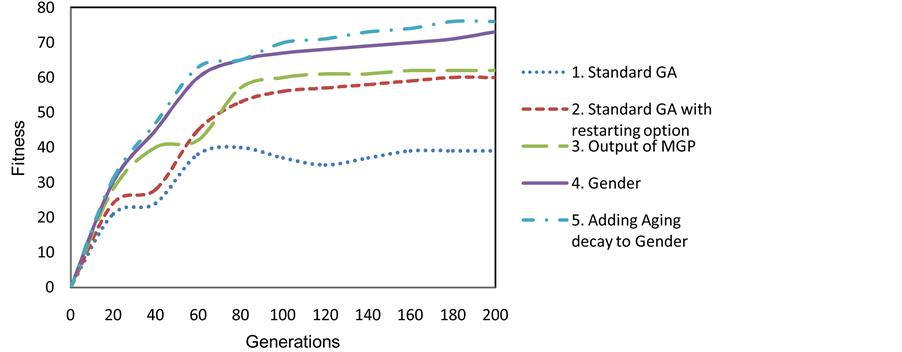
Figure 5. Comparisons of different generation setting using fitness score of (Net Profit + Profit Factor).
the results from that of using a gender selection along with using multiple generation population.
Figure 6 shows that performance of Gender-based multiple generation populations using different fitness functions. Since the gender-based selection is parents from both the Net Profit and Profit Factor pools, where strategies are strong in these two features, the genetic process has resulted in strategies with high score in both these features. However, generating such strong strategies have results in improved the features of Sharp Ratio, Max Draw Down Percentage and Stability as shown in Figure 6.
3.6. Reconfirmation of Previous Experiments
In order to reconfirm the results obtained so far, we have repeated the five previous experiments using the Net Profit and Maximum Draw Down Percentage pools of the multiple generation population. As shown in Figure 7, similar results are obtained where applying aging decay to the gender-based selection is the best performing method.
Results shown in Figure 8 reconfirm previous results obtained as well. Since the gender-based selection is selecting parents from both the Net Profit and Maximum Draw Down Percentage pools, where strategies are strong in these two features, the genetic process has resulted in strategies with high score in both these features. However, generating such strong strategies have results in improved the features of Profit Factor, Sharp Ratio, and Stability as shown in Figure 8. It is interesting to note that the profit factor feature has improved even better than Maximum Draw Down Percentage.
3.7. Multiple Processes Method
In order to test the performance of GenFx running in multiple processes mode, we used 12 processes running using common multiple generation population as shown in Figure 9. Each processor of the first 10 processors is running in gender-based mode. In each run, parents are selected from two of the multiple generation population pools. The last two processors are used to introduce diverse strategies to the multiple generation population. The twelve processes where organized as follows:
1) Net Profit and Profit Factor;
2) Net Profit and Max Draw Down percent;
3) Net Profit and Stability;
4) Net Profit and Sharpe Ratio 5) Profit Factor and Max Draw Down percent;
6) Profit Factor and Stability;
7) Profit Factor and Sharpe Ratio;
8) Max Draw Down percent and Stability;
9) Max Draw Down percent and Sharpe Ratio;
10) Stability and Sharpe Ratio;
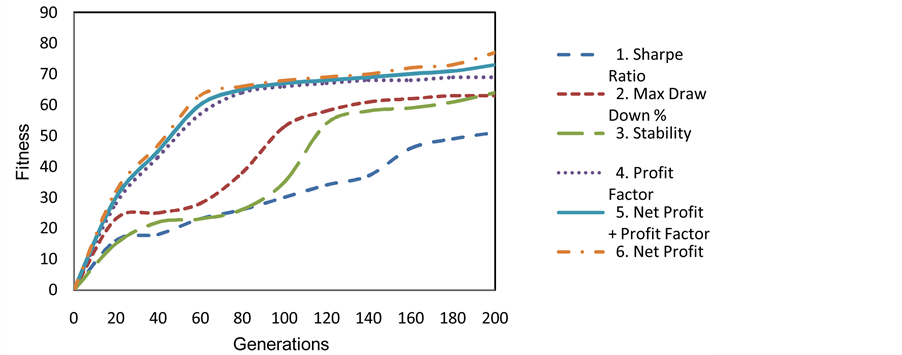
Figure 6. Measuring the performance of Gender-based MPG using different fitness functions.
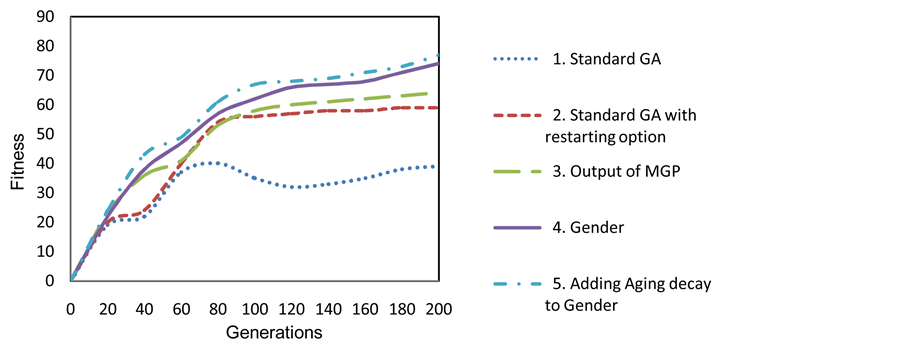
Figure 7. Comparisons of different generation settings using fitness score of (Net Profit + Max Drawn Down %).
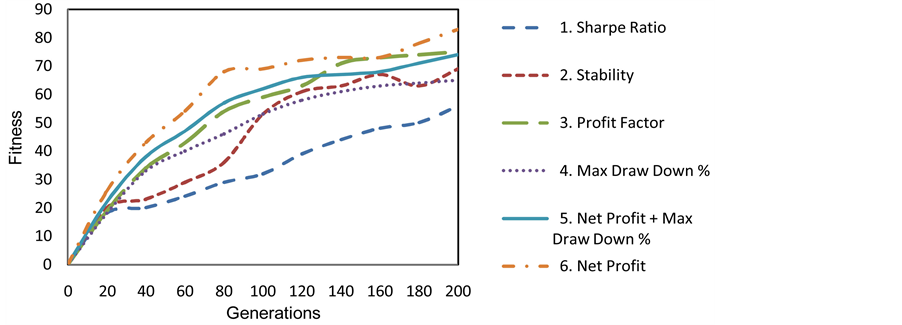
Figure 8. Measuring the performance of Gender-based MPG using different fitness functions.
11) Running random generations to introduce diversity;
12) Running using initial random generation with an option to restart generation if there is stagnation over five generations.
Figure 10 shows the results of running the twelve multiple processes for 200 generations using previous set-
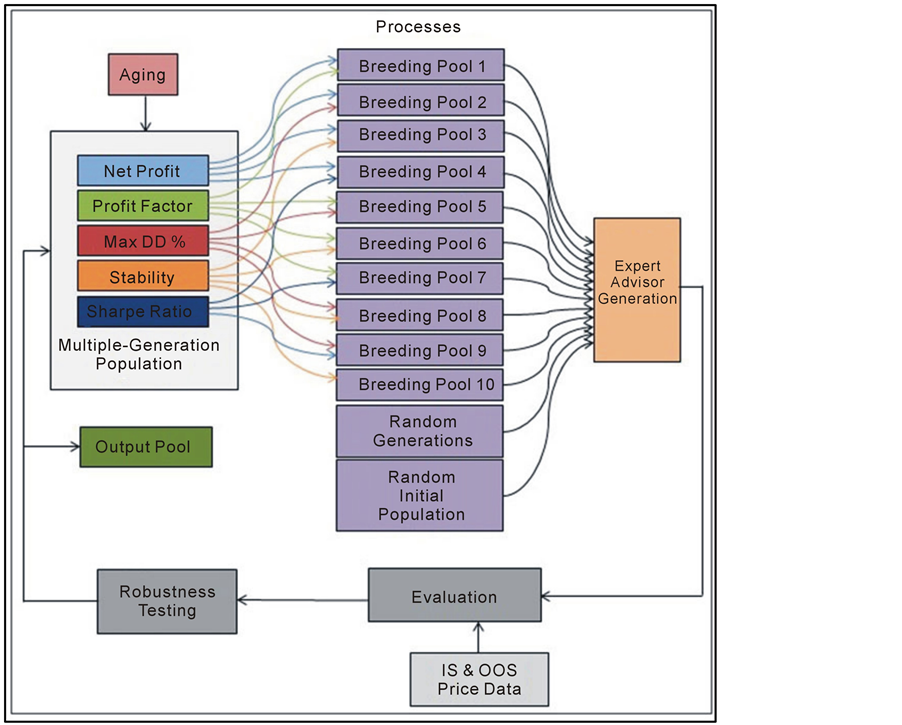
Figure 9. Multiple processes method.
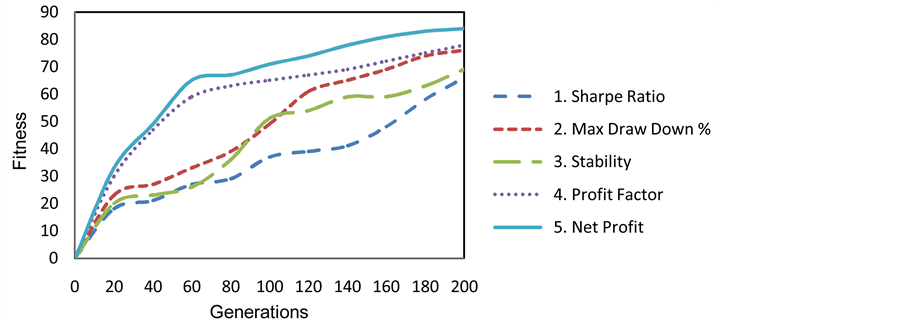
Figure 10. Measuring the performance of multiple processors method.
tings. As shown in the Figure, the stagnation problem has been avoided. There is overall improvement in the performance of the system.
4. Conclusions
Using a multiple-generation population has shown to be an improvement over the standard genetic algorithm. It is clear that the gender extension has introduced diversity and avoided stagnation. It is obvious that introducing the concept of aging allowed successful strategies many chances to be selected and eventually removed them so that they do not dominate the population. This has provided more diversity and formed the best combination of extensions so far. It seems that the multiple processes extension has improved results, avoided stagnation, reduced risk, and been outperformed by using a single processor.
Although GenFx system is inspired by our previous system GenShade, and GenFx outperforms GenShade by adding extra processes to its multiple processes method to generate random expert advisors and continuously introduce diversity into the multiple generation population.
However, the problem is that there are several variations of successful strategies that can be detected manually only at this time. A sophisticated algorithm is needed to automatically eliminate variations of successful strategies that are slightly different. It would be interesting to analyze what might make interesting strategies. Interesting strategies could be analyzed and certain patterns, e.g., subtrees, could be compared. Mutation could favor substituting these subtrees for hierarchy nodes.
The methods described in this paper are not limited to the Forex market only or financial problems but are applicable to many other fields.
5. Future Improvements
Since one of the main goals of this work is to create a portfolio of successful expert advisors for live forex trading, there should be more work to be done:
1) Further robustness tests on expert advisors using different pairs, e.g., GBPUSD, or timeframes.
2) Live testing on expert advisors that is connected to multi-processing generation, where expert advisors who fail in live testing and all of other similar expert advisors would be eliminated from the population or at least have more harsh aging penalties.
3) Expert advisors should have adaptive settings that should change over time in live trading.
4) Expert advisors in a portfolio should have weights to determine how much volume to trade based on their prior performance.
5) Expert advisors in a portfolio should communicate together, for example expert advisors opening trades in a triples of EURUSD, USDJPY, and EURJPY forex pairs could work together to hedge.
References
- DeJong, K. (1975) An Analysis of the Behavior of a Class of Genetic Adaptive Systems. Ph.D. Dissertation, Department of Computer and Communication Sciences, University of Michigan, Ann Arbor.
- Goldberg, D.E. (1989) Genetic Algorithms in Search, Optimization, and Machine Learning. Addison-Wesley Publishing Co., Boston.
- Grefenstette, J.J. and Baker, J. (1989) How Genetic Algorithms Work: A Critical Look at Implicit Parallelism. Proceedings of 3rd International Conf on Genetic Algorithms, Morgan-Kaufman, 20-27.
- Holland, J.H. (1975) Adaptation in Natural and Artificial Systems. University of Michigan Press, Ann Arbor.
- Simon, D. (2013) Evolutionary Optimization Algorithms, Wiley, Hoboken.
- Charles, D. (1859) The Origin of Species. New American Library, New York.
- Syswerda, G. (1991) A Study of Reproduction in Generational and Steady-State Genetic Algorithms. Foundations of Genetic Algorithms. Morgan Kaufmann Publishers, 94-101.
- Lee, C. (2003) Entropy-Boltzmann Selection in the Genetic Algorithms. IEEE Transactions on Systems, Man, and Cybernetics, Part B: Cybernetics, 33, 138-149. http://dx.doi.org/10.1109/TSMCB.2003.808184
- Toffolo, A. and Benini, E. (2003) Genetic Diversity as an Objective in Multi-Objective Evolutionary Algorithms. Evolutionary Computation, 11, 151-167. http://dx.doi.org/10.1162/106365603766646816
- De Jong, E.D., Watson, R.A. and Pollack, J.B. (2001) Reducing Bloat and Promoting Diversity Using Multi-Objective Methods, In: Spector, L., et al., Eds., Proceedings of the Genetic and Evolutionary Computation Conference (GECCO 2001), Morgan Kaufmann, San Francisco, 11-18.
- Whitley, D. (1989) The Genitor Algorithm and Selection Pressure: Why Rank-Based Allocation of Reproductive Trials Is Best. In: Schaffer, J.D., Ed., Proceedings of the 3rd International Conference on Genetic Algorithms, Morgan Kaufmann Publishers, San Mateo, 116-121.
- Godart, C. and Kruger, M. (1995) A Genetic Algorithm with Parallel Steady-State Reproduction. In: Alliot, J., et al., Eds., Artificial Evolution, European Conference, Springer, 22-24.
- Nicoar, E.S. (2009) Mechanisms to Avoid the Premature Convergence of Genetic Algorithms. Universitatea Petrol-Gaze, din Ploieti, 87-96.
- Atsalakisa, G. and Valavanisb, K. (2009) Surveying Stock Market Forecasting Techniques—Part II: Soft Computing Methods. Expert Systems with Applications, 36, 5932-5951. http://dx.doi.org/10.1016/j.eswa.2008.07.006
- Azzini, A., Pereira, C. and Tettamanzi, A. (2009) Predicting Turning Points in Financial Markets with Fuzzy Evolutionary and Neuro-Evolutionary Modelling. Applications of Evolutionary Computing, 5484, 213-222.
- Box, G., Jenkins, G. and Reinsel, G. (2006) Time Series Analysis, Forecasting and Control. Prentice Hall, Upper Saddle River.
- Myszkowski, P.B. and Bicz, A. (2010) Evolutionary Algorithm in Forex Trade Strategy Generation. Proceedings of the 2010 International Multi-Conference on Computer Science and Information Technology (IMCSIT), Wisla, 18-20 October 2010, 81-88.
- Slany, K. (2009) Towards the Automatic Evolutionary Prediction of the FOREX Market Behaviour. International Conference on Adaptive and Intelligent Systems, Klagenfurt, 24-26 September 2009, 141-145.
- Yaman, A., Lucci, S. and Gertner, I. (2014) Evolutionary Algorithm Based Approach for Modeling Autonomously Trading Agents. Intelligent Information Management, 6, 45-54. http://dx.doi.org/10.4236/iim.2014.62007
- Ibrahim, A.E. (1998) GenShade: An Evolutionary Approach to Automatic and Interactive Procedural Texture Generation. Ph.D. Dissertation, Texas A&M University, College Station.
- EATree Software Web Page (2014). www.eatree.com
- MetaTrader MQL5 Programming Language Web Page. www.mql5.com
Appendix
Meta Trader Platform
MetaTrader [23] is an electronic trading platform widely used by online retail foreign exchange speculative traders. It was developed by Meta Quotes Software and released in 2005. The software is licensed to foreign exchange brokers who provide the software to their clients. The software consists of both a client and server component. The server component is run by the broker and the client software is provided to the brokers’ customers, which use it to see live streaming prices, charts and to place orders as well as manage their account.
Expert Advisors (EAs)
Expert Advisors are programs that allow automation of the analytical and trading processes in the Meta Trader platform [23]. They provide automatic buy, sell, and money management decisions. Automatic trading eliminates the human factors of greed and fear. However, in many cases, it lacks the professional trader’s sharp decisions. There are two well-known programming languages for expert advisors: MQL4 and MQL5. In this work, we generate expert advisors in MQL5 language because of the reliability of the backtester of the MetaTrader 5 platform.
Net Profit
Net profit is the difference between the gross profit and the gross loss. Gross profit is the total of all profitable trades in money terms. Gross loss is the total of all losing trades in money terms.
Profit Factor
The profit factor shows how many times the gross profit exceeds the gross loss. The larger is this value, the better.
Maximal Drawdown
The money drawdown shows the maximal drawdown fixed in money terms and is the largest difference between the last maximum and the current minimum. It can exceed the absolute drawdown and helps to see the amount of possible loss even for a rather profitable trading.
Stability
Stability is a measure of how stable is the equity growth. Usually a steep line going upwards shows a high stability.
Sharpe Ratio
Sharp Ratio shows by how many times the arithmetic mean exceeds the standard deviation from the equity volatility. For example, Sharp = 0.6 means that there is an average risk to lose 10 dollars per a profit of 6 dollars. The larger is this value, the less risky is the trading. However, large profit values in individual trades can result in larger value of the standard deviation that, in its turn, results in unreasonable decreasing of Sharp Ratio.
Forex Data
The evaluations in this study are using historical Forex data for EURUSD Forex pair with one hour (H1) time frame. In-sample (IS) data used is ranging from January 1, 2004 to January 1, 2010. Out-of-sample (OOS) data is from January 1, 2010 to January 1, 2014. In-sample data is used to evaluate the expert advisor strategies. Out-of-sample data is used to re-evaluate strategies using an unknown data to avoid curve fitting, a case where a strategy works fine only on specific data.