Intelligent Information Management
Vol.2 No.9(2010), Article ID:2783,6 pages DOI:10.4236/iim.2010.29065
Simulation of Learners’ Behaviors Based on the Modified Cellular Automata Model*
1Computer Science and Information Engineering College, Guangxi Normal University, Guilin, P. R. China
2College of Teaching Chinese as a Second Language, Qingdao University, Qingdao, Shandong, P. R. China
E-mail: zhangcy@gxnu.edu.cn
Received June 11, 2010; revised July 25, 2010; accepted August 29, 2010
Keywords: motivation, engagement, cellular automata, simulation, learner behaviors
Abstract
This study develops a computational model for simulation of behaviors of learners under the influence of motivation and engagement environment based on Cellular Automata (CA). It investigates the changing patterns of learners’ behaviors when motivation and engagement environment are assigned with different values respectively. The simulation process indicates that the internal factor, which is the motivation in this paper, plays a key role in changing learners’ behaviors under certain circumstance and the engagement environment also significantly influences learner’s perception. The results obtained also show good agreement with the phenomenon generally being observed in practice.
1. Introduction
Motivation and engagement environment are always focus points for educators and interesting topics for researchers. They are the essential elements for successful knowledge acquisition and learning efficiency. In the past decades, many researchers have been focusing their studies on how the learners’ behaviors change when different impacts involve. Andrew J. Martin developed the Motivation and Engagement Wheel for the seminal motivation and engagement theory [1]. Researches indicate that students’ behaviors are influenced by different factors such as: self-complete intervention [2], emotional withdraw and poor identification with the school [3], class participation[4], school culture and structure[5], the relationship the students have with their teachers[6], educational correlates (educational aspirations, class participation, enjoyment of subject)[7] etc. These studies made great contribution to the formation of motivation and engagement theory in educational area and have been widely accepted in practice. However, these theories involve complex dynamic interactions of internal and external factors. The mixture of different types of impacts imposed on learners’ learning process makes quantitative analysis on behavior orientation a very difficult task. The main purpose of the present study is to apply microevolutionary mechanism of CA to simulate learners’ behaviors in a quantitative method.
The present study develops an approach through which the behavior orientation of learners can be observed intuitively. Based on CA and basic thoughts proposed in the motivation and engagement theories in education, this paper proposes a model for the simulation of complicated behaviors of learners influenced by two impacts which are the motivation strength and engagement environment, to investigate the global behavior of a selected population of learners. Simulation results obtained show that the proposed model is a promising computational approach in the mimic of behavior orientation of learners and provides a way to intuitively observe the changing pattern of learners’ attitude toward study under the complicated influence of impacts.
2. Method
2.1. CA
CA model was developed by Von Neumann and Ulam in their study on self-reproducing systems in 1951[8]. CA is a bi-dimensional continuum. Cells in CA interact in a codified space-time torus wrapped from a CA grid under behavioral rules[9]. They may change their status during the evolution, and each state represents the state of a specific cell at moment t. CA model may also be viewed as simulation of global results of local interactions among individual cells in a selected grid size[10,11]. The model can be considered as an evolving system in which individuals interacting with each other under certain stochastic transition rules [11]. The transferring of information among members in the system may result in the change of behaviors.
Most widely used neighborhood structures are Von Neumann’s model and Moore’s model as shown in Figure 1 [12]. In Von Neumann’s model, the central agent (cell) is surrounded by four neighboring cells, while in Moore’s model the central one is surrounded by eight neighboring cells [13]. The state of the central cell at time t depends on the collective interaction of the neighboring cells at time t-1.
A classical definition for CA is shown in the following equation[14]:
 (1)
(1)
where, L and d are the spatial extension of the automata and the dimension of the system respectively; S is the finite state set and N stands for the set of the cells; f is the transfer function of the mapped states.
2.2. Simulation Model
The simulation model presented in this paper consists of three major components which are CA, motivation and engagement environment respectively.
2.2.1. CA Component
The selected population of learners is treated as a complex system in which the individuals’ decisions on the perception of learning efficiency are closely related to that of their neighbors and impacts. The individual cells (treated as learners) in a two-dimensional grid may be represented with the following matrix (see Figure 2):
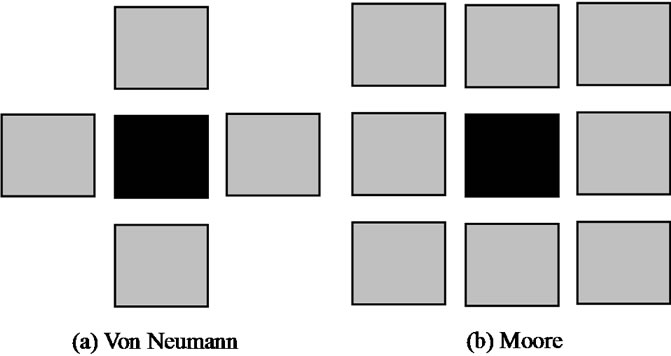
Figure1. Types of neighborhood of bi-dimensional CA.
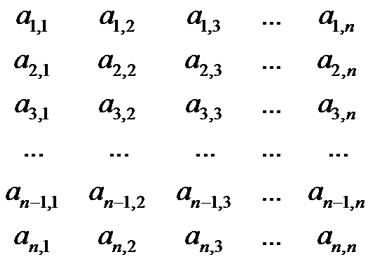
Figure2. CA matrix.
The subscripts (i, j) in the matrix indicate the positions of the cells in the automata.
A 30 × 30 CA automata grid is chosen for the simulation and Moore type of neighborhood structure is applied in this paper. Each cell in the CA grid is pre-assigned with a state and has three states to choose during the simulation. The state is represented as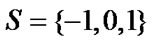 , where -1, 0 and 1 stand for the maladaptive intended state, natural intended state and adaptive intended state respectively.
The maladaptive intended state is for those who are negatively affected by neighbors in learning. They tend to have the perception of disengagement, self-handicapping, anxiety, failure avoidance and uncertain control.
The natural intended state represents the state for which the perception of learners on learning result is between the maladaptive and adaptive groups.
The adaptive intended state is suitable for those who are positively affected by neighbors in learning. They tend to have positive perception on self-efficacy, attributions, valuing, control, self-determination, goal orientation and so on.
The state of the central cell in CA component can be represented as the following:
 (2)
(2)
S (t) represents the intended state of a cell at time t and S(t - 1) stands for the average influence from neighboring cells in the neighborhood at time t - 1. The value of S(t) is determined by the average value obtained from its all neighboring cells at time t - 1. The influences imposed on the central cell at time t - 1 are: the average influence created by the neighbors is  when neighboring cells are in the state of -1; the average influence from the neighbors is
  when the neighboring cells are in the state of 0, and the average influence from the neighbors is
  when they are in the state of 1. Therefore, the average influences imposed on the central cell from its neighboring cells are as shown in Table 1.
2.2.2 Motivation Component
M(t - 1) is assumed to be individual’s intrinsic drive on learning at time t - 1 or the motivation on learning This paper assumes that M(t - 1) represents individual’s perception, at time t - 1, on self-efficacy, attributions, valuing, control, self-determination, goal orientation and so on. the value of M is chosen from [r1, r2], 0 ≤ r1 ≤ 1 and 0≤ r2 ≤ 1. In order to investigate the influence of M , the values of r1 and r2 are stochastically taken from sub-ranges within [0, 1] during the simulation. The subranges [0.3, 0.4], [0.4, 0.5], [0.5, 0.6] and [0.6, 0.7] are adopted to represent different perception (drive) levels while [0, 0.3] and [0.7, 1] are considered to be the extreme bad and extreme good perceptions on learning result. This arrangement of data-assignment typically represents the fact that motivation has certain level for certain group of learners. Through this way, we can assign different, but specific, levels (sub-ranges) of motivation on internal drive of individuals during the simulation.
2.2.3. Engagement Environment Component
 is taken as engagement environment at time t - 1, which is assumed to be the perception of an individual has on the engagement environment he is in. It is assumed that [0, e] is the range of perception that learners have on teaching method, school condition, interaction between teacher and students, relationship among students and so on and 0 ≤ e ≤ 1. The higher the value e is, the better the perception of the learners have. Values of Et are obtained through stochastically assigning values from the range of [0, e] to
  at time t-1during the simulation. This arrangement of data-assignment typically imitates the practice where the perception on engagement environment is widely distributed over individual learners in the range from the low to high due to different personal values.
2.3. Determination of Resulted State
The final state for each cell at each time step is determined by the total  of S(t ), M(t) and E(t) as shown in equation 3. The value for
  is ≧ 0 and may exceed 1 in some cases.
 (3)
(3)
With this special design, we can combine CA with some impacts to dynamically simulate state change of individual cells in a social system, thus to create a global orientation of a selected population of learners.
2.4. Transit Rules
According to the simulation model proposed above, following transit rules for the simulation are formulated:
1) The state of a cell may change stochastically from  to
to  during the simulation. It may change from its own state at time t-1 to other states at time t depending on the calculated
  in each time step. Here, critical values of 0.95 and 0.55 for
  exist. Learner’s state changes in the direction of adaptive only when
  ≥ 0.95, while learner’s state transfers to maladaptive only when
  ≤0 .55.
2) The state change for each cell follows the path of maladaptive-natural-adaptive or adaptive-natural-maladaptive. Direct changing from maladaptive to adaptive or adaptive to maladaptive is prohibited.
Through numerous experiments, this paper proposes a set of suitable transit rules for the simulation process as shown in Figure 3.
3. Simulation and Discussion
Based on the transit rules described above, numerous simulations were carried out. Typical evolving results of the simulation are as shown in Figure 4 where the star represents maladaptive and oval stands for adaptive. State change for learners is simulated under different levels of M (t) and E (t), which is discussed in following sections. The results shown in Figure 5 and Figure 6 are the average of ten simulations, which clearly indicate the changing trend of learners’ perception under the influence of M and E.

Table 1. Central cell state under the average influence of neighboring cells.

Figure3. Transit rules.
3.1. The Impact of Engagement Environment on Learner Behaviors
Learners’ perceptions on learning results, as shown in Figure 5 (a), (b) and (c), are simulated under the influence of E when M is taken from [0.35, 0.45], [0.45, 0.55] and [0.55, 0.65] respectively. The results show the influence of engagement environment on learners’ perceptions at different levels of motivation strength. Following interesting points are noticed: the change of E causes the numbers of adaptive and maladaptive learners increasing or decreasing at different levels of M; the numbers of adaptive and maladaptive learners increases and decreases respectively at the same level of M when E is improved; the numbers for both types of learners also increase and decrease at the same level of E when the strength of M is increased to a higher level. Another important implication is that the change of M’s level brings more remarkable change on the numbers of both types of learners than the change of E. These result show good agreement with the fact that internal factor plays more important role in changing the perceptions of group of learners than the external factors.
 (a) E = 0.5, M = [0.35, 0.45]
 (b) E = 0.5, M = [0.55, 0.65]
Figure 4. Typical evolving results of the simulation at the 50th time step.
 (a)
(a) (b)
(b) (c)
(c)
Figure 5. (a) Influence of E when M is taken from [0.35, 0.45]; (b) Influence of E when M is taken from [0.45, 0.55]; (c) Influence of E when M is taken from [0.55, 0.65].
3.2. The Impact of Motivation on Learners’ Behaviors
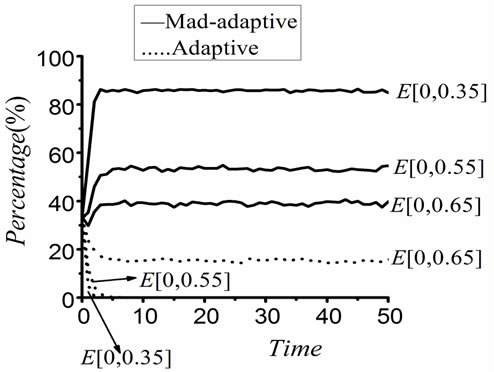
To further prove the findings in Figure 5, another group of simulations are also implemented. Figure 6 (a), (b), (c) and (d)show the influence power of M when E is taken from [0, 0.35], [0, 0.45], [0, 0.55] and [0, 0.65] respectively. These figures again clearly indicate the importance of M on learners’ perceptions on learning results. At different levels of engagement environment, M imposes remarkable influence on learners’ perception. The most significant impact on the number change of learners both in adaptive and maladaptive groups happens at the middle and better levels of engagement environments, which
 (a)
(a)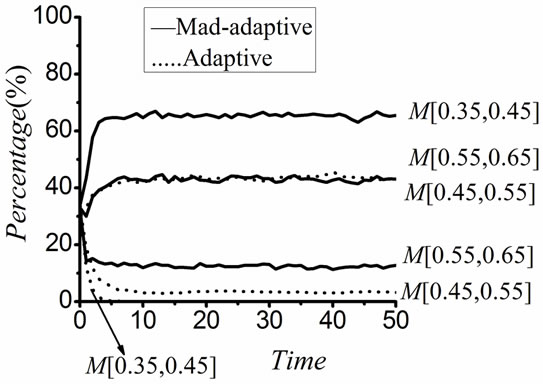 (b)
(b)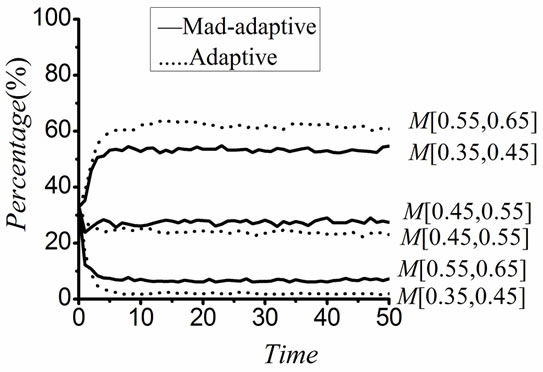 (c)
(c) (d)
(d)
Figure 6. (a) Influence of M when E is taken from [0, 0.35]; (b) Influence of M when E is taken from [0, 0.45]; (c) Influence of M when E is taken from [0, 0.55]; (d) Influence of M when E is taken from [0, 0.65].
also has good agreement with the fact that basic external environment is necessary for better outcomes produced by the internal factors.
3.3. Comparison of Effectiveness of Impact Factors
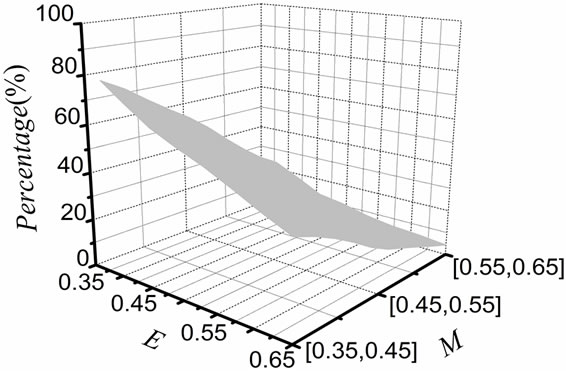
In order to separately show the changing pattern of adaptive and maladaptive learners’ behaviors under changing M and E, three-dimensional figures are plotted based on the average of 100 simulations as shown in Figure 7 where percentage represents the number of relevant group of learners. From these figures, intuitive changing trend for both groups of learners is observed when M and E both change to different values. Stronger influence power of M comparing with E can be seen clearly at different points of the axes.
4. Conclusions
The model proposed in this paper combines CA with two strictly defined impacts. Through using the simulation model and transit rules carefully designed, it can be applied to simulate the global behavior of learners. The simulation process indicates that the internal factor, which is the motivation in this paper, plays a key role in changing
 (a)
(a)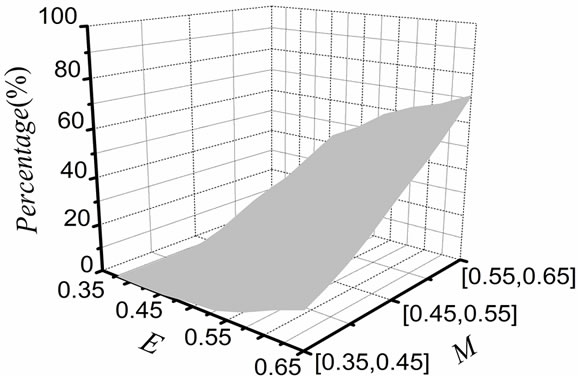 (b)
(b)
Figure 7. (a) Changing pattern of maladaptive learners; (b) Changing pattern of adaptive learners.
learners’ behaviors under certain circumstance and the engagement environment is also a very important force of influence on learners’ perceptions. Results also show that the simulation model and transit rules proposed in this paper are adequately designed and be able to reveal the changing patterns of behaviors of learners in some extent in learning environment and the results are close to the phenomenon observed in practice. Simulation results obtained show that the proposed model is a promising computational approach in the assessment of behavior orientation of a selected population although the accuracy is not validated due to the lack of real data. The model proposed also provides a way to intuitively observe the changing pattern of learners’ attitude toward learning under the influence of impacts based on the social environment provided by CA.
5. References
[1] A. J. Martin, “How Domain Specific is Motivation and Engagement across School, Sport, and Music? A SubstAntive-Methodological Synergy Assessing Young Sportsp-Eople And Musicians,” Contemporary Eduction Psychology, Vol. 33, 2008, pp. 785-813.
[2] A. J. Martin, “Enhancing Student Motivation and EnGagement:The Effects of a Multidimensional Intervention,” Contemporary Eduction Psychology, Vol. 33, No. 2, 2008, pp. 239-269.
[3] J. D. Finn, “Withdrawing from School,” Review of Educational Research” Vol. 59, No. 2, pp. 117-142.
[4] F. D. Ritcher and D. Tjosvold, “Effects of Student Partciption in Classtoom Decision Making on Attitudes, Peer Interaction, Motivation and Learing,” Journal of Applied Phychology, Vol. 65, 1980, pp. 74-80.
[5] E. A. Anderman and M. L. Maehr, “Motivation and Schooling in the Middle Grades,” Review of Educational Research, Vol. 64, No. 2, pp. 287-310.
[6] J. A. Kelly and D. J. Hansen, (1987), “Social Interactions and Adjustment,” In V. B. Can Hasselt and M. Hersen, Ed., Handbook of adolescent psychology, Pergamon Press: Springer, New York, pp. 131-146.
[7] J. Freen, A. J. Martin and H. W. Marsh, “Motivation and Engagement in English, Mathematics and Science High School Subjects: Towards an Understanding of Multidimensional Domain Specificity,” Learning and Individual Differences, Vol. 17, No. 3, 2007, pp. 269-279.
[8] J. vonNeumann, “The General and Logical Theory of Automata,” L. A. Jiffries, Ed., Cerebral Mechanism in Behaviorthe Hixon Symposium [C], Wiley, New York, 1951.
[9] H. Y. Liu, Y. L. Li, C. Y. Zhang and Q. Wang, “Simulation of Learners’ Behaviors Based on Cellular Automata,” IEEE 2009 International Conference on Computational Intelligence and Software Engineering, China, 2009, pp. 1-4.
[10] S. Wolfram, “Statistical Mechanics of Cellular Automata,” Reviews of Modern Physics, Vol. 55, No. 3, 1983, pp. 601-644.
[11] N. H. Packad, S. W. Fram, “Two Dimensional Cellular Automata,” Journal of Statistical Physics, Vol. 38, No. 5-6, 1985.
[12] J. Nemmann, “Theory of Self Reproducing Automata,” University of Illionois, Urbana, 1966.
[13] Frishu, Hasslacherb, Y. Pomeau,” Two Dimensional Cellular Automata,” Physical Review Letters, 1986.
[14] S. W. Fram, “Theory and Applications of Cellular Automata,” World Scientific, Singapore, 1986.
NOTES
*Supported by the Education and Teaching Key Project for the Eleventh Five-year Plan for the New Century (Guang Xi Provence, P. R. China) No.2008A020.