Journal of Geographic Information System
Vol. 4 No. 3 (2012) , Article ID: 19597 , 12 pages DOI:10.4236/jgis.2012.43029
A Spectroscopic Approach to Assess Heavy Metals Contents of the Mine Waste of Jalta and Bougrine in the North of Tunisia
1Laboratoire des Ressources Minérales et Environnement, Faculté des Sciences de Tunis El Manar, Tunis, Tunisia
2Département de Géologie, Université Tunis El Manar Faculté des Sciences de Tunis, Dynamique des Bassins Sédimentaires, Paléoenvironnements et Structures Géologiques, Tunis, Tunisia
Email: gannouni_sonia@yahoo.fr
Received December 23, 2011; revised March 1, 2012; accepted March 19, 2012
Keywords: Acid Mine Drainage; Metals Leaching; Geochemical Properties; Spectral Properties; Spectral Parameters; PLSR (Partial Least Square Regression)
ABSTRACT
Near InfraRed Spectroscopy (NIRS) has become an extremely important analytical technique in recent years and been applied in various geoscience areas such as mineral exploration and environmental studies. It is used for studying the physico-chemical properties of earth materials by enabling the interpretation of mineral composition and the study of its variability based on the diagnostic of spectral features. In this research, the application of laboratory reflectance spectroscopy in assessing heavy metals pollution is investigated. The potential use of reflectance spectroscopy in detecting Fe-related and clay minerals as well as the quantitative characterization of pollutants is studied for the mine waste of Jalta and Bougrine in the North of Tunisia. Mining activities of lead/Zn, have led to extensive pollution. The analysis of geochemical results outlined the level and spatial pattern of pollutants concentration. Results of the study showed that a relationship exists between reflectance spectra and geochemical measures of pollutants. The Spectral interpretation of Fe-related minerals and clay minerals showed that they are related to the pollutants and can be used as indirect spectral indicators of the pollution. The Fe-minerals include: jarosite, goethite, hematite/goethite, and hematite; clay minerals and feature-less (aspectral) materials. A direct quantitative relationship between pollutants and spectral parameters shows that Pb-Zn-Mn are the best correlated with a ratio of 610/500 nm range while Ni-Cr have a best correlation with a slope around 980 nm. Outputs from Partial Least Square Regression (PLSR) confirmed these relationships and also indicated that spectral parameters and reflectance values within 400 - 2500 nm range can better predict the contamination for Mn, Pb and Zn than for Ni and Cr but not for Fe, Cu, Cd, EC and pH.
1. Introduction
In the abondoned waste mines, acid water drainage can adversely impact the quality of drinking water and the health of riparian ecosystems. The Acidic water formed by sulfide oxidation can relatively generate soluble and insoluble secondary Fe-related minerals which are controlled by pH, level of oxidation, moisture content, and solution composition ([1] FRITZE et al., 1994; [2] DAVIES, 2001). The secondary Fe-related minerals are of special interest to this study since they have specific spectral features. In extremely acidic condition (pH 2.5 - 3.5) due to the high sulfur content of waste mine, the dissolution and precipitation of the secondary minerals genrate heavy metals which make possible to spectrally identify them on the basis of their spectral reflectance. The position of the specific absorption bands corresponding to seconddary Fe-related minerals are caused by the transition elements and crystal fields ([3] (CLARK, 1999).
Near-InfraRed Spectroscopy (NIRS) reflectance is a quantitative and qualitative technique that gives good resuts for the determination of various parameters in food, agriculture, textile, petrochemical, and pharmaceutical industries. NIRS has given good outcomes for the determination of physical, chemical, and biological soil properties such as moisture; total C, N, and P contents; mineral N; quality of organic matter; and biological parameters of soil such as respiration and microbial biomass ([1] FRITZE et al., 1994; [4] MALLEY,1998; [5] CONFALONIERI et al., 2001; [6] SLAUGHTER et al., 2001; [7] SMITH et al., 2001; [8] CHODAK et al., 2002; [9] MCCARTY et al., 2002). NIRS has been also used to predict trace metal content in sediments or soils ([10] MALLEY et al., 2000; [11] KEMPER ANDSOMMER, 2002).
([12] Malley and Williams, 1997) obtained accurate predictions of metals such as Fe, Mn, Zn, Cu, Pb, and Ni. In our study for the first time, we will use the NIRS reflectance Spectroscopy approach to investigate the potential acidic drainage effect within waste mine sites in the North of Tunisia. In contrast to previous studies, we focused more on modeling the relations between reflectance spectroscopy and geochemical variables of the waste mines by the use of Partial Least Square Regression (PLSR).
2. Materials and Methods
2.1. Study Area
The mining village of Jalta is located at 85 km from Tunis. It is located at the western North of Tunisia. In the mining sector of Jalta exploitation begun in 1898 and stopped in 1986. The total quantity exploited was about 270.000 tons. 70% to 80% of Pb was obtained by treating 400 tons/day ([13] SAINFELD, 1952; [14] ROUSSEV et al., 1976; [15] BOUSSEN, 2004). The dump is situated at 500 m in the west of the mine. It covers an area of 700 m length and 500 m width (Figure 1).
The mining village of Bougrine is located at 175 km from Tunis. It is located at the western North of Tunisia. In the mining sector of Bougrine, exploitation begun in 1901 and stopped in 2005 ([16] MASSIN, 1972; [17] GUEDRIA, 1981; [18] SEBAI, 2007). The mine waste is situated at 500 m in the west of the mine. It covers an area of 500 m length and 270 m width (Figure 2).
The Jalta and bougrine mining district are located at the western north of Tunisia. The waste mine which are rich in pyrite and other sulfides are now disposed in a large dump. The areas of Jalta and Bougrine mines waste are approximately 350,000 m2 and 67,500 m2, respectively. Oxidation of sulfides in these wastes releases trace metals into the rivers Gzenni (Jalta) and El Malah (Bougrine).
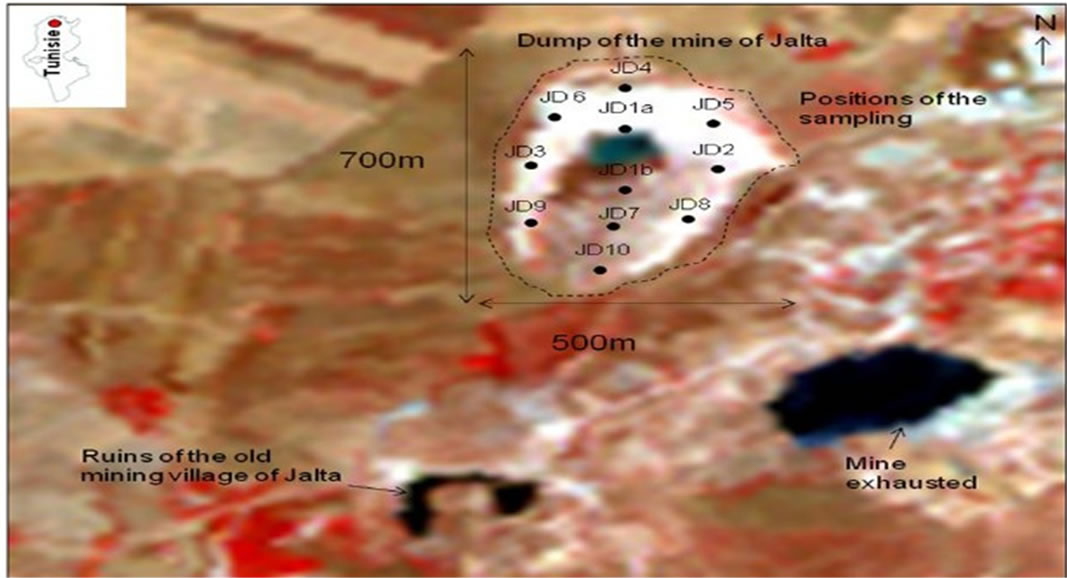
Figure 1. Location of the study area: mine of Jalta and waste samples.
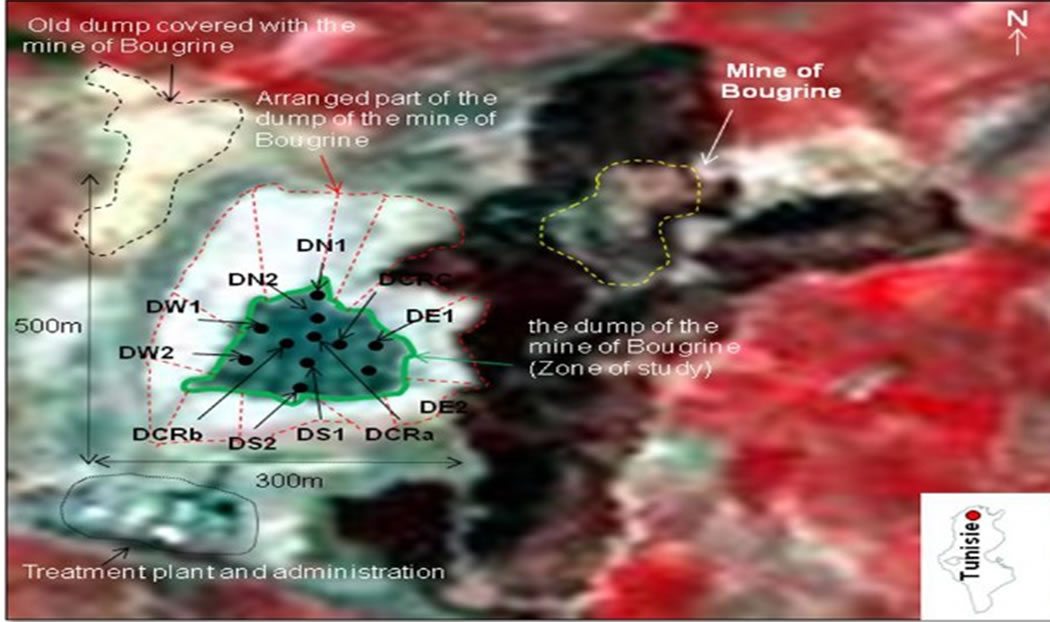
Figure 2. Location of the study area: mine of Bougrine and waste samples.
2.2. Soil Sampling
A total of 22 waste samples were collected from the dump from Jalta and Bougrine at a depth <10 cm in April 2005 (see Figures 1 and 2). The selection of sample areas was based on a visual interpretation of a false color composite of an Aster image. The collected soil samples were air-dried and passed through a 2 mm sieve to remove large debris, stones, and stubbles. Each sample was split into two subsamples. One subsample was used for spectroscopic measurements and the other for physical and chemical analysis to characterize the heavy metals content.
2.3. Chemical Analysis
The laboratory analytical data are extracted from threeleachate phases: water, partial and total ([19] THOMPSON, 1983; [20] SIEGEL, 2002). Eight metals are selected based on their: Toxicity/Environmental context, Relation to local geology and mining activities, Spectral absorption property (transition elements) and Data completeness and variability. The selected elements are lead (Pb), zinc (Zn), manganese (Mn), iron (Fe), cadmium (Cd), copper (Cu), Chrome (Cr) and Nickel (Ni). The acidity (pH) and conductivity (EC) are also to be considered with the aforementioned parameters since they are important environmental indicators. The ICP-AES analyticcal instrumentsis used. Some elements were analyzed from the three extractions by the use of water, hydroxylamine for the partial extraction and aqua regia for the total extraction as digestion solutions (reagents).
2.4. Spectral Measurements
The waste samples were spectrally measured in laboratory by a spectrophotometer (Cary 500 version 8.01) with wavelengths varying from 400 to 2500 nm and a spectral sampling interval of 1 nm. In the laboratory, waste samples were sieved (<2 mm) for bi-directional reflectance measurements to circumvent micro-shadow effects from macro-aggregates. Waste samples were illuminated with two tungsten quartz halogen filament lamps in housing with aluminum reflectors. The lamps were placed on each side of the sample, with the light beam 30˚ from the vertical, to give a distance of 50 cm between the lamps and the sample. Reflected light was collected with a 25˚ field-ofview, perpendicular to the sample at a distance of 10 cm. Absolute bidirectional reflectance spectra were obtained by multiplying the raw reflectance spectra by the certified reflectivity of the Spectralon standard.
It is not always possible to measure all the waste properties in a single measurement (called “site” here). The measurements by spectrophotometer are three times repeated for the 22 samples. As a result, 66 spectra are obtained. Some properties of the waste spatially vary even for short distance and this is due to its structure in the plowed horizon. The difference in measurement condition generates an additional variability which is considered as noise, masking a part of the bands existing between the measured properties. The most obvious solution consists in reducing the number of the characterized sites in order to increase the number of repetitions of each measurement for the same site and thus to compensate the number of measurements being invariant. The decrease of the number of the characterized sites generates in its turn a reduction of the power of the statistical methods which are particularly used when the number of characterized sites is small. However, if the number of characterized sites is irreductible and it is necessary to increase the number of repetitions, it is still possible to use simple models, which require fewer measurements to be gauged. And that was the strategy which was retained for this study.
2.5. Modeling Approaches
Partial Least Square Regression (PLSR) is a method of relating Y-variables (dependants) with X-variables (predictors), which preferably have much collinearity so that the method gives better results ([21] WOLD et al., 2001). PLSR is thus a method where the information is commonly explained by the original X variables that is compressed into few variables known as PLS components (latent variables). The resulting smallest possible number of components would then simplify the interpretation of the relationship between X-data and Y-data since this relationship is concentrated on them ([2] DAVIES, 2001; [22] WANG et al., 2007). The PLSR in this research is based on the Beer Lambert law (or Beer’s law) which describes the linear relationship between absorbance of energy and concentration of an absorbing species ([23] BEN-DOR et al., and BENIN, 1995; [24] BEN-DOR et al., 2002; [25] BEN-DOR et al., 2003; [26] ESTIFANOS, 2006; [27] GOMEZ et al., 2005; [28] KOOISTRA et al., 2001; [29] KOOISTRA, 2004; [12] MALLEY and WILLIAMS, 1997; [10] MALLEY et al., 2000; [30] MILA, 2007; [31] THOMAS and STEFAN, 2002; [22] WANG et al., 2007; [32] YONGLING et al., 2008; [33] WU et al., 2005a; [34] WU et al., 2005b; [35] WU et al., 2007). The effect of the pollutants on the spectral property of the sediments stream is supposed to vary depending on their content in the mine waste. The statisticcal modeling of the geochemical variables was done using four sets of spectral data: the 32 spectral parameters and the original spectral reflectance values at 2151 wavelength positions. The spectral parameters are numerical values which are derived from some wavelength positions in the original reflectance or calculated as hull quotient and 1st derivative values. The original spectral reflectance values continuously vary for each interval of 1 nm in the whole wavelength range (400 - 2500 nm). The best predicting spectral parameter are compared with the best predicting spectral wavelength regions for confirmation. The magnitude with which the geochemical variables are predicted is compared in both cases. The software package, The Tanagra, employs a leave-one-out type validation method known as full cross-validation which uses the same data for both calibration and validation of a model. The regression can repeatedly be run each time avoiding insignificant X-variables till the best explaining significant predictors remain and thus make the model more robust. The significance level of the predictors is determined based on p-value <0.005 i.e. there shouldn’t be more than 5% probability of risk to consider so that the relationship between the dependant (Y-variables) and predictors (X-variables) is not due to chance. The Prediction Influence Value (PIV) >1 is used to evaluate the importance of the properties. The values and the hierarchy of the properties PIV that are proved to be enough dependent on the data initially used. In a first stage, the cross validation error “Leave-One-Out” which was retained to carry out a selection of the properties in a semi-independent way and the PIV is used only in a second stage to evaluate the importance of the properties finally retained. The cross-validation error equation is as follows:
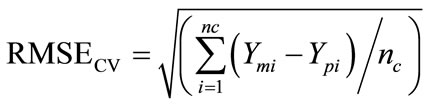
where, RMSEcv is the root mean square error. Ymi is the value measured for the sample i from the chemical analysis, Ypi is the value predicted for the sample i by a model adjustment without the sample i, and nc is the number of samples used in the calibration set.
3. Results and Discussion
3.1. Chemical Analysis
The magnitude of the potential toxic metals impact on the ecosystem depends on their solubility in solutions of varying pH conditions and on the stages of formation of the metals. A toxic metal has the highest impact on the ecosystem when it exists in a mineral form that easily dissolves in water, otherwise, it has the lowest impact when this mineral needs rigorous acidic conditions to be dissolved, a rare case in nature such as AMD. Tables 1, 2 summarize the geochemical analysis results. For eight cations, pH and EC were measured within water solution, which was used for analyzing the water extractable cations.
The minimum pH value is 3 and maximum is 8.58. The EC ranges from 90 to 963 microS. Pb, Zn, Mn, Cu and Fe could be detected in all the three leachate phases of extraction. The maximum values in the total extractions are about 8000 ppm, 3000 ppm, 5300 ppm, 285 ppm and
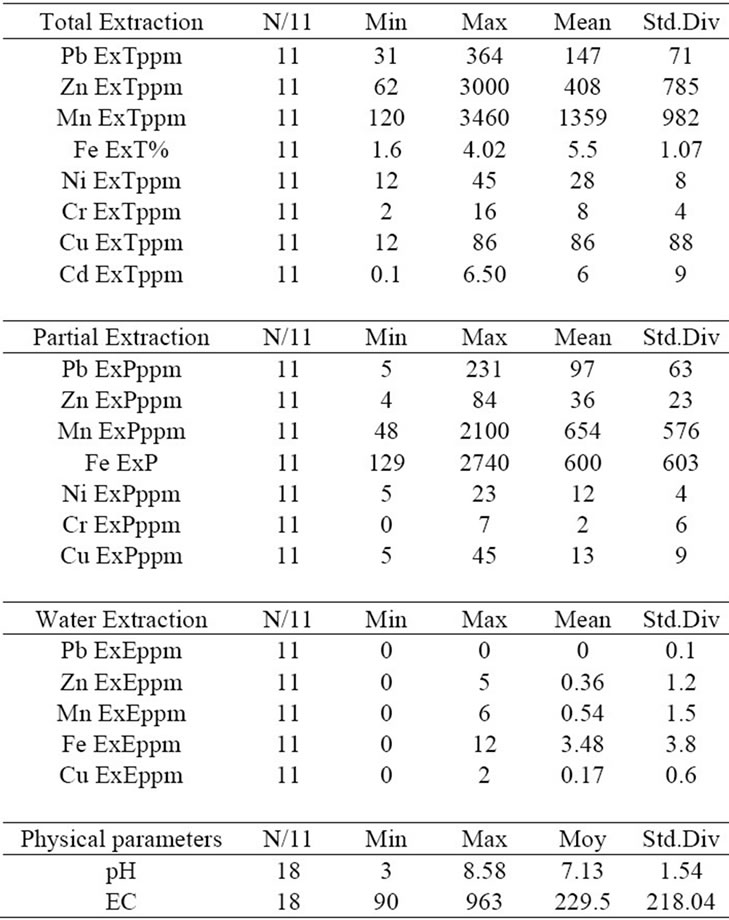
Table 1. Statistical summary for the geochemical parameters in three extraction datasets (dump of mine of Bougrine).
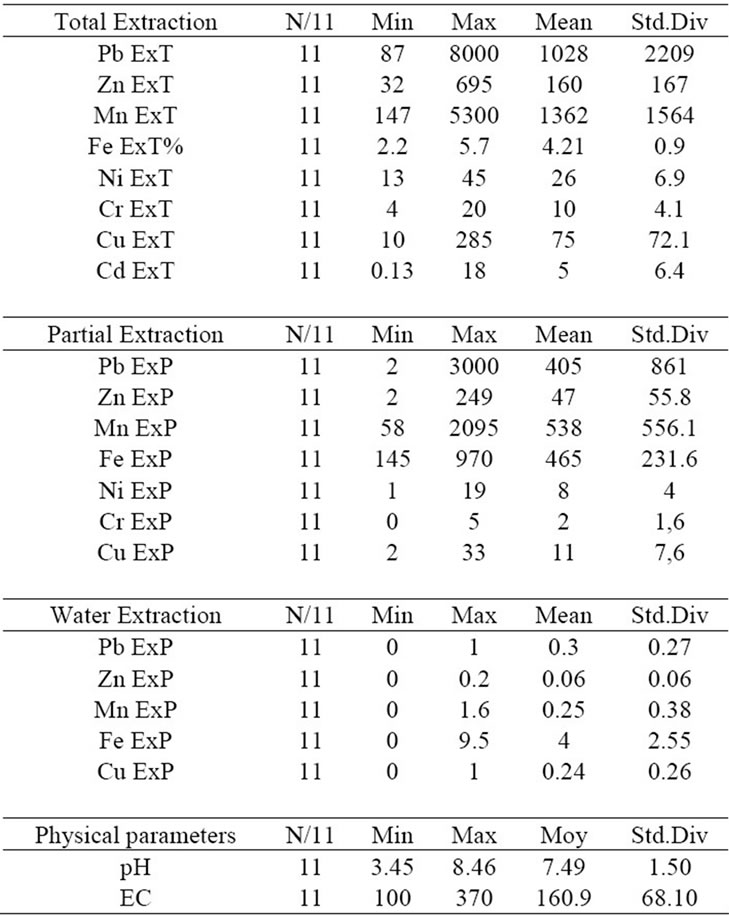
Table 2. Statistical summary for the geochemical parameters in three extraction datasets (dump of mine of Jalta).
5.7% respectively. Ni, Cr, and Cd are detected in total and/or partial extraction. The maximum values in total extraction are about 45 ppm, 20 ppm, and 18 ppm respecttively.
The partial geochemical extraction was conducted using 20 ml of 0.25 mol hydroxylamine and 0.1 mol of HCl solution. It was aimed to extract the pollutants that might have been attached to amorphous phases of minerals. Unlike, sequential extraction which can selectively dissolve particular phase/mineral types, partial extraction also includes the water soluble mineral phases. The water extractable values, the difference between partial and water extraction (P-E) as well as between total and partial (T-P) extraction were considered to determine the pollutant concentration which are related to amorphous and crystalline phases. The following pie diagrams (Figure 3) illustrate the approximate and relative proportion of heavy metals in the three phases. Base metals have different modes of formation in waste, sediments and soils. The pie diagrams show that Pb-Zn-Cu which are attached to amorphous phases are stronger than Ni-Cr-Cd. The Cd was detected only in the total extraction and the Cr has very small proportion in the partial extractable phases (Figure 3). The high proportion of Mn in the (P-E) phase indicates the presence of Mn related to the amorphous phase (Figure 4).
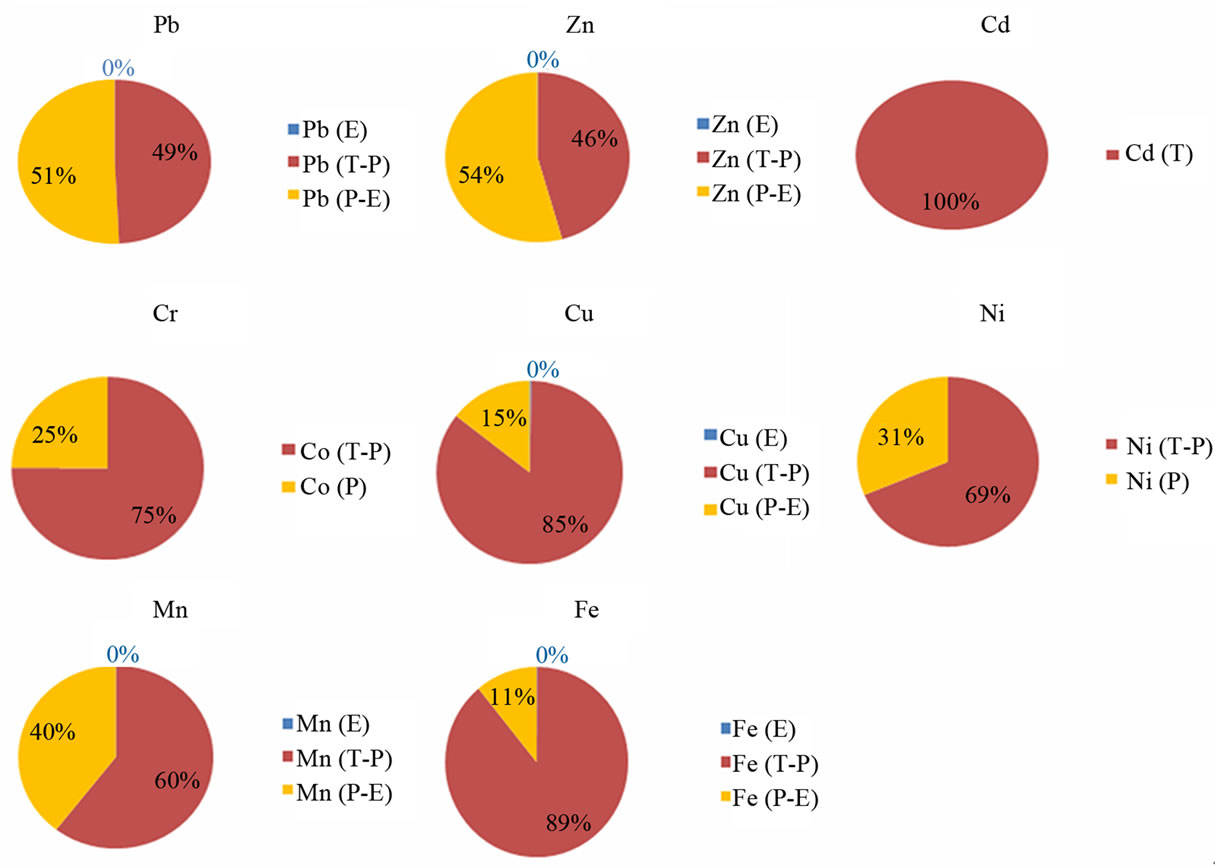
Figure 3. Pie diagrams showing relative proportions of attached concentration: Pb, Zn, Ni, Cr, Cu, Mn and Fe. E: the water extraction, T-P: the difference between total and partial extraction and P-E: the difference between partial and water extraction.
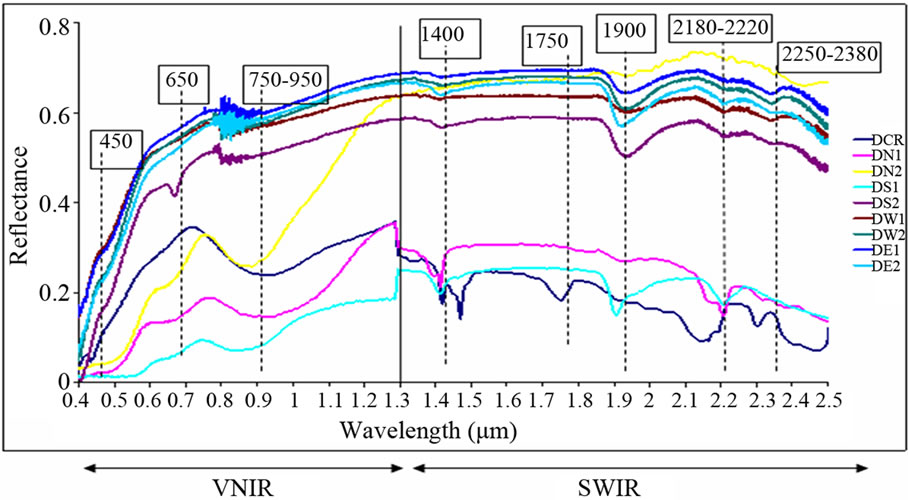
Figure 4. A spectrum with wavelength positions of the waste mine sample.
3.2. Spectral Analysis
Analysis of spectra measured by the spectrophotometer was carried out for qualitative and quantitative interprettation of minerals. Spectra of laboratory were utilized to connect absorption bands to the chemical composition of the samples which were collected from the waste mine. The qualitative analysis of the spectral signatures of waste mine consists of investigating the shape of the curve and simple comparison with the curves of pure minerals. In spectroscopy, the absorption bands within 400 - 2500 nm range are very important for the identification of the minerals which have the absorbing physicochemical structure of photon. We can clearly observe two spectral areas in this range: the electronic area, Visible Near InfraRed (VNIR) (400 - 1300 nm) where absorptions are caused by transition metals for example, Fe, Pb, Mn, Ti, Cu, Co, and Cr and the area of vibration, Short Wavelength InfraRed (SWIR) (1300 - 2500 nm) where absorptions are caused by OH–, H2O, NH4+,  and
and  ([36] SWAZE and CLARK, 1995; [37] SWAZE et al., 1998; [38] SWAZE et al., 2000). A first comparison of the samples spectra colledted in the two areas of study (Figure 4), show the existence of several minerals such as the iron which is detected by absorption bands in visible near infra-red (400 - 1300 nm). The presence of quartz, carbonates (calcite and dolomite), clays, water, organic matter is detected by absorption bands in infra-red (1300 - 2500 nm) respectively. During iron speciation, the oxidation of the waste of the mines causes the formation of the Fe– related secondary and release of heavy metals which can be precipitated or absorbed. Thus, the application of the spectroscopy to evaluate the mineralogical composition of pollutants is studied indirectly by the Fe-related secondary minerals which have specific spectral signatures in the wavelengths interval 400 - 2500 nm. In this spectral analysis, the iron minerals are mainly interpreted within VNIR area. The interpretation of the spectra of the iron minerals in this study is based on the combination of the absorption bands of load transfer and crystalline field which includes: The band nearby 438 nm, position of the minimum of absorption around 900 nm and the shoulder slope between 600 and 750 nm. Three endmembers were defined to represent the relatively dominant types of the iron mineral: “probable jarosite”, “probable goethite”, “and probable hematite”.
A spectrum is a rich source of information that can be extracted to determine the mineralogical composition. The quantification is based on the depth, the width and the asymmetry of an absorption band, the position of minimum reflectance and the shoulder slope of reflectance. Various algorithms were developed to transform the spectrum of reflectance to other forms to obtain better spectrum information. In this research, the curve of original reflectance, the first derivative and “hull quotient” are mainly considered. The original spectra of reflectance are adapted to calculate the difference of shoulder and the inflections of the slopes and the wavelength position of the minimum absorption. The depth and the bandwidth of absorption can be better estimated by “hull quotient” of spectrum. The first derivative determines the slope and length of the whole range of the spectrum. Consequently, 32 spectral parameters were chosen by the spectrum of reflectance (Table 3). Hull quotient and first derivative frorm of the spectra allowed us to observe the variability of absorption bands between samples. TSG software (www.thespectralgeologist.com), was used for the visualization and also the quantification of this variability. These spectral parameters were applied when modeling the physicochemical properties of the mine waste.
3.3. Coefficients of Regression Model and Spectral Properties of Heavy Metal Content
Figure 5 shows different plots resulting from one step of the regression process in the software Tanagra (http://chirouble.univ-lyon2.fr/~ricco/tanagra). The Principal Components Analysis (PCA) is used to determine the most significant parameters. The score plots display the results of PCA (Figure 5(a)). The closer the samples the more similar with respect to X and Y they are. Outlier samples could be removed during the next regression. In the regression coefficients plot (Figure 5(b)), each predictor
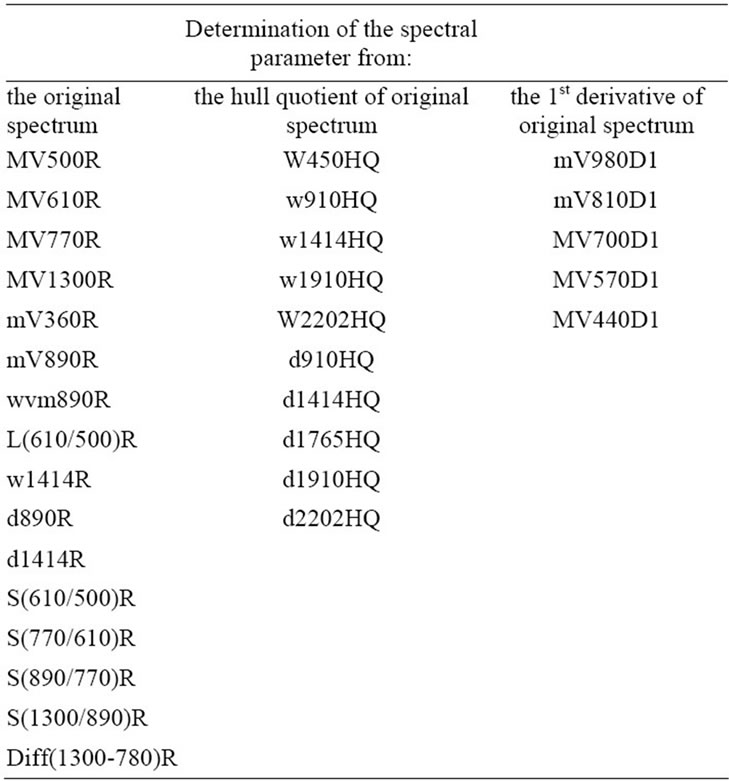
Table 3. The spectral parameter (R = reflectance, HQ = hull quotient, D1 = 1st derivative, mv = Minimum value, Mv = Maximum value, w = relative absorption width, d = relative absorption depth s = slope and diff = difference).
(X-variable) is represented by the bars whose height represents the relative weight of the predictors on the model. In each iteration, the regression runs with the selected significant predictors. After any removal of outlier samples, new predictors appear to be significant. As a result, the variance of validation residuals decrease (Figure 5(c)) and the model quality increases as shown in the predicted versus measured scatter plot (Figure 5(d)). The statistical results of estimated Y-variable show how heavy metals content can be estimated for different spectral wavelength regions with the PLSR methods.
Application of PLSR between the geochemical variables and the spectral parameters:
The 32 spectral parameters were used to describe the geochemical variables: Ni, Co, Cd, Pb, Zn, Cu, Mn, Fe, EC, and pH. The Figures 5, 6 and 7 show the best predicttion of the spectral parameters depending on their relative importance for the models.

Figure 5. An example of the PCA and regression applied between the Pb content and the spectral parameters. (a) PCA; (b) Regression coefficient; (c) Residual validation variance and (d) PLSR model.
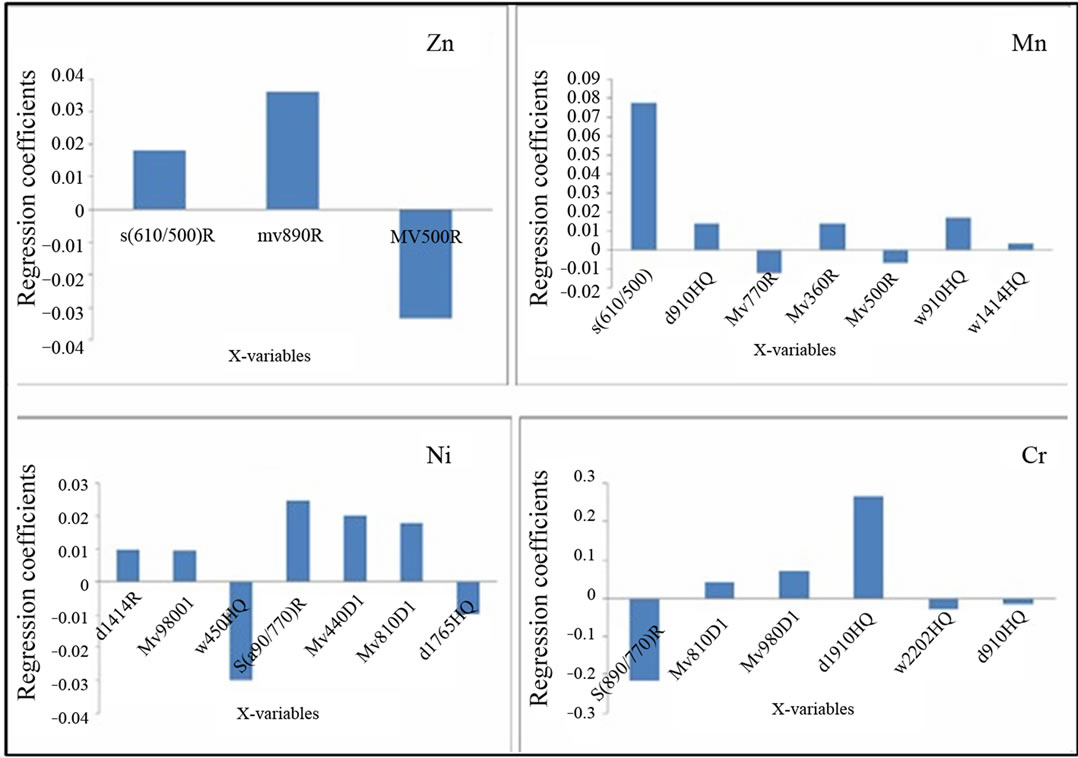
Figure 6. Significant spectral parameters for the geochemical variables: Zn, Mn, Ni and Cr.
The procedure of selection gives 4 significant variables X for Pb which are S(610/500)R, d660HQ, d910HQ and Mv500R. The most significant is S(610/500)R with a PIV = 1.39. RMSEcv = 0.193. The coefficient of correlation is R2 = 0.887 (Figure 5). The results for the Zn, Mn, Ni and Cr are summarized in the following table (see Table 4) and Figure 6. For EC, pH, Fe, Cu and Cd, RMSEcv would be very high although we could select X-variables with a PIV > 1. That’s why, the use of the PLSR did not improve the prediction of these geochemical parameters. Consequently, the geochemical variables that give good results with the predicting model depending on their spectral parameters are by priority orders as follows : Zn > Pb > Mn > Ni > Cr (Figure 7).
Application of the PLSR between the geochemical variables and the original spectra:
The use of PLSR for the prediction of the chemical variables Ni, Cr, Pb, Zn, Cu, Cd, Mn, Fe, EC, and pH on the basis of the spectra values measured by the spectrophotometers leads to the results mentioned in the Table 4 and Figures 8 and 9. The original spectra of the samples were used to describe the geochemical variables. All these geochemical variables with exception of Cu, Cd, the pH and Fe significantly have wavelengths for predicttion in the following the priority order according to the model quality: Mn > Pb > Zn > Cr > Ni (Figure 9).
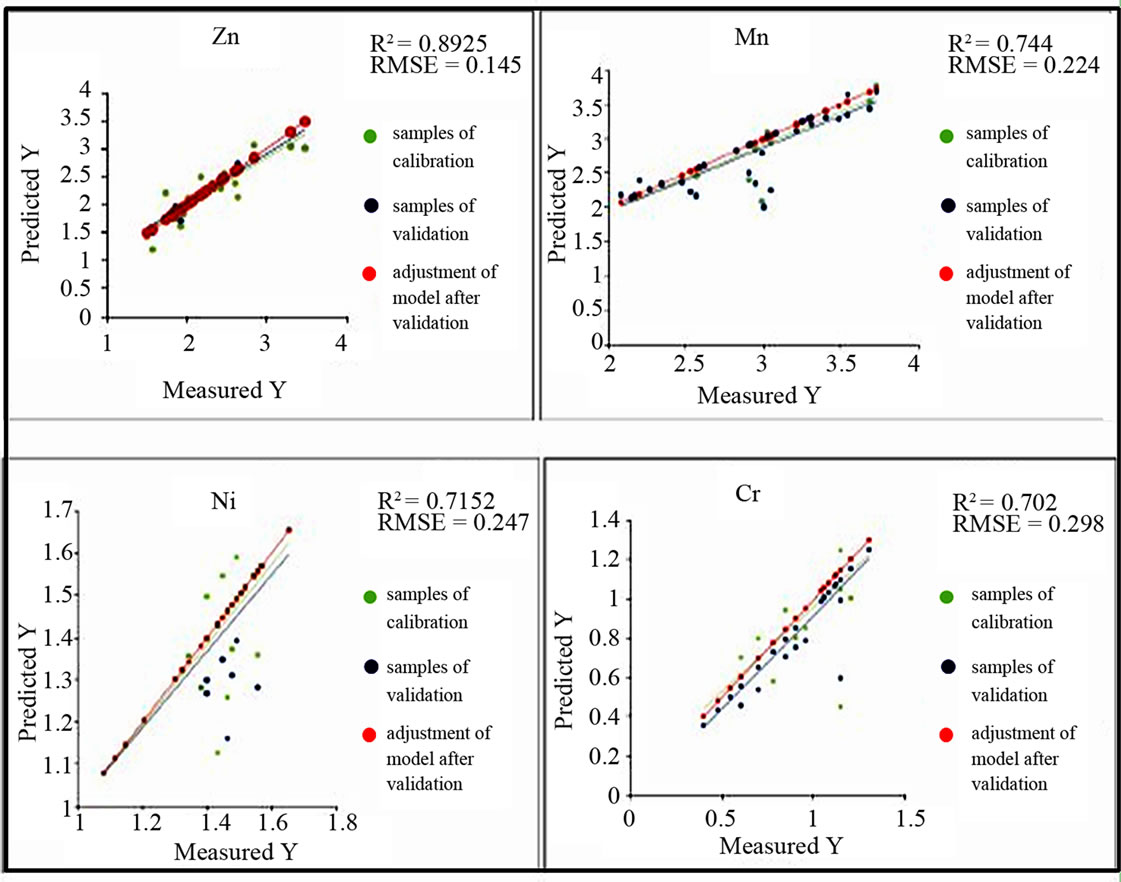
Figure 7. Best predicting Models for spectral parameters.
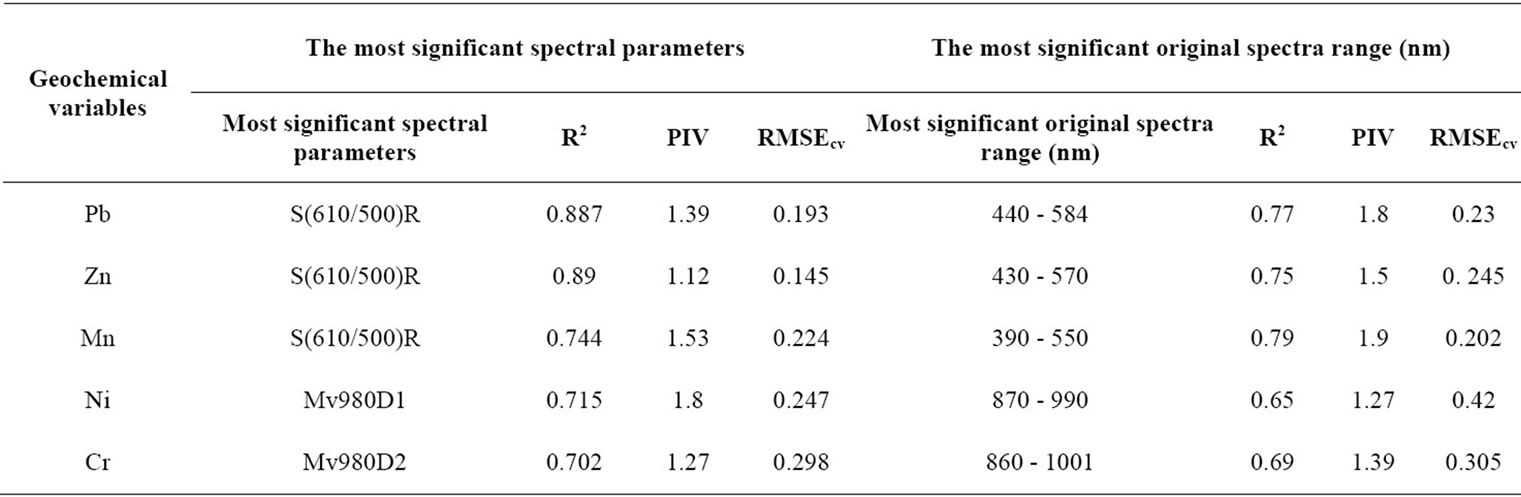
Table 4. The most significant spectral parameters and original spectra range (nm) for Pb, Zn, Mn, Ni and Cr.
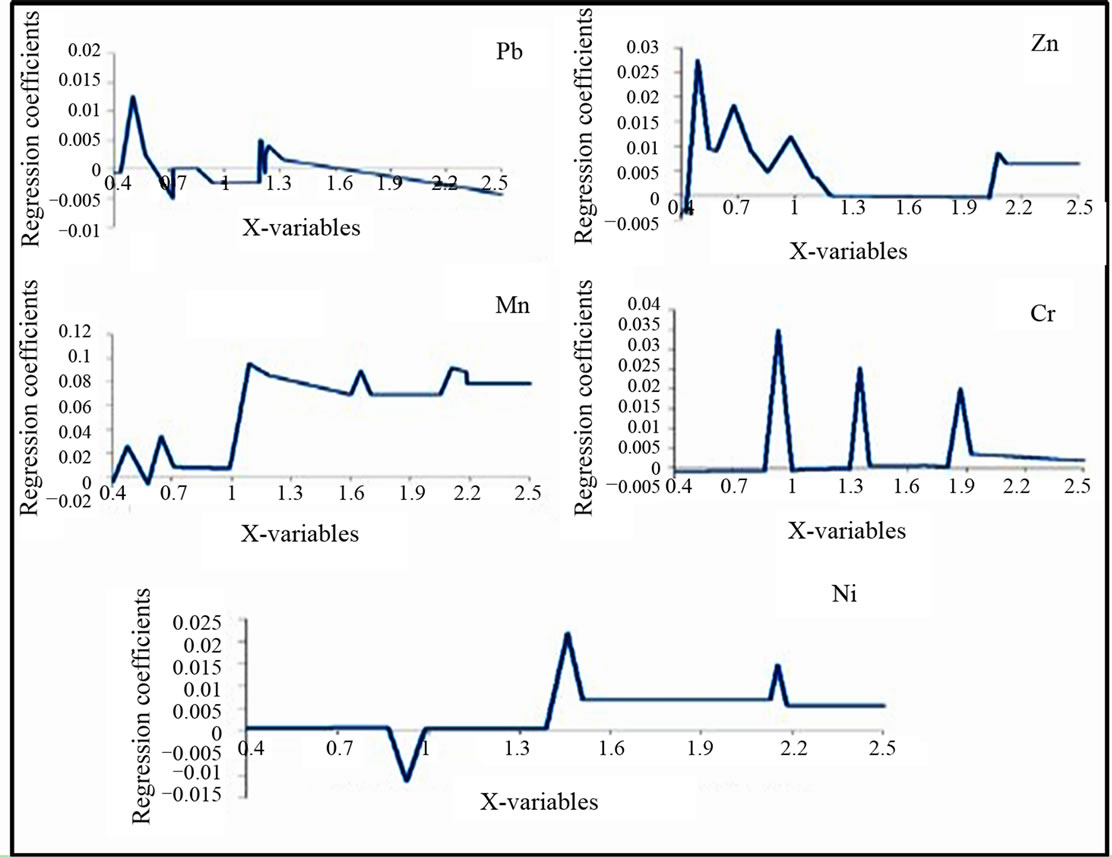
Figure 8. Significant original spectra for the geochemical variables: Pb, Zn, Mn, Ni and Cr.
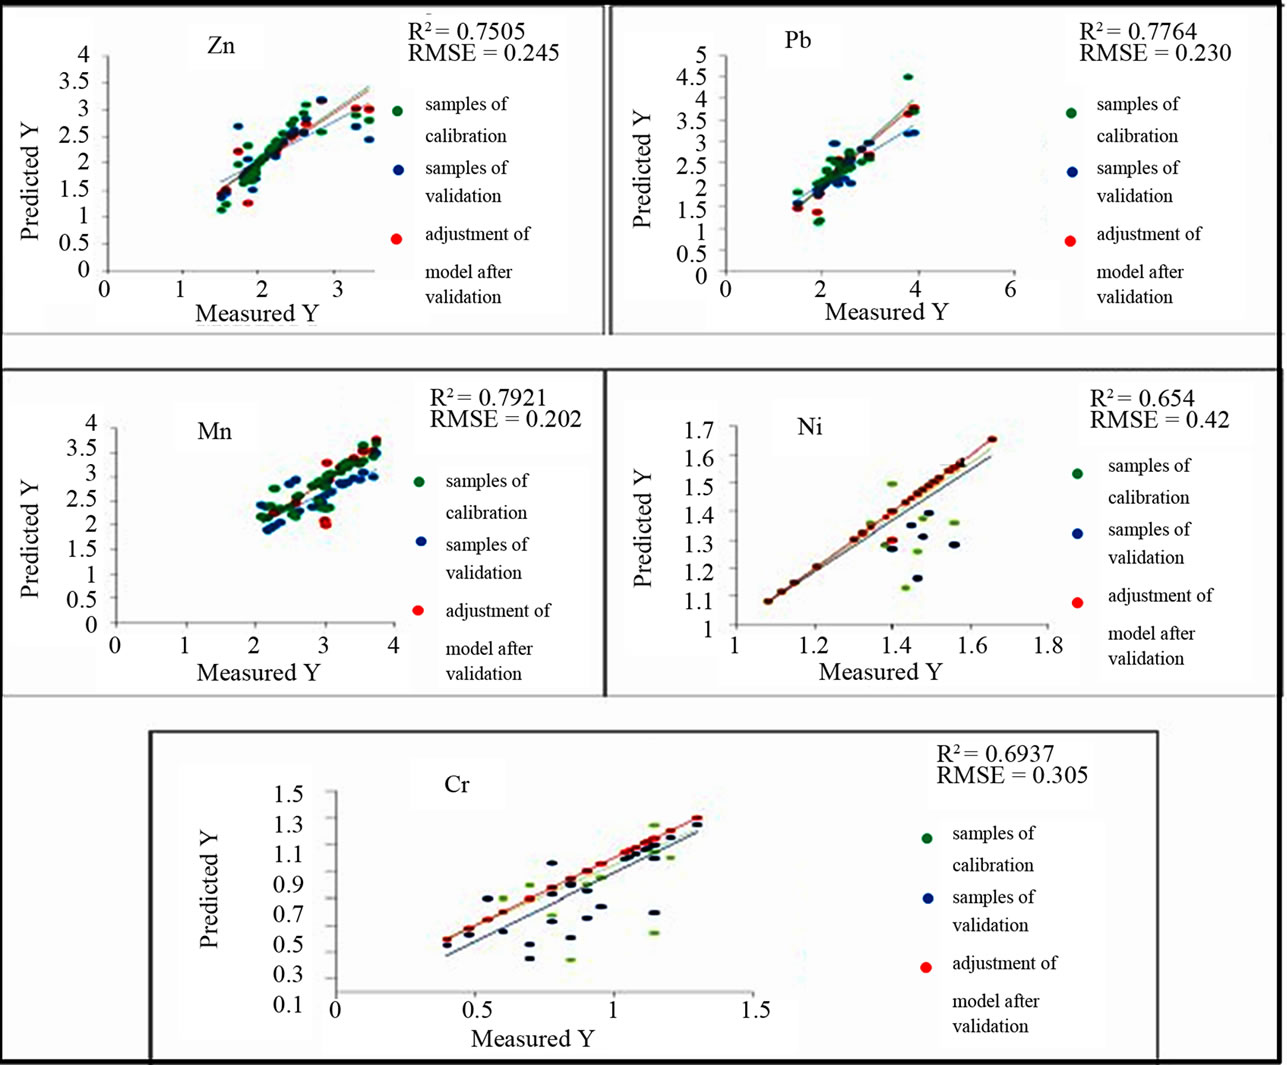
Figure 9. Best predicting models for original spectra.
4. Discussion
For a better understanding of the mechanism that allows the estimation of heavy metals with reflectance spectroscopy, statistical analysis was first made. Figures 5-7 show the correlation coefficients between reflectance and heavy metals across the spectral ranges.
The results concerning the relationships between spectral parameters and heavy metals concentration indicate that Fe oxides play an important role in the prediction of soil heavy metals using reflectance spectra. While applying the PLSR between the geochemical variables and the spectral parameters, the S(610/500)R is a common significant variable for Zn, Mn and Pb. The slope around the wavelength 980 nm (Mv980D1) is generally related to Ni and Cr with respect to other bands which all depend from the crystal field effect. Similarly, we have the same consequences for the application of the PLSR between the geochemical variables and the original spectra. The most predictive region for Pb is 440 - 584 nm, for Zn is 430 - 570 nm and 590 - 770 nm and for Mn is 390 - 550 nm and 580 - 710 nm. But for Ni the most predictive region is 870 - 990 nm and for Cr is 860 - 1001 nm. Iron affects the soil reflectance in the VIR region. This is due to the electronic transition of iron cations (2+, 3+) ([25] BEN-DOR and BANIN, 1995). Our results which are specific for the waste mines are similar than previous findings developed in a general study by Hunt ([39] HUNT et al., 1971c). He showed that the Fe2+ (ferrous) and Fe3+ (ferric) ion are spectrally active in the VIR region: the ferrous ion at 430, 450, 510, 550 and 1000 nm and the ferric ion at 400, 700 and 870 nm. The presence of iron oxides can also be detected by the concave shape of the spectra between 450 and 850 nm. In addition to that, soils which are richer in goethite showed narrower concavity shape and less absorption in the band around 450 nm than soils richer in hematite which had wider concavity and greater absorption in this band ([40] DEMATTE et al., 2004a). Hematite (α-Fe2O3) has Fe3+ ions in octahedral coordination with oxygen. However, goethite (α-FeOOH) has Fe3+ ions with the same coordination but different location of distortions along with the oxygen ligand (OH) which leads to the main absorption feature at around 900 nm ([25] BEN-DOR and BANIN, 1995).
5. Conclusion
Reflectance spectroscopy is a simple and nondestructive analytical method that can be used to predict not only spectral active constituents but also trace elements, which are spectrally feature-less. This study shows that only transition elements, which have an unfilled d shell and are present at very high concentration, can exhibit their inherent absorption features. The spectrally interpreted NIR minerals can serve as good spectral indicators for different pollutant metals. Advanced multivariate statistical regression technique, PLSR is able to model environmental-geochemical parameters with laboratory spectra parameters. It was possible to predict five out of ten elements with high accuracy. Best R2 between predicted and chemically analyzed concentrations were for: Mn, 0.79; Pb, 0.77; Zn, 0.75; Cr, 0.69; and Ni, 0.65. Results for Cd, Cu, Fe, pH and EC were not significant. Correlation analysis revealed that most important wavelengths for prediction could be attributed to the absorption features of iron and iron oxides. These results indicate that it is possible to predict heavy metals in soils contaminated by waste mine using the rapid and economic reflectance spectroscopy. For future investigations, hyperspectral sensor may be useful for fitting specific spectral regions and for models to optimize the estimation of heavy metals content.
REFERENCES
- H. Fritze, P. Jarvinen and R. Hiukka, “Near-Infrared Characteristics of Forest Humus Are Correlated with Soil Respiration and Micro Bial Biomass in Burnt Soil,” Biology and Fertility of Soils, Vol. 18, No. 1, 1994, pp. 80- 82. doi:10.1007/BF00336449
- A. Davies, “Uncertainty Testing in PLS Regression, Spectroscopy Europe,” Norwich near Infrared Consultancy, 2001.
- R. N. Clark, “Spectroscopy off Rock’n’rolls and Minerals, and Principles off Spectroscopy,” Remote Sensing for the Earth Sciences, Vol. 3, 1999, pp. 3-58.
- D. F. Malley, “Near-Infrared Spectroscopy as a Potential Method for Routine Sediment Analysis to Improve Rapidity and Efficiency,” Water Science and Technology, Vol. 37, No. 6-7, 1998, pp. 181-188. doi:10.1016/S0273-1223(98)00197-8
- M. Confalonieri, F. Fornasier, A. Ursino, F. Boccardi, B. Pintus and M. Odoardi, “The Potential of Near-Infrared Reflectance Spectroscopy as a Tool for the Chemical Characterisation of Agricultural Soils,” Journal of near Infrared Spectroscopy, Vol. 9, No. 2, 2001, pp. 123-131. doi:10.1255/jnirs.299
- D. C. Slaughter, M. G. Pelletier and S. K. Upadhyaya, “Sensing Soil Moisture Using NIR Spectroscopy,” Applied Engineering in Agriculture, Vol. 17, No. 2, 2001, pp. 241-247.
- G. D. Smith, A. Jervis, M. Lennartsson and W. F. Bourne, “Laboratory Methods of Estimating Potentially Mineralizable Nitrogen in Organic Potting Mixes. II. Development of near Infrared Reflectance Spectroscopy Method,” Communications in Soil Science and Plant Analysis, Vol. 32, 2001, pp. 2769-2781. doi:10.1081/CSS-120000960
- C. Marcin, M. Niklińska and F. Beese, “Near-Infrared Spectroscopy for Analysis of Chemical and Microbiological Properties of Forest Soil Organic Horizons in a Heavy-Metal-Polluted Area,” Biology and Fertility of Soils, Vol. 44, No. 1, 2002, pp. 171-180.
- G. W. McCarty, J. B. Reeves III, V. B. Reeves, R. F. Follet and J. M. Kimble, “Mid-Infrared and Nearinfrared Diffuse Reflectance Spectroscopy for Soil Carbon Measurement,” Soil Science Society of America Journal, Vol. 66, No. 2, 2002, pp. 640-646. doi:10.2136/sssaj2002.0640
- D. F. Malley, P. D. Martin, L. M. McClintock, L. Yesmin, R. G. Eilers and P. Haluschak, “Feasibility of Analyzing Canadian Prairie Agricultural Soils by Near Infrared Reflectance Spectroscopy,” In: A. M. C. R. Giangiacomo, Ed., Near Infrared Spectroscopy: Proceedings of International Conference, 9th, Verona, Italy, June 1999, NIR Publ., Chichester, UK, 2000, pp. 579-585.
- T. Kemper and S. Sommer, “Estimate of Heavy Metal Contamination in Soils after a Mining Accident Using Reflectance Spectroscopy,” Environmental Science & Technology, Vol. 36, No. 12, 2002, pp. 2742-2747. doi:10.1021/es015747j
- D. F. Malley and P. C. Williams, “Use of Near-Infrared Reflectance Spectroscopy in Prediction of Heavy Metals in Freshwater Sediment by Their Association with Organic Matter,” Environmental Science & Technology, Vol. 31, No. 12, 1997, pp. 3461-3467. doi:10.1021/es970214p
- P. Sainfeld, “Les gîtes Plombo-Zincifères de la Tunisie,” Annales des Mines et de la Géologie N 9, 1952, 252 p.
- G. Roussev, B. Radivoev and A. Papov, “Gisement de Plomb de Jalta,” Rapport Géologique, Compagne de Recherche 1974-1975. Société Tunisienne d’Expansion Minière. Convention de Renouvellement des Réserves des Mines en Activité du 11.06.1974, Technoexportstroy, Bulgarproremi, Bulgarie, 1976, 101 p.
- S. Boussen, “Impacts des Rejets de la Mine de Jalta sur la Distribution du Plomb et de Zinc dans l’Environnement Pédologique de la Région de Ghezala (Mateur),” Master en Géologie, Faculté des Sciences de Tunis El Manar, 2004, 87 p.
- J. Massin, “Mine of Bougrine-Rapport New,” ONM, Tunis, 1972.
- A. Guedria, “Comportement des Métaux (Pb-Zn) dans des sols Encroutés par le Calcaire (Région de Bougrine, Tunisie): Application à la Prospection Géochimique de ces Métaux,” Thèse en Géologie, Université d’Orléans, 1981, 135 p.
- A. Sebai, “Impacts des Rejets Miniers sur l’Environnement Cas des Bassins versants des Oueds Méllègue et Tessa (Tunisie Septentrionale),” Thèse, Faculté des Science de Tunis, 2007, 259 p.
- Mr. Thompson, “Analytical Methods in Applied Environmental Geochemistry,” Applied Environmental Geochemistry, Academic Close Inc., London, 1983, 501 p.
- F. R. Siegel, “Environmental Geochemistry off Potentially Toxic Metals,” Springer-Verlag, Berlin, 2002.
- S. Wold, Mr. Sjostrom and L. Eriksson, “PLS-Regression: BASIC Tool off Chemometrics Has,” Chemometrics and Intelligent Systems Laboratory, Vol. 58, 2001, pp. 109- 130.
- L. Wang, Q. Z. Flax, D. Jia, H. S. Shi and X. H. Huang, “Analysis One Possibilities of Multispectral Dated for Quantitative Retrieving Soil Nutrition Element Content,” Department off Earth Sciences, Nanjing University, Direct Access Science 2009, 2007.
- E. Ben-Dor and A. Banin, “Near Infrared Analysis Have Has Rapid Method to Simultaneously Evaluate Several Soil Properties,” American Newspaper off Soil Society Science, Vol. 159, 1995, pp. 259-269.
- E. Ben-Dor, K. Patkin, A. Banin and A. Karnieli, “Mapping off Several Soil Properties Using DAIS-7915 Hyperspectral Scanner Dated a Puts Study over Clayey Soils in Israel,” International Newspaper off Remote Sensing, Vol. 26, No. 6, 2002, pp. 1043-1062.
- E. Ben-Dor, N. R. Goldlshleger, Y. Benyamini, Mr. Agassi and D. Blumberg, “Spectral the Reflectance Properties off Soil Structural Crust in the 1.2-2.5 μm Spectral Area,” Soil Science Society American Newspaper, Vol. 67, No. 1, 2003, pp. 289-294. doi:10.2136/sssaj2003.0289
- S. Estifanos, “Spectral Indicator for Assessing Pollution in Epithermal Gold Mining Area off Radalquilar Spain,” Thesis, International Institutes for Geo-Information Science and Earth Observation, Spain, 2006, 90 p.
- C. Gomez, C. Delacourt, P. German, P. Ledru and R. Wackerle, “Using ASTER Remote Sensing Dated Set for Geological Mapping in Namibia,” Physics and Chemistry of the Earth, Vol. 30, No. 1-3, 2005, pp. 97-108.
- L. Kooistra, R. Wehrens, R. S. E. W. Leuven and L. M. C. Buydens, “Possibilities of Visible near Infrared Spectroscopy for the Assessment of Soil Contamination in River Floodplains,” Analytica Chimica Acta, Vol. 446, No. 1-2, 2001, pp. 97-105. doi:10.1016/S0003-2670(01)01265-X
- L. Kooistra, “Incorporating Spatial Variability in Ecological Risk Assessment of Contaminated River Flood Plains,” PhD Thesis, Radbound University Nijmengen, 2004, 171 p.
- M. I. Luleva, “Identification off Soil Property Variation Using Spectral and Statistical Analyses One Field and ASTER Dated. With Box Study off Tunisia,” Thesis, International Institute for Geo-Information Science and Earth Observation, Enschede, the Netherlands, 2007, 101 p.
- K. Thomas and S. Stefan, “Estimate off Heavy Metal Contamination in Soils after has Mining Accident Using Reflectance Spectroscopy,” Environmental Science and Technology, Vol. 36, No. 12, 2002, pp. 2742-2747. doi:10.1021/es015747j
- Y. L. Weng, P. Gong and Z. L. Zhu, “Soil Salt Content Estimate in the Yellow to Rivet Satellite Delta with Hyperspectral Dated,” Canadian Journal of Remote Sensing, Vol. 34, No. 3, 2008, pp. 259-270.
- Y. Wu, J. Chen, X. Wu, Q. Tian and J. Ji, “Feasibility of Reflectance Spectroscopy for the Assessment of Soil Mercury Contamination,” Environmental Science & Technology, Vol. 39, No. 3, 2005, pp. 873-878. doi:10.1021/es0492642
- Y. Wu, J. Chen, X. Wu, Q. Tian, J. Ji and Z. Qin, “Possibilities of Reflectance Spectroscopy for the Assessment of Contaminant Elements in Suburban Soils,” Applied Geochemistry, Vol. 20, No. 6, 2005, pp. 1051-1059. doi:10.1016/j.apgeochem.2005.01.009
- Y. Z. Wu, J. Chen, J. F. Ji, P. Gong, Q. L. Liao, Q. J. Tian and H. R. Ma, “A Mechanism Study of Reflectance Spectroscopy for Investigating Heavy Metals in Soils,” Soil Science Society of America Journal, Vol. 71, 2007, pp. 918-926.
- G. A. Swayze and R. Clark, “Spectral Identification off Minerals Using Imaging Spectrometry Data: Evaluating the Effects off Spectral Signal to Noise and Resolution Using the Tricorder Algorithm: In Summaries off the Fifth Annual JPL airborne Earth Science Workshop,” JPL Publication 95-1, 1995, pp. 157-158.
- G. A. Swayze, R. N. Clark, K. S. Smith, P. L. Hageman, S. J. Sutley, R. M. Pearson, G. S. Rust, P. H. Briggs, A. L. Meier, M. J. Singleton and S. Roth, “Using Imaging Spectroscopy as Screening Tool for Evaluating Sources of Acid Mine Drainage: Ground Truth from the California Gulch Superfund Site at Leadville Colorado,” Jet Propulsion Laboratory Pub. 97-21, 1998, pp. 385-389.
- G. A. Swayze, et al., “Using Imaging Spectroscopy to Map Acidic Undermines Waste,” Environmental Science and Technology, Vol. 34, No. 1, 2000, pp. 47-54. doi:10.1021/es990046w
- G. R. Hunt, J. W. Salisbury and C. J. Lenhoff, “Visible and Near-Infrared Spectra of Minerals and Rocks: Halides, Phosphates, Arsenates, Vanadates and Borates,” Modern Geology, Vol. 3, 1971, pp. 121-132.
- J. A. M. Demattê, R. C. Campos, M. C. Alves, P. R. Fiorio and M. R. Nanni, “Visible-NIR Reflectance: A New Approach on Soil Evaluation,” Geoderma, Vol. 121, No. 1-2, 2004, pp. 95-112. doi:10.1016/j.geoderma.2003.09.012