Natural Science
Vol.5 No.3(2013), Article ID:29030,9 pages DOI:10.4236/ns.2013.53049
SNP barcodes generated using particle swarm optimization to detect susceptibility to breast cancer
![]()
1Department of Electronic Engineering, National Kaohsiung University of Applied Sciences, Kaohsiung, Taiwan
2Department of Chemical Engineering & Institute of Biotechnology and Chemical Engineering, I-Shou University, Kaohsiung, Taiwan; *Corresponding Author: chuang@isu.edu.tw
3Department of Biomedical Science and Environmental Biology, Center of Excellence for Environmental Medicine, Cancer Center, Kaohsiung Medical University Hospital, Kaohsiung Medical University, Kaohsiung, Taiwan; *Corresponding Author: changhw@kmu.edu.tw
Received 31 October 2012; revised 30 November 2012; accepted 14 December 2012
Keywords: Single Nucleotide Polymorphism; Particle Swarm Optimization; SNP-SNP Interaction; Breast Cancer
ABSTRACT
Considerable research has been devoted to investigating variations in disease susceptibility using SNPs associated with the individual cooccurrence of single nucleotide polymorphisms (SNPs) in genetic and phenotypic variability. Without the raw genotype data, these association studies are difficult to conduct and often omit SNP interactions, thus limiting their reliability and potential applicability. In this study, we apply a particle swarm optimization (PSO) algorithm to detect and identify the best protective SNP barcodes (i.e., SNP combinations and genotypes with a maximum difference between cases and controls) associated with chronic dialysis patients. SNP barcodes containing different numbers of SNPs were computed. We evaluated the combined effects of 27 SNPs related to nine published epigenetic modifier-related genes on breast cancer. Eleven different SNP combinations were found to be protective associated with the risk of breast cancer (odds ratio, OR < 1.0; p-value < 0.05). The results suggest that SNPs 1 and 2 (gene BAT8), 9, 10, 11 and 13 (DNMT3A), 20 and 21 (EHMT1), 24 (HDAC2), 25 (MBD2), and 27 (SETDB1) are statistically very significant and that there may be interactive effects that play a role in the prevalence of breast cancer. A PSO-based on the Chi-Square test process allowed us to quickly identify the significant SNP combinations in a multi-locus association analysis, and then further detect interactive effects on complex genotypes amongst the SNPs. The PSO algorithm is robust and precisely identifies the best protective SNP barcodes. It can identify potential combined epigenetic modifier-related genes together with the SNP barcodes that were deemed protective against breast cancer by in silico analysis.
1. INTRODUCTION
Genome-wide association studies (GWAS) involve a vast amount of single nucleotide polymorphism (SNP) data from several genes which is associated with genotype frequencies between cases and controls and can be used to investigate disease susceptibility. Studies of gene variations associated with hereditary phenotypes are becoming increasingly popular and contribute to the detection of significant effects on disease susceptibility [1-6].
A total of 27 SNPs from nine epigenetic modifier-related genes (BAT8, DNMT1, DNMT3A, DNMT3B, EHMT1, HDAC2, MBD2, MTHFR and SETDB1) were selected to investigate their association with breast cancer [7]. Previous research only considered the analysis of the effect of individual SNPs, but investigating their association with SNPs can provide deep insight into disease susceptibility. Although the individual role of these epigenetic modifier-related genes was addressed in [7], the combined effect of gene (or SNP) interactions in relation to breast cancer was not addressed. This study is similar to many association studies in that only genotype frequencies were published without supplementary genotypic raw data.
Analysis of SNP-SNP interactions is used to investigate polygenic diseases. However, it remains a challenge to collect large-scale combinations of SNP data and analyze the possible SNP-SNP interactions. The simultaneous evaluation of multiple SNPs generates many possible combinations of alleles in SNP-SNP interactions. The possible combinations of SNP interactions between cases and controls is estimated to be  , where N is the total number of SNPs or factors, and M is the selected number of SNPs. Machine learning and data mining methods are widely used in GWAS data analysis, but current methods aren’t robust enough to simultaneously evaluate the complex interactions for all tested SNPs, though some computational approaches have been developed to examine epistasis in family-based and case-control association studies [8-16].
We hypothesize that interactions between the polymorphisms of epigenetic modifier-related genes may have a synergistic or non-additive effect on the pathogenesis of a disease and can explain differences in disease susceptibility. We propose the PSO method to generate SNP barcodes of genotypes to predict disease susceptibility and evaluate risk factors. The best combination of SNPs with genotypes can be verified by determining its risk factor in terms of odds ratio and confidence intervals. We systematically evaluated the joint effects of 27 SNP combinations of nine related genes involved in breast carcinogenesis. The SNP barcodes generated by the PSO algorithm were statistically evaluated by the odds ratio (OR) to predict dialysis susceptibility in breast cancer.
2. METHODS
We introduce a particle swarm optimization method that generates the best SNP barcodes to combine SNPs with their corresponding genotypes. A characteristic of PSO is its fast convergence, allowing for the quick identification of optimal solutions in a wide solution space, meaning that we can look for the optimal protective SNP barcodes.
2.1. Particle Swarm Optimization
PSO is an efficient evolutionary computation learning algorithm developed by Kennedy and Eberhart [17] to describe an automatically evolving system through the simulation of the social behavior of organisms, e.g., the social behavior of birds in a flock or fish in a school. PSO was designed for use in practical applications and simulates social behavior based on information exchange. Within a problem space, each potential result can be regarded as a vector in a swarm, where the vector is referred to as a particle. Each particle uses its own memory and knowledge gained from the swarm as a whole to find an optimal solution. Each particle is evaluated by an objective function to detect good experience, and particles can share the experience amongst the swarm. These experiences can be inform the search direction to lead the swarm toward the optimal solution. This superior strategy effectively mines the optimal regions of complex search spaces. The basic elements of PSO are as follows:
1) Particle: In this study each particle can be regarded as a problem solution.
2) Population: A swarm population consisting of n particles.
3) Particle position, xi: Each candidate solution can be represented by a D-dimensional vector; the ith particle can be described as , where xiD is the position of the ith particle with respect to the Dth dimension. Each dimensional vector in the particle position is defined by the number of selected SNPs and the corresponding genotypes for the associated SNPs.
4) Particle velocity, vi: The velocity of the ith particle is represented by , where viD is the velocity of the ith particle with respect to the Dth dimension. The new locations of particles are chosen by adding vi to the coordinate of the particle position xi; PSO operates this process by adjusting vi. In addition, the velocity of a particle is restricted within
 .
.
5) Inertia weight, w: The inertia weight is used to control the impact of a particle’s previous velocity on its current velocity. This control parameter affects the tradeoff between the particle’s abilities for exploration and exploitation.
6) Individual best value, pbesti: pbesti is the position of the ith particle with the highest value of the objective function during a given iteration. It can be regarded as a best current solution for the ith particle.
7) Global best value, gbest: The best position of all pbest particles is called the global best gbest. It can be regarded as the best current solution of SNP barcodes in all particles.
8) Termination criteria: The process is stopped after the maximum allowed number of iterations is reached.
The PSO procedure is shown in Figure 1 and can be divided into the following steps: 1) initialization of particles; 2) particle evaluation with an objective function; 3) selection of the particles’ pbest and gbest; and 4) updating of the particles’ velocity and position. These procedures are repeated in successive iterations until the termination conditions are reached.
2.2. Encoding Schemes
In PSO, each particle was designed in a format that enabled us to express a particular amount of SNP and genotype combinations. A particle is defined in a vector that consists of the number of selected SNPs and their corresponding genotypes; SNPs cannot be repeatedly selected. In this paper, we define the SNP barcode to represent a solution with selected SNPs and their corresponding genotypes. The particle encoding can thus be represented by:
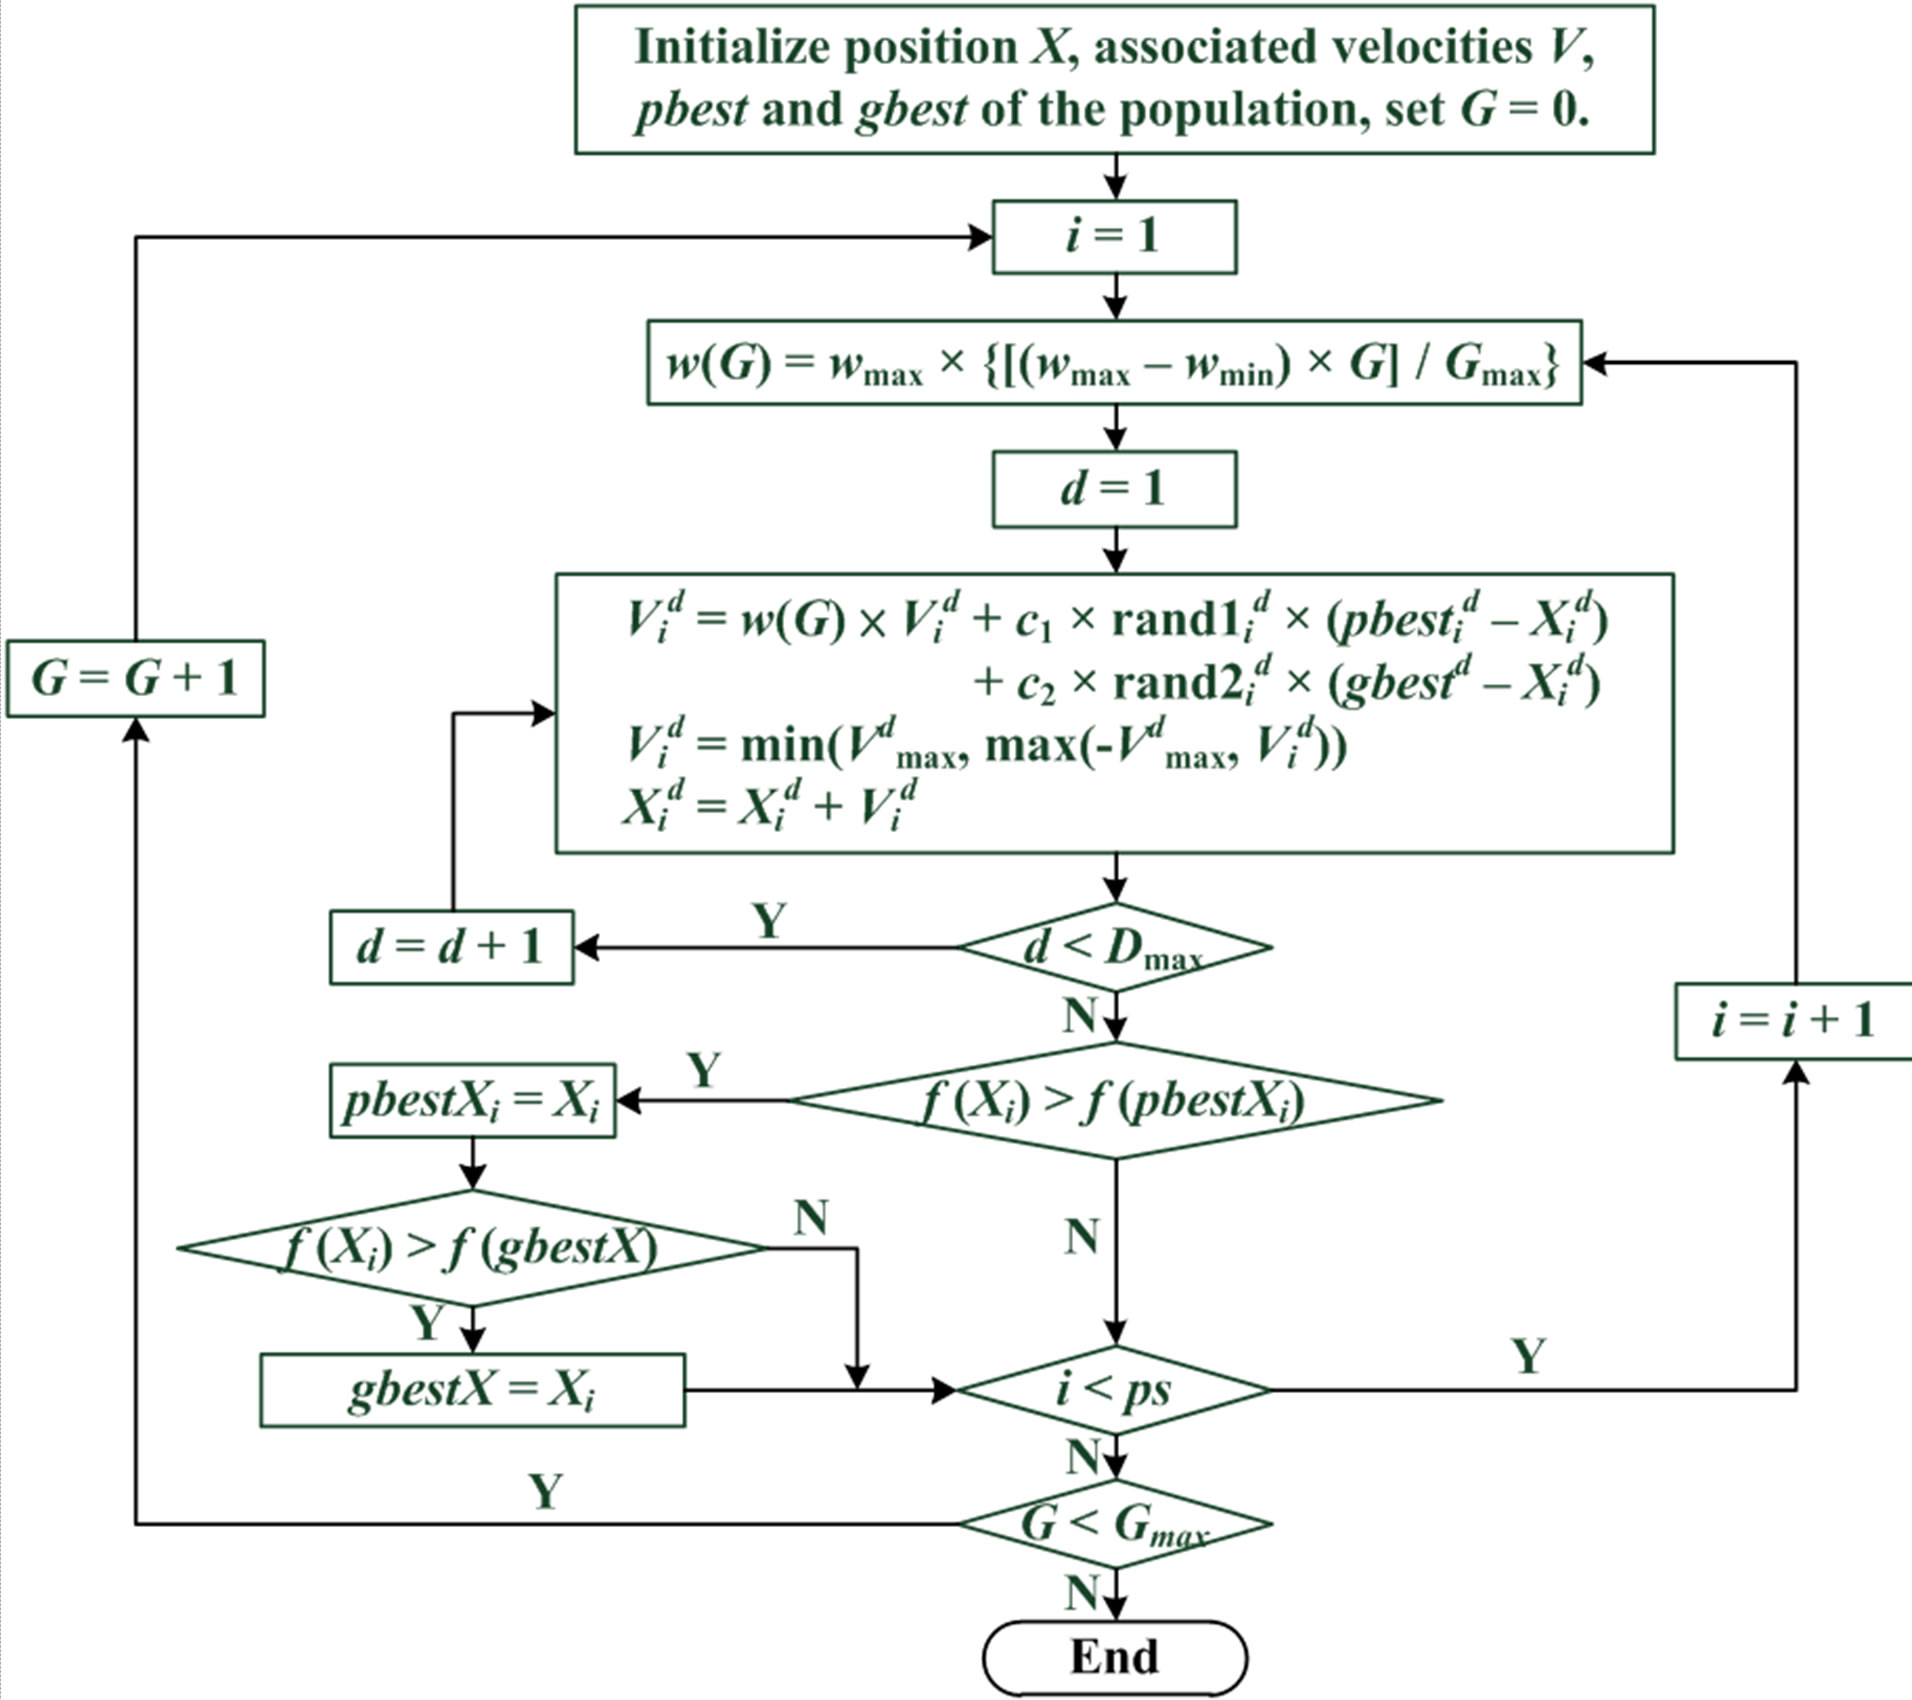
Figure 3. PSO flowchart.
i: the ith particle from 1 to ps; G: the Gth generation from 1 to Gmax; d: the dth dimension from 1 to Dmax; : the value of dth dimension of ith particle; f(): objective function; ps: population size; Gmax: maximum generations; Dmax: maximum dimensions; w: intertia werght.

where SNPi,j represents the selected SNP, Genotypei,j represents the three possible genotypes once SNPi,j is selected, n represents the size of the population, and m represents the number of SNPs selected.
2.3. Population Initialization
Based on the above encoding schemes, the population of particles is randomly generated over the search space. SNPs are selected based on a randomly generated value between XSNPmin = 1 and XSNPmax = 27. In addition, the three genotypes are randomly generated between 1 and 3. In each particle, the selected SNPs between SNP1 and SNPm are not the same. If a given SNP is found to be repeated in a particle, the SNP is randomly generated between XSNPmax and XSNPmin until it is different. For example, let X = (2, 3, 7, 3, 1, 3). In this representation of the particle, SNPs 2, 3, and 7 and genotypes 3, 1, 3 are chosen. In this case, the selected SNPs with their corresponding genotypes are represented as (2, 3), (3, 1), and (7, 3). The initial velocity for a particle is based on a randomly generated value in the interval (0, 1).
2.4. Objective Function
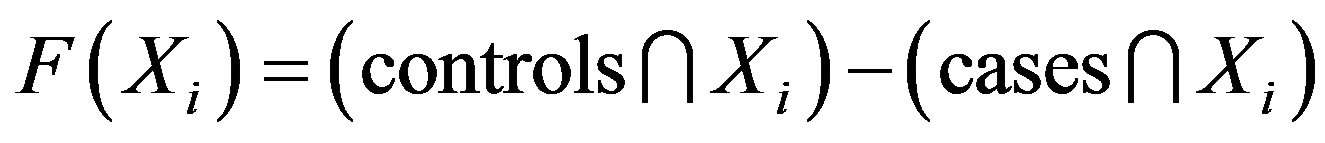
In this study, an objective function is used to compute the SNP barcode for the difference between the cases and controls; the particle fitness is represented as a value computed by this objective function. The maximum difference between cases and controls has the highest fitness value. We use set theory to evaluate the fitness value, with the equation defined as follows:
 (1)
(1)
where controls represents the total number of SNP interactions in the control group and cases represents the total number of SNP interactions in the case group. Xi represents the ith particle. The total number of intersections of the controls and the ith particle is calculated as n(controls∩Xi). The total number of intersections of the cases and the ith particle is calculated as n(cases∩Xi). For example: X = (SNP1,2, Genotype2,1) is used to evaluate the number of matching conditions in the cases and controls. The case group contained 89 cases and the control group had 191 controls. According to Eq.1, the value is determined by subtracting 89 from 191, leaving 102.
2.5. Selection of pbest and gbest
When moving, particles keep a record of their personal best position (pbest) and the global best position (gbest). If a particle’s fitness value in the current iteration is better than the fitness value of pbest form the previous iteration, then the position and fitness value of pbest are updated with the current position and fitness value. If the fitness value of pbest is better than gbest in the previous iteration and is the best value in the current iteration, gbest is updated by pbest. Each particle then adjusts its direction based on pbest and gbest in the following iteration.
2.6. Updating Particle Velocity and Position
The PSO algorithm updates the particle’s velocity and thus moves its position (i.e., possible solution), thus allowing us to search for a better solution. In each generation, the position and velocity of the ith particle are updated with the pbesti and gbest of the swarm population. The updating equations can be formulated as:
 (2)
(2)
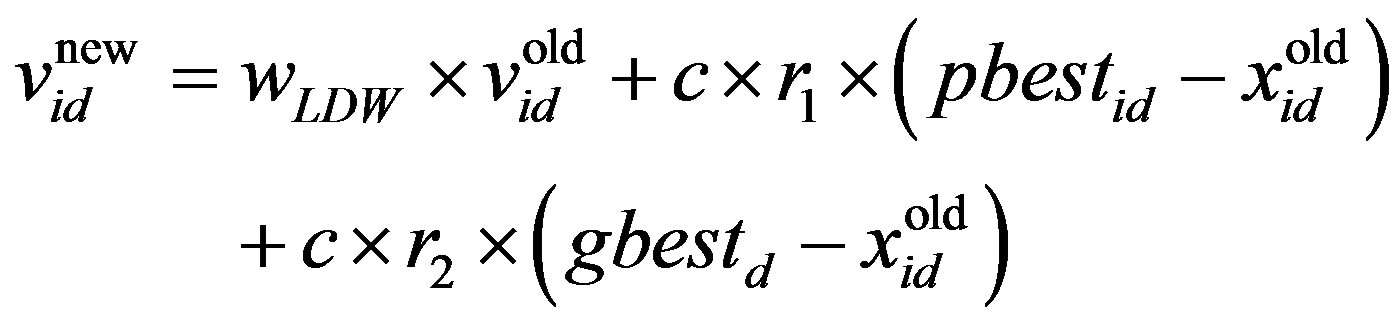 (3)
(3)
 (4)
(4)
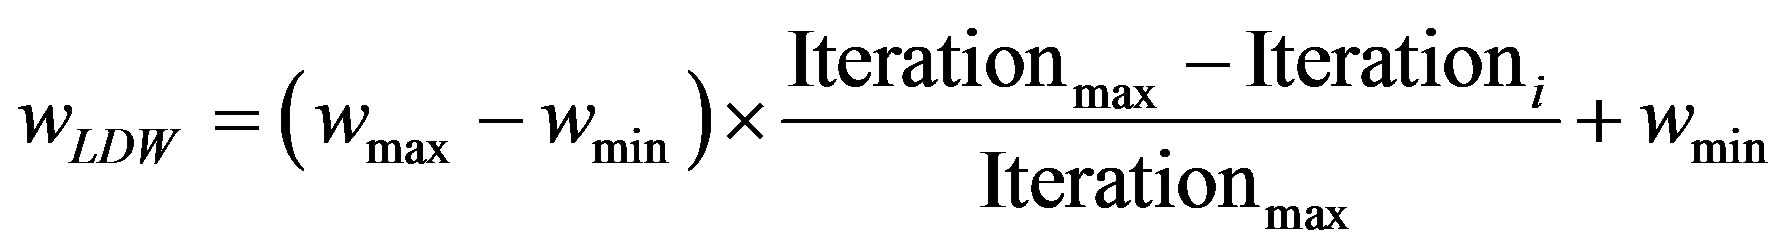
where w is the inertia weight, wmax is 0.9, wmin is 0.4 and Iterationmax is the maximum number of allowed iterations. This inertia weight is a positive linear function of time that changes with the generations; r1 and r2 are random numbers between (0, 1), and c1 and c2 are acceleration constants that control how far a particle moves in a single generation. The velocities  and
and  respectively denote the velocities of the new and old particles;
 is the current particle position, and
  is the updated particle position. The velocity implies the degree to which a particle’s position should be changed at a particular moment in time, such that equals that of the global best position, i.e., the velocity of the particle flying toward the best position. To obtain a search solution, the particle velocities in each dimension are restricted within [Vmin, Vmax]D, and the particle positions are restricted within [Xmin, Xmax]D, thus determining the size of the steps the particle is allowed to take through the solution space.
2.7. Parameter Settings
The population size parameter was set to 50. PSO termination condition is reached at a pre-specified number of iterations (100 in this case). The starting value of the inertia weight w is set to 0.9 and the final value is set to 0.4 [18]. The acceleration (learning) factors c1 and c2 are 2 [19]. These parameters have been optimized by Kennedy and Eberhart [17].
2.8. Statistical Analysis
We used the odds ratio (OR) and p-value of Pearson Chi-Square test, which are commonly used criteria to determine performance [20].
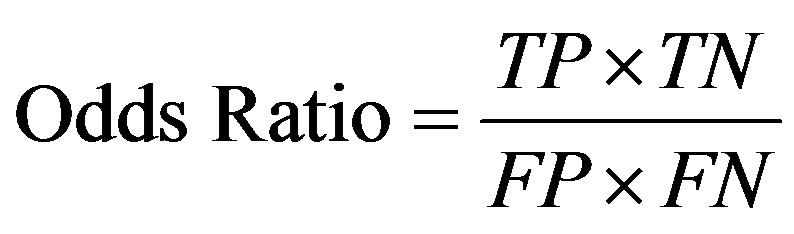 (5)
(5)
TP, TN, FN, and FP respectively represent the number of true positives, true negatives, false negatives and false positives. For statistical analysis with SPSS version 19.0 (SPSS Inc., Chicago, IL), the odds ratio are used to determine the best SNP barcode and quantitatively measure the risk of disease; the p-values are used to prove that the SNP barcode is statistically significant for the difference between cases and controls.
3. RESULT
3.1. Data Set
The datasets were obtained from the epigenetic modifiers (49 SNPs for 10 genes) in a breast cancer association study [7] and consisted of the SNPs and clinical statuses for 4373 cases and 4556 controls. Except for the MTHFR gene which, according to [7] contains only one SNP, the other genes chosen for this study (BAT8, DNMT1, DNMT3A, DNMT3B, EHMT1, HDAC2, MBD2, and SETDB1) all had 27 SNPs, with details shown in Table 1. The SNPs in the original data [7] consist of different numbers of individuals; therefore, the number of each SNP needs to be normalized to fit the same number. The new data was randomly generated according to the frequency of the original data; however, the output still obeyed the final frequency for each SNP for the whole dataset. All the SNP data from the data source are adjusted to the same sum number, (5000) for all genotype distributions. For example, in the SNP1 (gene, BAT8; dBSNP ref, rs535586), the sums of the values with three genotypes (i.e., AA, Aa, and aa) in cases is 4373. First, the percentage for each genotype in SNP1 is calculated as “original data*/sum (%)”, i.e., 1930/4373 (44%) for AA, 1936/4373 (44%) for Aa, and 507/4373 (12%) for aa, where the symbol * indicates that the original data was derived from the SNP dataset before normalization. According to this percentage, the modified data for SNP1 was calculated by multiplying the percentage with the sum of the complete dataset (SNP number adjusted to 5000), i.e., 44% × 5000 (= 2200) for AA, 44% × 5000 (= 2200) for Aa, and 12% × 5000 (= 600) for aa. Therefore, the modified data for SNP1 has been adjusted to the sum of 5000 (2200 + 2200 + 600 = 5000).
3.2. Evaluation of Breast Cancer Susceptibility in 27 Separate SNPs from Nine Epigenetic Modifier-Related Genes
Table 1 shows the performance (OR and 95% CI) for each SNP from nine epigenetic modifier-related genes (BAT8, DNMT1, MTHFR, DNMT3A, DNMT3B, EHMT1, HDAC2, MBD2, and SETDB1). Some SNPs (such as SNPs 1, 11, and 21 listed in Table 1) with certain genotypes display a statistically significant OR (p-value < 0.05) for breast cancer with OR values ranging from 1.16 to 0.90. The other SNPs show no statistically significant OR for chronic dialysis patients.
3.3. Identification of SNP-SNP Interactions with Maximum Differences between Cases and Controls Using PSO
Table 2 shows the 11 2-SNP barcodes selected by systematic sampling, listed in order of the magnitude of difference between cases and controls from maximal to minimal. Among the combinations, 2-SNP barcode with their corresponding genotypes, namely SNPs (1, 2) with genotype 1-1, [rs535586-AA]-[rs652888-AA], showed the maximal difference (135) between the controls and cases (1479 vs. 1344). Similarly, 3 and 27 combined-SNP barcodes with the best performance (the largest difference between controls and cases) were mined using the GA. The left side of Table 3 shows only two to nine SNPs for the combinational analysis. For example, in a 3-SNP combination, the barcode consists of SNPs (1, 2, 21) with genotype 1-1-2, i.e., [rs535586-AA]-[rs652888-AA]- [rs6559218-Aa]. In a 4-SNP combination, the barcode consists of SNPs (1, 2, 11, 20) with genotype 1-1-1-2, i.e., [rs535586-AA]-[rs652888-AA]-[rs7581217-AA]-[rs4526432-Aa]. Therefore, the PSO provides the highest
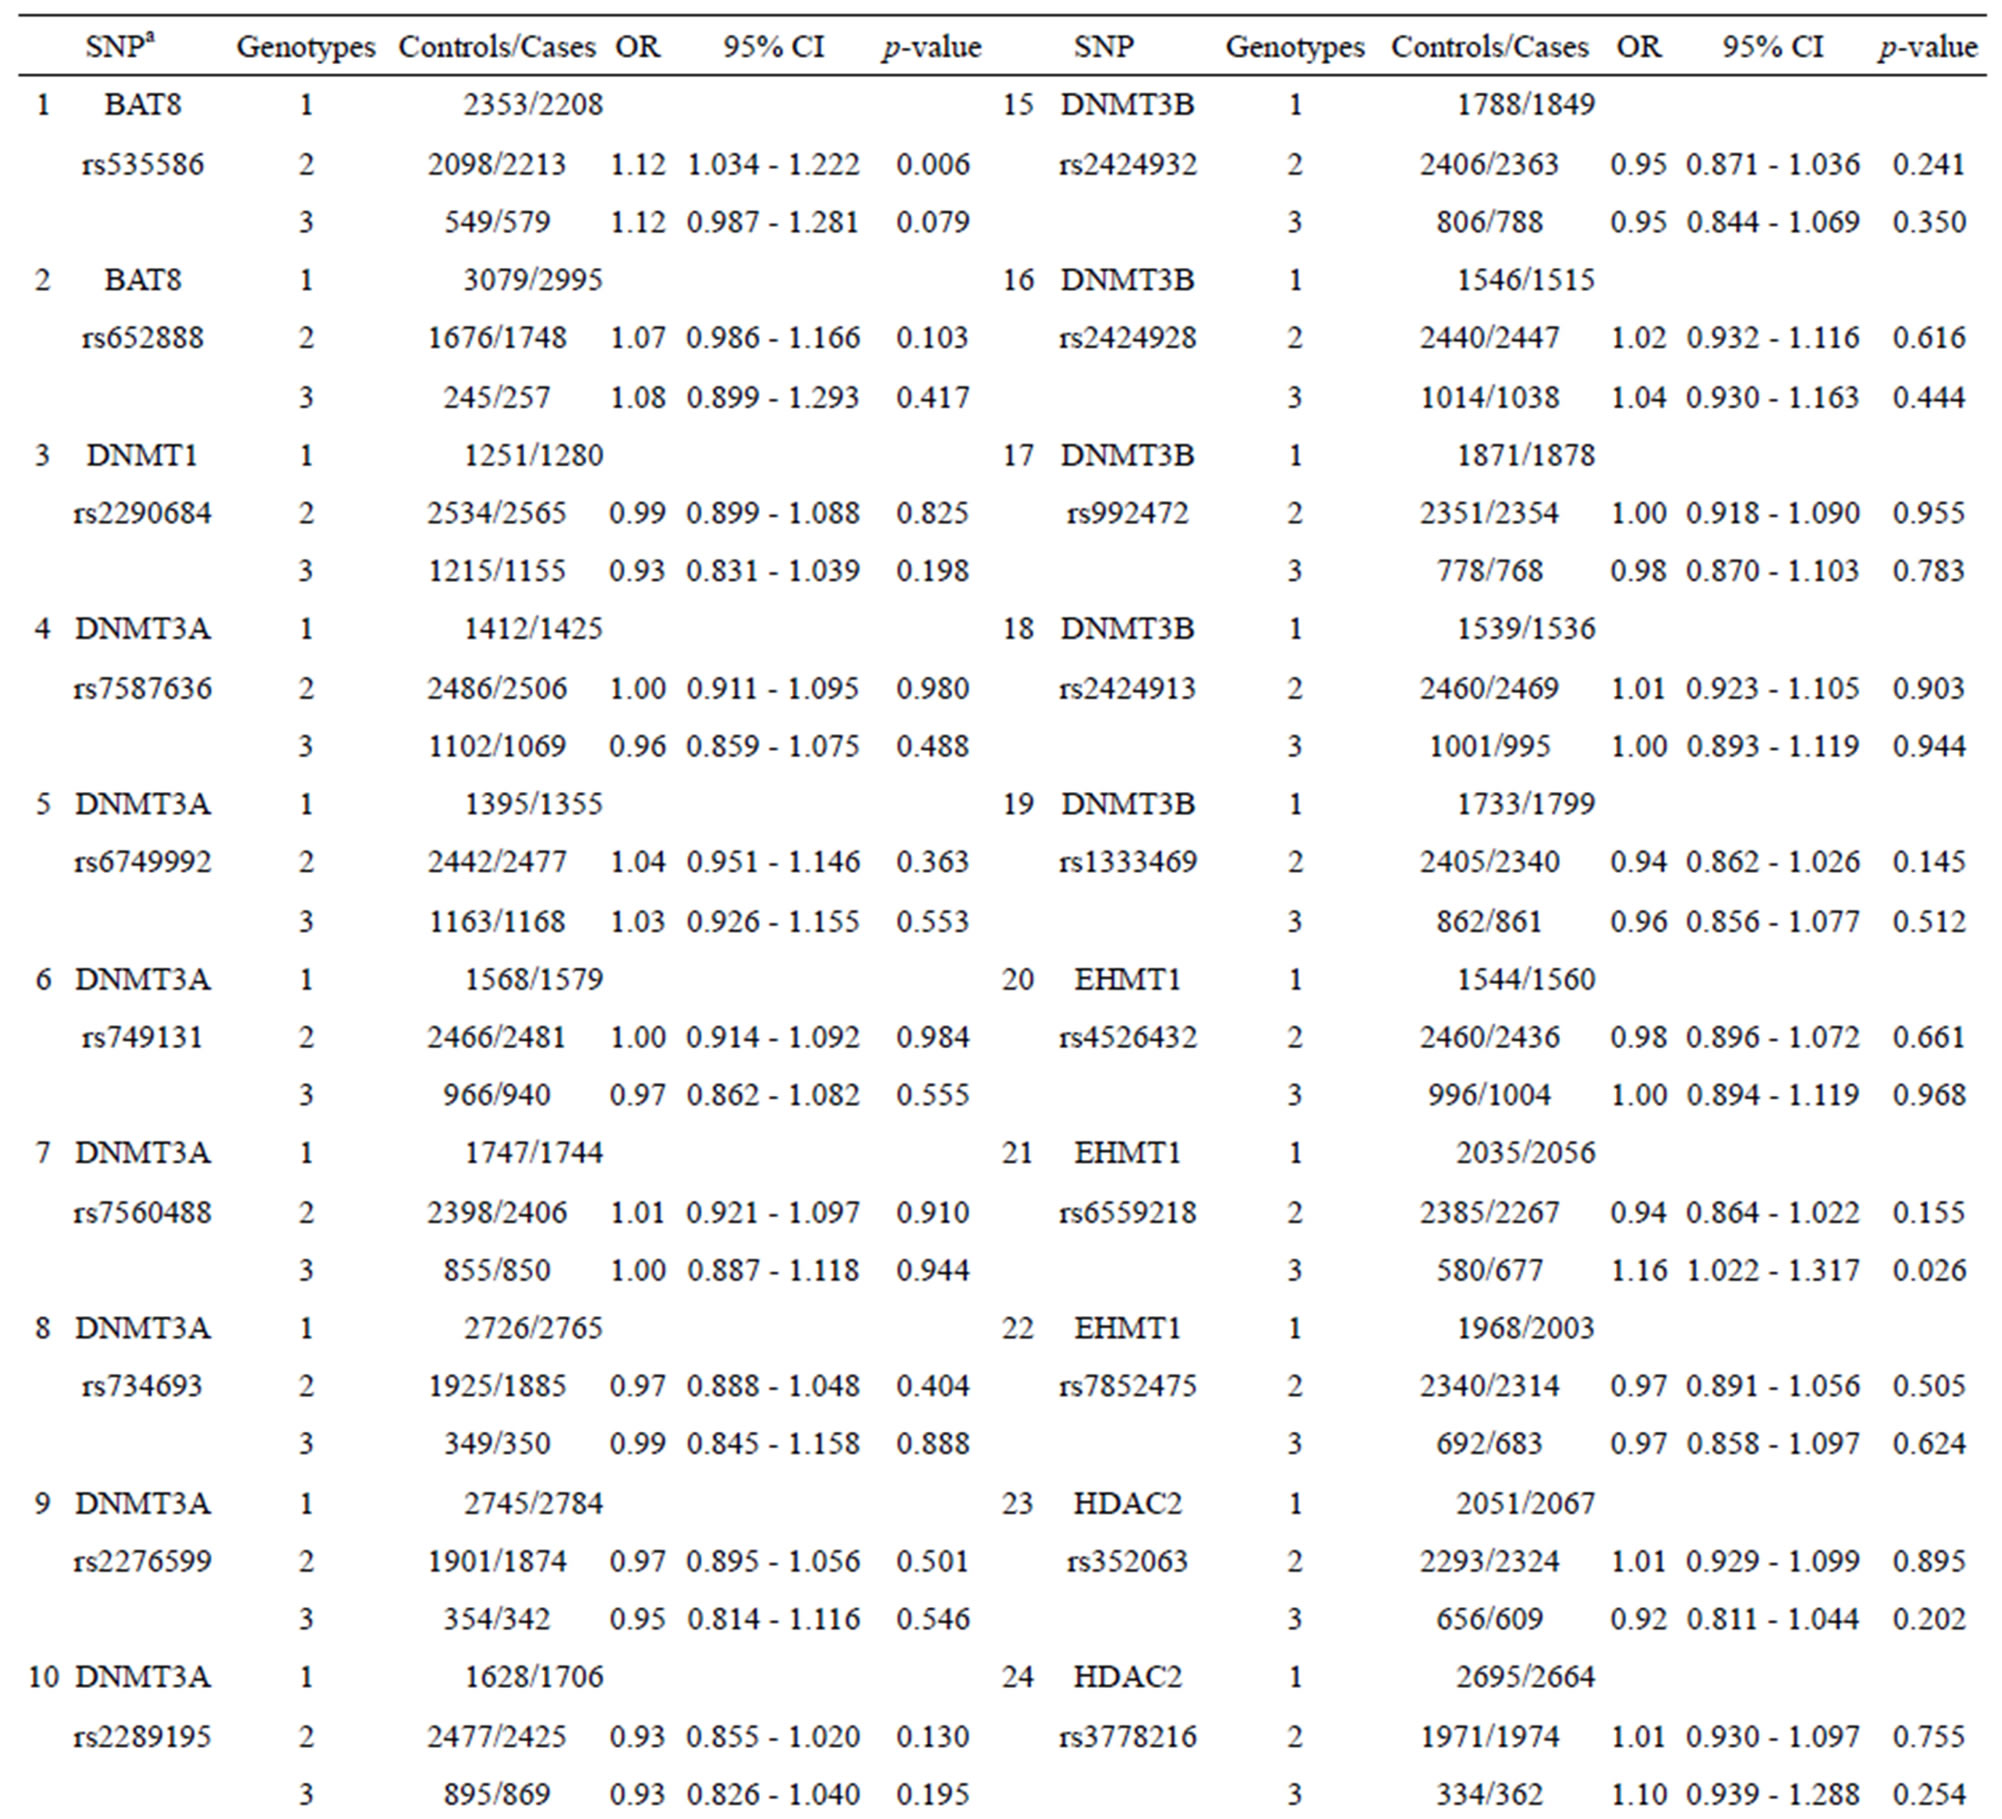
Table 1. Effect in individual SNPs of 27 epigenetic modifier-related genes on the occurrence of breast cancer.
Table 2. Representative difference between cases and controls for two SNP combinations amongst 27 SNPs, listed from maximal to minimal.
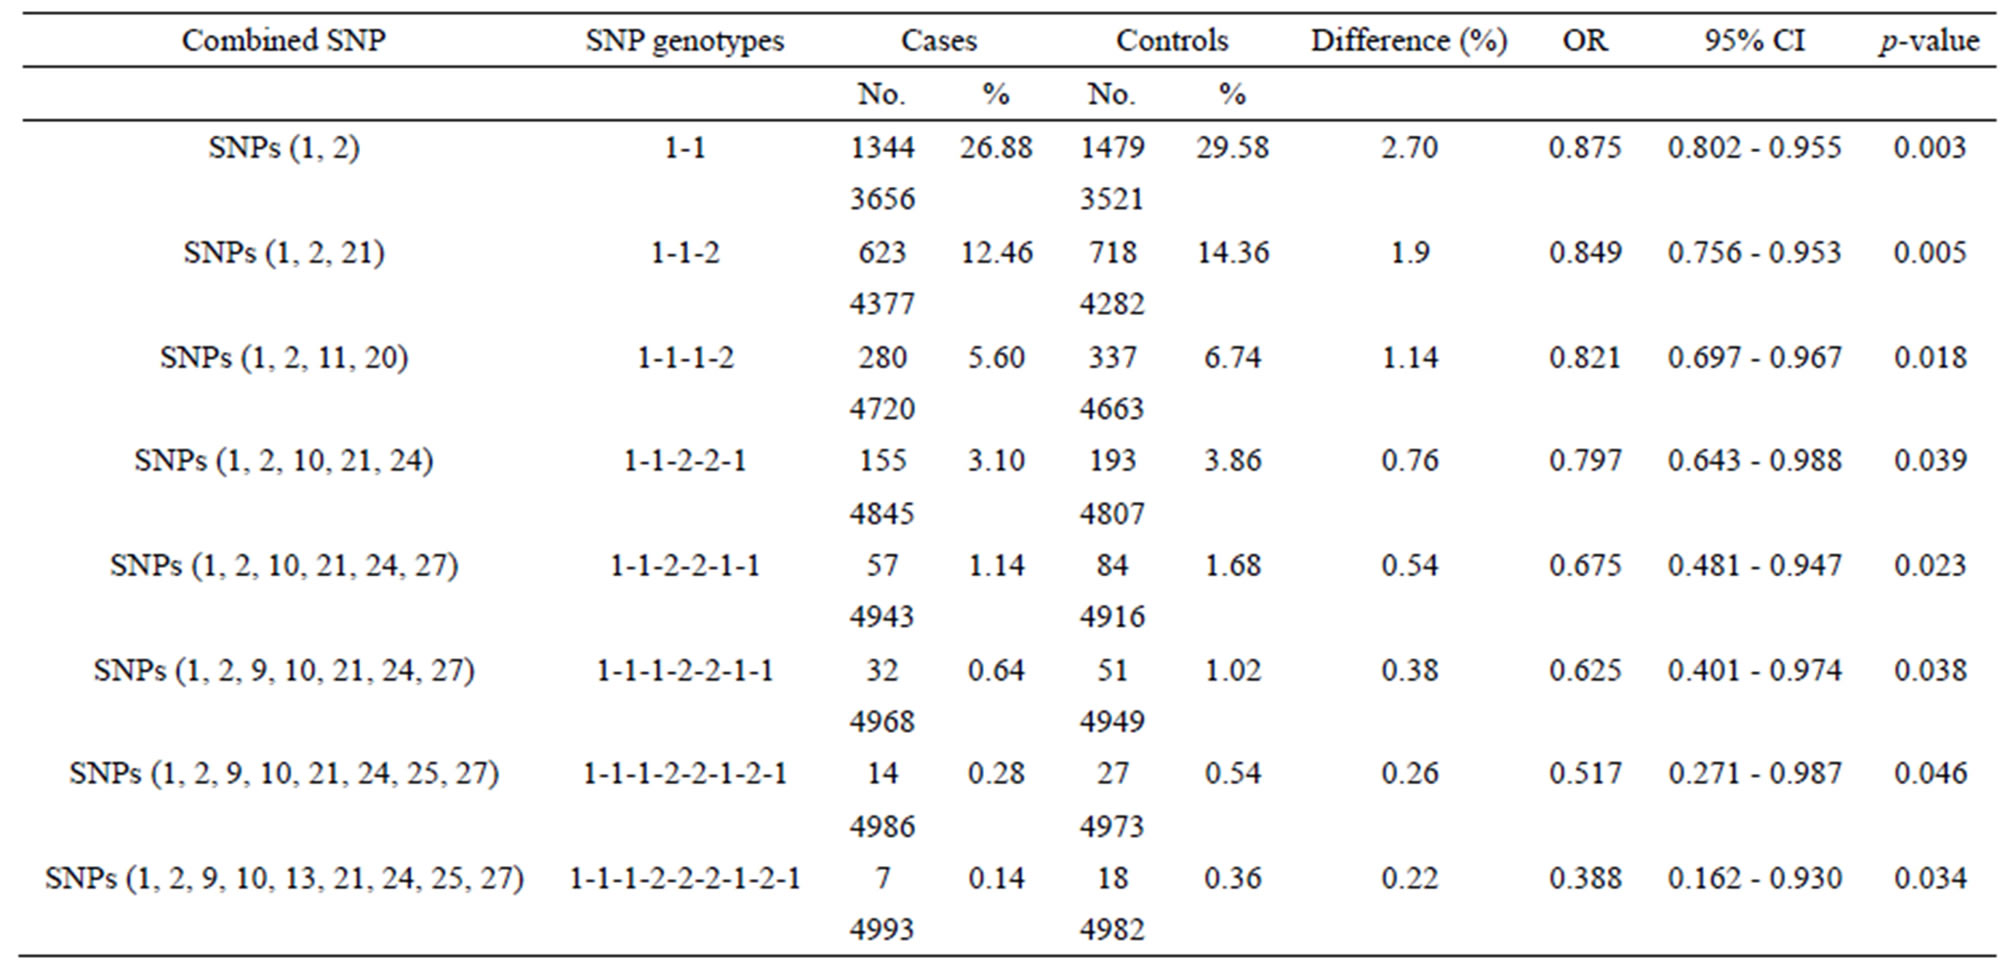
Table 3. Estimated effects of SNP barcode on the occurrence of breast cancer.
difference in terms of SNP barcodes between the cases and controls for fixed numbers of SNPs.
3.4. Prediction Scores of the Best PSO-Generated SNP Barcodes in Breast Cancer
Table 3 lists the best n-SNP barcodes (n = two to nine) calculated by the PSO algorithm. The right side of the table shows the estimated effect (odds ratio, 95% CI, and p-value) of certain SNP barcodes with respect to breast cancer susceptibility. SNP combinations (two to nine SNPs) with group differences between cases and controls are shown in “Difference” field. The difference between cases and controls are reduced from 2.70% to 0.22% between two to nine SNP barcodes. The OR of the best SNP barcodes is in the range of 0.875 to 0.388, and the 95% CI of OR is in the range of 0.162 to 0.988. The SNP barcodes involving two to nine SNPs show significantly decreasing OR values (p-value < 0.050 to 0.001). Since the SNP barcodes listed in Table 3 show that the control numbers are greater than the case numbers, the SNP barcodes are regarded as protective SNP barcodes against breast cancer.
4. DISCUSSION
Accumulating evidence on SNP-SNP interaction supports polygenic models for breast cancers [21-23] and suggests that, in terms of disease analysis, breast cancers are associated with combinations of SNPs rather than individual SNPs. Possible protective effects are also important for the prediction of cancer morbidity by SNPs. However, computational methods used to identify the complex interactions are still difficult to implement for high order SNP-SNP interactions. In this study, the PSO method was used to overcome this problem. We analyzed the contributions of 27 SNPs from nine breast cancer related genes to generate protective SNP barcodes in a casecontrol study of 5000 cases and 5000 controls with genotype data simulation. The genotype information is simulated at random with the genotype frequency as the only dependent variable. In general, a larger number of simulated datasets may provide more stable results for certain types of SNP barcodes associated with disease. However, the purpose of this study was to develop a methodology for detecting cancer-associated SNP barcodes using casecontrol studies where only the genotype frequencies are known.
As Table 1 shows, SNPs 1, 11, and 21 show significant differences with respect to the risk of breast cancer based on the odds ratio (p-value < 0.05) and share a common effect between individual and combined SNPs for the occurrence of breast cancer. However, SNPs 2, 9, 10, 13, 20, 24, 25, and 27 are not found to be significant as individual SNPs in relation to the occurrence of breast cancer. These results reveal that the SNPs involved in SNP-SNP interactions may be detectable using association studies. The analysis of the results in Table 3, which depicts the maximum difference information calculated by the PSO algorithm, can be used to predict the relative strength of the impact of an SNP on breast cancer protection. For example, the difference between controls and cases for SNP barcode [SNPs (1-2-21)-genotype (1-1-2)] is higher than that of [SNPs (1-2-11-20)-genotype (1-1- 1-2)], suggesting that SNPs 1 and 2 are more relevant for breast cancer protection than SNPs 11, 20, and 21. Hence, an order of impact on breast cancer for the SNPs listed in Table 3 can be arranged as SNPs 1/2 > SNP 21 > SNP 11/20 > SNP 10/24 > SNP 27 > SNP 9 > SNP 25 > SNP 13. The PSO-generated SNP barcodes involve two to nine SNPs and show significantly decreasing OR values, ranging from 0.875 to 0.388 in Table 3 (p-value, 0.003 to 0.034). In contrast, some individual SNPs with breast cancer protection display OR values ranging from 0.99 to 0.90 (Table 1). Figure 2 shows the relationship amongst OR, cases and controls. The value of OR is reduced from the low order to high order SNP-SNP interaction. Also, the difference between cases and controls decreases quickly, indicating that a very significant SNP barcode can be found in the high order SNP-SNP interaction. However, this rapidly decrease in difference increases the difficulty in identifying optimal SNP barcodes. PSO successfully overcome this difficulty, and the results show the SNP barcode is statistically significant.
We analyze the PSO in term of the computational
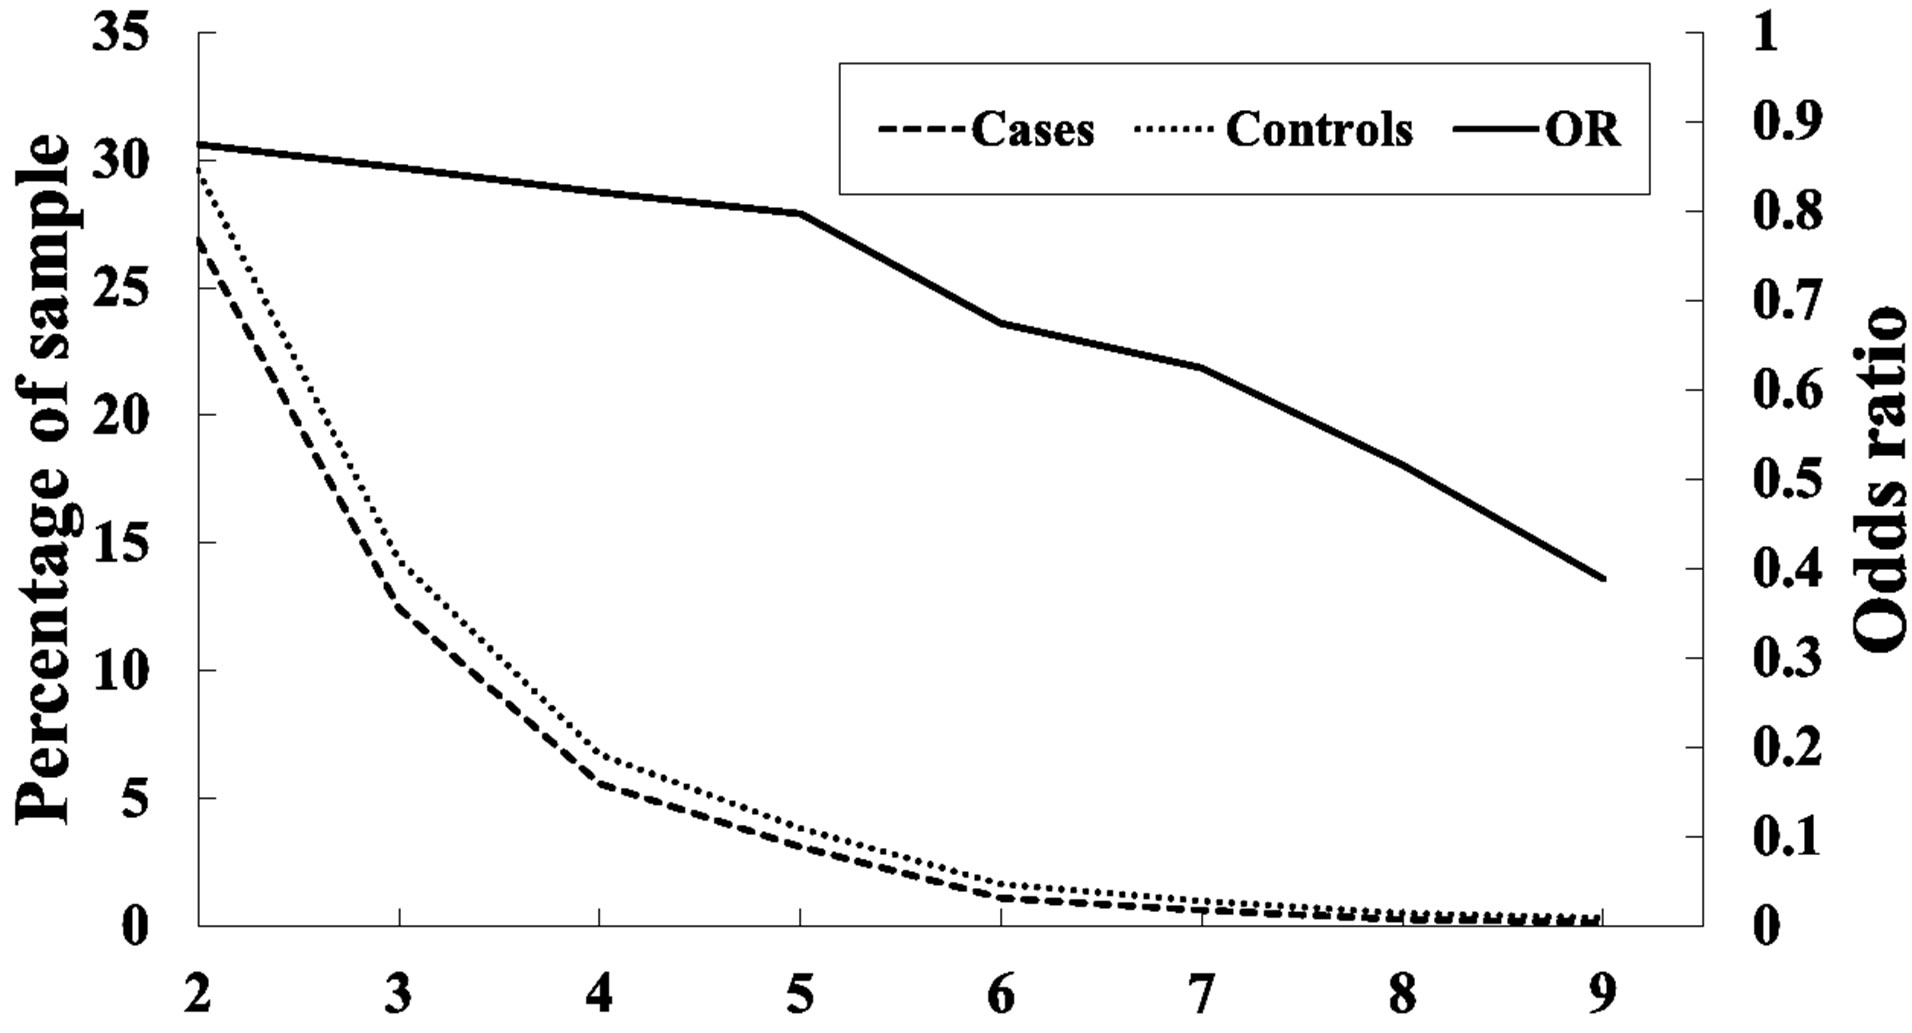
Figure 2. Frequency analysis among cases and controls, and odds ratio in 2- and 9-order SNP-SNP interactions.
complexity and parameters. Computational complexity is a key issue in detecting SNP-SNP interactions, and is estimated by the objective function computation for the PSO algorithm. Given I iterations and P solutions (particles) in the population, then the objective function computation has a computational complexity of O(IP). Optimal PSO parameters were investigated by Kennedy and Eberhart [17]. Population size and the number of iterations can be adjusted according the dataset. The suggested population size ranges from 50 to 100 and the suggested number of iterations ranges from 100 to 1000. The acceleration constants c1 and c2 control how far a particle moves in a single generation, i.e., they respectively control the exploitation and exploration ability in each search. To balance exploitation and exploration, it is suggested that c1 and c2 are set equal to 2. PSO can overcome the limitations imposed on computational time for complex SNP interactions for GWAS because PSO has the following advantages: 1) PSO allows robust analysis of high-order SNP combinations for GWAS studies and generates the best SNP barcodes; 2) PSO is an evolutionary algorithm without exhaustive search; 3) PSO only needs two parameters for computation without complex settings; and 4) PSO’s computational complexity is unaffected by the data set size.
5. CONCLUSION
Analysis of association studies is made difficult by the huge number of SNPs involved, especially when multiple SNPs are investigated simultaneously. Our proposed PSO algorithm was shown to successfully identify 27 SNP cross-interactions, and provides representative SNP-SNP interactions for breast cancer. The PSO algorithm can help identify the best fitness of cases and controls. Results involving two to nine SNPs show the OR of the best SNP barcodes is in the range of 0.875 to 0.388, and the 95% CI of OR is in the range of 0.162 to 0.988. All SNP barcodes show significantly decreasing OR values (pvalue < 0.050 to 0.001). These results demonstrate that PSO, coupled with odds ratio analysis, can successfully account for complex SNP interactions and provides the best SNP barcode profile for predicting breast cancer cases. This suggests that the method is suitable for the systematic exploration of genome-wide SNP interactions.
6. ACKNOWLEDGEMENTS
This work was partly supported by the National Science Council in Taiwan under grant NSC100-2221-E-151-049-MY3, and NSC100- 2221-E-151-051-MY2.
REFERENCES
- Li, J., Humphreys, K., Darabi, H., Rosin, G., Hannelius, U., Heikkinen, T., et al. (2010) A genome-wide association scan on estrogen receptor-negative breast cancer. Breast Cancer Research, 12, R93. doi:10.1186/bcr2772
- Kraft, P. and Haiman, C.A. (2010) GWAS identifies a common breast cancer risk allele among BRCA1 carriers. Nature Genetics, 42, 819-820. doi:10.1038/ng1010-819
- Thomas, G., Jacobs, K.B., Kraft, P., Yeager, M., Wacholder, S., Cox, D.G., et al. (2009) A multistage genome-wide association study in breast cancer identifies two new risk alleles at 1p11.2 and 14q24.1 (RAD51L1). Nature Genetics, 41, 579-584. doi:10.1038/ng.353
- Meindl, A. (2009) Identification of novel susceptibility genes for breast cancer—Genome-wide association studies or evaluation of candidate genes? Breast Care, 4, 93- 99. doi:10.1159/000211991
- Fanale, D., Amodeo, V., Corsini, L.R., Rizzo, S., Bazan, V. and Russo, A. (2012) Breast cancer genome-wide association studies: There is strength in numbers. Oncogene, 31, 2121-2128. doi:10.1038/onc.2011.408
- Yu, J.C., Hsiung, C.N., Hsu, H.M., Bao, B.Y., Chen, S.T., Hsu, G.C., et al. (2011) Genetic variation in the genomewide predicted estrogen response element-related sequences is associated with breast cancer development. Breast Cancer Research, 13, R13. doi:10.1186/bcr2821
- Pharoah, P.D.P., Tyrer, J., Dunning, A.M., Easton, D.F., Ponder, B.A.J. and Investigators, S. (2007) Association between common variation in 120 candidate genes and breast cancer risk. PLoS Genetics, 3, 401-406. doi:10.1371/journal.pgen.0030042
- Chang, H.-W., Yang, C.-H., Ho, C.-H., Wen, C.-H. and Chuang, L.-Y. (2009) Generating SNP barcode to evaluate SNP-SNP interaction of disease by particle swarm optimization. Computational Biology and Chemistry, 33, 114-119. doi:10.1016/j.compbiolchem.2008.07.029
- Yang, C.H., Chang, H.W., Cheng, Y.H. and Chuang, L.Y. (2009) Novel generating protective single nucleotide polymorphism barcode for breast cancer using particle swarm optimization. Cancer Epidemiology, 33, 147-154. doi:10.1016/j.canep.2009.07.001
- Moore, J.H., Asselbergs, F.W. and Williams, S.M. (2010) Bioinformatics challenges for genome-wide association studies. Bioinformatics, 26, 445-455. doi:10.1093/bioinformatics/btp713
- Yang, C.-H., Chuang, L.-Y., Chen, Y.-J., Tseng, H.-F. and Chang, H.-W. (2011) Computational analysis of simulated SNP interactions between 26 growth factor-related genes in a breast cancer association study. OMICS: A Journal of Integrative Biology, 15, 399-407. doi:10.1089/omi.2010.0028
- Yang, P., Ho, J.W., Yang, Y.H. and Zhou, B.B. (2011) Gene-gene interaction filtering with ensemble of filters. BMC Bioinformatics, 12, S10. doi:10.1186/1471-2105-12-S1-S10
- Chuang, L.-Y., Chang, H.-W., Lin, M.-C. and Yang, C.-H. (2012) Chaotic particle swarm optimization for detecting SNP-SNP interactions for CXCL12-related genes in breast cancer prevention. European Journal of Cancer Prevention, 21, 336-342. doi:10.1097/CEJ.0b013e32834e31f6
- Chuang, L.-Y., Lin, Y.-D., Chang, H.-W. and Yang, C.-H. (2012) An improved PSO algorithm for generating protective SNP barcodes in breast cancer. PloS ONE, 7, e37018. doi:10.1371/journal.pone.0037018
- Steen, K.V. (2012) Travelling the world of gene-gene interactions. Briefings in Bioinformatics, 13, 1-19. doi:10.1093/bib/bbr012
- Yang, C.-H., Chuang, L.-Y., Cheng, Y.-H., Lin, Y.-D., Wang, C.-L., Wen, C.-H., et al. (2012) Single nucleotide polymorphism barcoding to evaluate oral cancer risk using odds ratio-based genetic algorithms. Kaohsiung Journal of Medical Sciences, 28, 362-368. doi:10.1016/j.kjms.2012.02.002
- Kennedy, J. and Eberhart, R.C. (1995) Particle swarm optimization. Proceedings of IEEE International Conference on Neural Networks, Perth, 27 November-1 December 1995, 1942-1948. doi:10.1109/ICNN.1995.488968
- Shi, Y.-H. and Eberhart, R.C. (1999) Empirical study of particle swarm optimization. Proceedings of the 1999 Congress on Evolutionary Computation, Washington DC, 6-9 July 1999, 1948-1950.
- Ratnaweera, A., Halgamuge, S. and Watson, H. (2004) Self-organizing hierarchical particle swarm optimizer with time-varying acceleration coefficients. IEEE Transactions on Evolutionary Computation, 8, 240-255. doi:10.1109/TEVC.2004.826071
- Mechanic, L.E., Luke, B.T., Goodman, J.E., Chanock, S.J. and Harris, C.C. (2008) Polymorphism Interaction Analysis (PIA): A method for investigating complex gene-gene interactions. BMC Bioinformatics, 9, 146. doi:10.1186/1471-2105-9-146
- Lin, G.-T., Tseng, H.-F., Yang, C.-H., Hou, M.-F., Chuang, L.-Y., Tai, H.-T., et al. (2009) Combinational polymorphisms of seven CXCL12-related genes are protective against breast cancer in Taiwan. OMICS: A Journal of Integrative Biology, 13, 165-172. doi:10.1089/omi.2008.0050
- Smith, T.R., Levine, E.A., Freimanis, R.I., Akman, S.A., Allen, G.O., Hoang, K.N., et al. (2008) Polygenic model of DNA repair genetic polymorphisms in human breast cancer risk. Carcinogenesis, 29, 2132-2138. doi:10.1093/carcin/bgn193
- Briollais, L., Wang, Y., Rajendram, I., Onay, V., Shi, E., Knight, J., et al. (2007) Methodological issues in detecting gene-gene interactions in breast cancer susceptibility: A population-based study in Ontario. BMC Medicine, 5, 22. doi:10.1186/1741-7015-5-22