Health
Vol.4 No.3(2012), Article ID:18335,4 pages DOI:10.4236/health.2012.43023
Do unemployment and payor category impact length of stay and hospital charges of spine fusion patients?*
![]()
Medical Center of Central Georgia, Macon, USA; #Corresponding Author: mswalid@yahoo.com
Received 12 January 2012; revised 8 February 2012; accepted 23 February 2012
Keywords: Spine Fusion; Hospital Charges; Payor Category
ABSTRACT
Introduction: In this paper we investigate the possible connection between socioeconomic status as demarcated by employment and insurance status and consumption of healthcare resources in spine surgery patients. Methods: The clinical records of 1599 spine surgery patients counted from 2008-2009 were reviewed. The largest groups of patients belonged to MSDRG 460 (N = 585) and to MS-DRG 473 (N = 700). These two MS-DRG patient groups were used as the study cohort representing patients who, by definition, did not have serious comorbidities or complications. Results: Unemployed non-cervical patients tended to stay on average 1.8 days longer in hospital and had on average $5800 higher hospital charges. No major differences were noted in length of stay and hospital cost between government and private insurance patients. However, self-pay non-cervical fusion patients had notable increases in length of stay and hospital cost, especially in the >39 and <60 age group with the difference in length of stay amounting to 5 days and in hospital charges to $10,000. Univariate analysis with DRG (460 or 473) as a covariate showed significant impact from employment status on length of stay (F = 4.259, P = 0.014) and less significant impact from payor category on hospital charges (F = 2.229, P = 0.064) in the economically-productive 40 - 59 age group. Conclusions: In general, no increase in hospital resource consumption was noted except among self-pay patients, the same group seemingly least able to afford expensive healthcare.
1. INTRODUCTION
Spine fusion is one of the top ten procedures whose cost is rapidly increasing in the United States [1]. Several factors may affect the outcome of neurosurgical procedures including socioeconomic disparities [2]. Socioeconomic status, as demarcated by employment and insurance coverage, might also in some circumstances be associated with higher consumption of healthcare resources. In order to scientifically investigate such a delicate connection we conducted the following analysis on a cohort of spine surgery patients.
2. METHODS
2.1. Study Cohort
The original study cohort consisted of a chronologically continuous population of patients operated at a tertiary care center in Middle Georgia between 2002 and 2009. For spine surgery patients from 2002-2007, two Diagnosis-Related Groups (DRGs) were used:
• DRG 497: Spinal fusion with comorbidities/complications;
• DRG 498: Spinal fusion without comorbidities/complications;
• DRG 519: Cervical spinal fusion with comorbidities/ complications;
• DRG 520: Cervical spinal fusion without comorbidities/ complications.
For spine surgery patients from 2008-2009, the following Medicare Severity Diagnosis-Related Groups (MSDRGs) replaced the previous DRGs:
• MS-DRG 459: Spinal fusion except cervical with major comorbidities/complications;
• MS-DRG 460: Spinal fusion except cervical without major comorbidities/complications;
• MS-DRG 471: Cervical spinal fusion with major comorbidities/complications;
• MS-DRG 472: Cervical spinal fusion with comorbidities/complications;
• MS-DRG 473: Cervical spinal fusion without comorbidities/complications.
The clinical records of spine surgery patients operated during 2008 and 2009 were retrospectively reviewed. In this cohort, the largest groups belonged to MS-DRG 460 (N = 585) and MS-DRG 473 (N = 700). These two patient groups made the final study cohort, because they represented patients who, by definition, did not have serious comorbidities or complications. No patients from 2002- 2007 patients were thus included in the study (Figure 1).
2.2. Outcome Variables
First, the relationship of these uncomplicated DRGs (460 and 473) with the principle diagnosis at the time of discharge was studied to verify that these patients were mainly ailed by degenerative disease and that the patients were not admitted as a result of traumatic injury. Employment status, payor type, length of stay and hospital cost (charges) were tabulated and assessed using univariate analysis controlling for DRGs. Analyses were performed for the whole patient cohort (N = 1285) and repeated for economically-productive working-age patients >39 and <60 years old only (N = 736).

Figure 1. Organization chart of the study cohort.
2.3. Limitations
Other factors may impact the consumption of hospital resources as measured by hospital length of stay and charges that include, but are not limited to, patient age, admitting diagnosis, comorbidities, emotional exhaustion [3] and secondary gain issues [4]. Our study focuses on the relationship between payor category and employment status on one side and length of stay and hospital charges on the other side. As such, the reader should be cautious when extracting definitive conclusions based on our findings.
3. RESULTS
3.1. Principle Diagnosis
The largest subgroup of patients in MS-DRG 460 had the diagnosis of lumbar disk displacement (ICD-9 722.10, N = 203), followed by lumbar/lumbosacral disk degeneration patients (ICD-9722.52, N = 110) and those with lumbar spinal stenosis (ICD-9 724.02, N = 96).
The largest subgroup of patients in MS-DRG 473 had the diagnosis of cervical disk displacement patients (ICD-9 722.0, N = 414), followed by cervical spondylosis patients (ICD-9 721.0, N = 103) and those with cervical disk disease with myelopathy (ICD-9722.71, N = 75).
3.2. Unemployment & Self-Pay Rate
Overall, unemployment rate was 30.1% among all patients. 2.7% of overall patients were “self-pay”, meaning that they did not have insurance coverage. In the unemployed cohort, the percentage of self-pay patients was 4.9% versus 1.8% in the employed cohort.
In the >39 and <60 age group, the prevalence of unemployment was 29.8%. In the >39 and <60 age group, the percentage of self-pay among unemployed patients was 5.5% versus 1.9% in the employed group (Figure 2).
3.3. Fluctuations in Length of Hospital Stay and Charges
Differences were most evident in the “working-age group. Unemployed non-cervical patients tended to stay on average 1.8 days longer in hospital and had on average $5800 higher hospital charges (Figure 3). No major differences were noted in length of stay and hospital cost between government and private insurance patients. However, self-pay non-cervical fusion patients had notable increases in length of stay and hospital cost, especially in the >39 and <60 age group with the difference in length of stay amounting to 5 days and in hospital charges to $10,000 (Figure 4). Univariate analysis with DRG (460 or 473) as a covariate showed significant impact from employment status on length of stay (F = 4.259, P = 0.014)

Figure 2. Payor category distribution of DRG 460 and DRG 473 patients per employment status.

Figure 3. Length of stay and hospital charges for MS-DRG 460 and MS-DRG 473 patients aged >39 and <60 years belonging to different employment status.
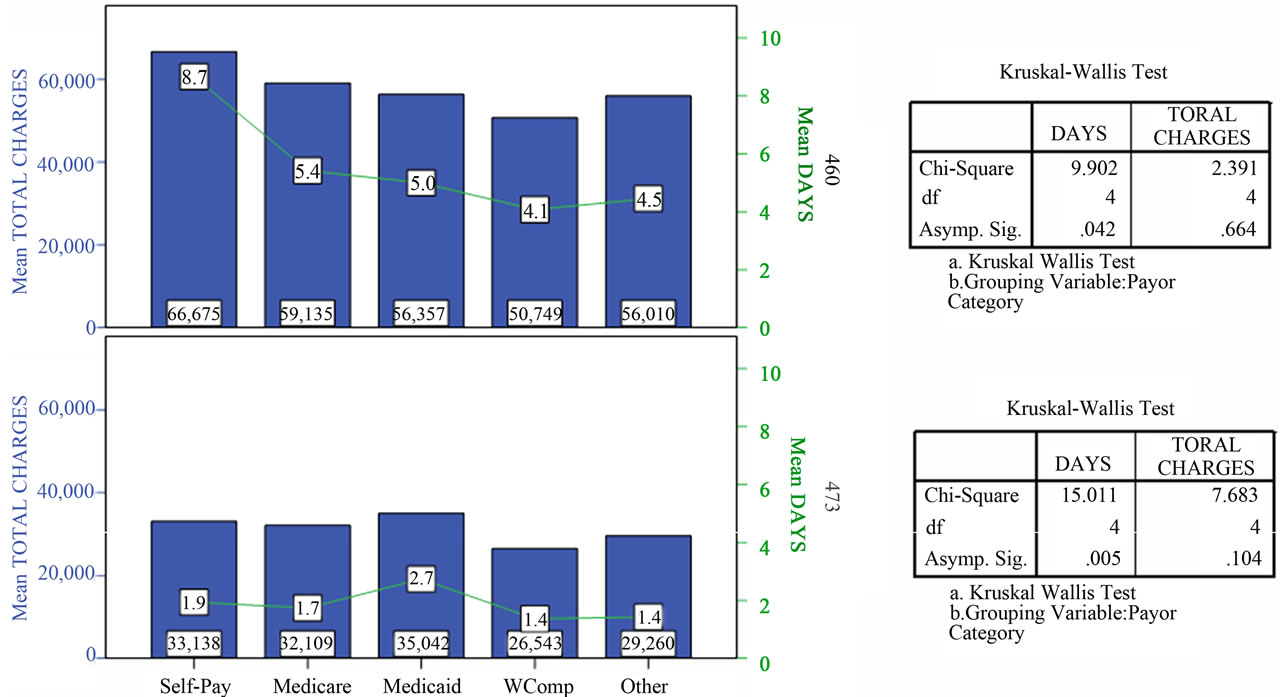
Figure 4. Length of stay and hospital charges for MS-DRG 460 and MS-DRG 473 patients aged >39 and <60 years belonging to different payor categories.
and less significant impact from payor category on hospital charges (F = 2.229, P = 0.064) in the economicallyproductive 40 - 59 age group.
4. COMMENTARY
Health insurance in the American economic system is a vibrant sector where premiums, deductibles, co-payments, and charges intersect in a network of public and private providers. Hospital charges represent about a third of total health care spending [5]. The findings of our study reveal that while healthcare resource consumption as indicated by hospital length of stay and charges was comparable across most categories, the situation for selfpay non-cervical fusion patients is not however so favorable.
There is a growing body of evidence demonstrating the negative consequences of inequalities in the cost of medical care on self-pay patients [6]. Research shows that uninsured people who are without coverage for the full year receive about half (55%) of the medical care per person compared to those who have health coverage for the entire year, even after taking uncompensated care into account [7]. We believe that an updated accounting and reimbursement system would help optimize pricing policies so as to remove the barriers to self-pay patients seeking needed care.
According to 2003 estimates, there are approximately 45 million people without health insurance in the United States [8]. The problem of the uninsured (self-pay) poses difficult dilemmas for patients as well as for healthcare providers. Without any third-party reimbursement available to share significant portions of the payments for needed or received health care, the uninsured are faced with the obligation to pay the entire cost. While ongoing changes to the US healthcare system may reduce the number of uninsured citizens, a segment of society may persist without means for paying for healthcare needs. This is compounded by the fact that the uninsured may be required to pay higher fees for their health care at the time of service than those who are insured [5,6] owing to already-negotiated discounts for insurance companies [6, 9]. Not surprisingly, half of US bankruptcies, affecting 2 million people annually, are due to health-related costs [10].
The findings above indicate that, in general, among our patients, no increase in hospital resource consumption was noted except among self-pay patients, the same group seemingly least able to afford expensive healthcare. Addressing this quandary merits continued attention with the aim of discovering feasible and cost-effective ways to provide patient care and enable patients to pay for their care. Cost sharing between patients and insurers as well as consumer driven health care, in which the individual controls their own health care choices and consumer health care is paid for by the individual instead of the government or employers, have been suggested to fix those issues [11,12]. Consumer driven health care is then portable as health insurance plans are tied to the individual and not to a single company. It is unknown how such a hypothetic system overhaul would affect population coverage, patient charges and provider viability. Further inquiry into secondary causal factors affecting healthcare cost is indicated as current practices and systems may become unsustainable and unviable in the near future.
![]()
![]()
REFERENCES
- Stranges, E. Russo, C.A. and Friedman, B. (2009) Procedures with the most rapidly increasing hospital costs, 2004-2007. HCUP Statistical Brief #82. Agency for Healthcare Research and Quality (AHRQ), Rockville. http://www.hcup-us.ahrq.gov/reports/statbriefs/sb82.pdf
- El-Sayed, A.M., Ziewacz, J.E., Davis, M.C., Lau, D., Siddiqi, H.K., Zamora-Berridi, G.J. and Sullivan, S.E. (2011) Insurance status and inequalities in outcomes after neurosurgery. World Neurosurgery, 76, 459-466. doi:10.1016/j.wneu.2011.03.051
- Helkavaara, M., Saastamoinen, P. and Lahelma, E. (2011) Psychosocial work environment and emotional exhaustion among middle-aged employees. BMC Research Notes, 4, 101. doi:10.1186/1756-0500-4-101
- Pisetsky, D.S. (2008) Does secondary gain exist? How I learned to balance the complex equation of loss and gain from disease. The Rheumatologist. http://www.the-rheumatologist.org/details/article/982925/Does_Secondary_Gain_Exist.html
- Whelan, D. (2010) America’s most profitable hospitals. Forbes. http://www.forbes.com/2010/08/30/profitable-hospitals-hca-healthcare-business-mayo-clinic.html
- Kaufman, W., Chavez, A.S., Skipper, B. and Kaufman, A. (2006) Effect of high up front charges on access to surgery for poor patients at a public hospital in New Mexico. International Journal of Equity Health, 5, 6. doi:10.1186/1475-9276-5-6
- Hadley, J. and Halohan, J. (2004) The cost of care for the uninsured: What do we spend, who pays, and what would full coverage add to medical spending? Kaiser Commission on Medicaid and the Uninsured, 10 May 2004. http://www.kff.org/uninsured/upload/The-Cost-of-Care-for-the-Uninsured-What-Do-We-Spend-Who-Pays-and-What-Would-Full-Coverage-Add-to-Medical-Spending.pdf
- De Navas-Walt, C., Proctor, B.D. and Mills, RJ. (2004) Income, poverty and health insurance coverage in the United States: 2003. US Census Bureau, Washington DC.
- Pryor, C., Seifert, R., Gurewich, D., Oblak, L. and Rosman, B. and Prottas, J. (2003) Unintended conesquences: How federal regulations and hospital policies can leave patients in debt. The Commonwealth Fund, New York.
- Himmelstein, D.U., Warren, E., Thorne, D. and Woolhandler, S. (2005) Illness and injury as contributors to bankruptcy. Health Aff (Millwood). Suppl Web Exclusives: W5-63-W5-73.
- Swartz, K. (2010) Cost-sharing: Effects on spending and outcomes. The Synthesis Project. Research Synthesis Report.
- Williams, J. (2011) Health care in America: How to fix costs and employer provided insurance through consumer driven health care. Honors College Capstone Experience/ Thesis Projects. Paper 311. http://digitalcommons.wku.edu/stu_hon_theses/311
NOTES
*Parts of this paper were presented as a poster at the 2010 Congress of Neurological Surgeons Annual Meeting, San Francisco, CA.