Engineering
Vol.08 No.04(2016), Article ID:66173,12 pages
10.4236/eng.2016.84021
A Simulation Study of the Steam Reforming of Methaneina Fixed-Bed Reactor
Fernando Antôniode Araújo Silva, Kenia Carvalho Mendes*, Jornandes Dias da Silva
Polytechnic School-UPE, Laboratory of Environmental and Energetic Technology; Recife, Brazil

Copyright © 2016 by authors and Scientific Research Publishing Inc.
This work is licensed under the Creative Commons Attribution International License (CC BY).
http://creativecommons.org/licenses/by/4.0/


Received 11 March 2016; accepted 25 April 2016; published 29 April 2016
ABSTRACT
In this work a one-dimensional mathematical model was developed to simulate methane conversion and hydrogen yield in a fixed-bed reactor filled with catalyst particles. For the reason that reforming reactions are sorely endothermic process, the heat is supplied to the reactor through electrical heating. The reforming reactions have been investigated from a modelling view point considering the effect of different temperatures ranging from 500˚C and 977˚C on the conversion of methane and hydrogen yield. Simulation results show that the steam reforming of methane in a fixed-bed reactor can efficiently store high temperature end thermal energy. When the operating temperature is increased to 977˚C, the conversion of methane is 97.48% and the hydrogen yield is 2.2408. As a conclusion, the maximum thermochemical efficiency will be obtained under optimal operating temperature (977˚C) and the steam/methane (3.86) ratio.
Keywords:
Simulation, Methane, Modelling, Steam Reforming, Fixed-Bed Reactor

1. Introduction
Nowadays there are worldwide increasing interests concerning climate change and greenhouse gas emissions. Environmental problems derived from different energy generation sources and the fossil fuels prices have enhanced the development of new technologies for energy production. The significant reduction of carbon dioxide (CO2) emissions in energy production and fuels is demanded to ensure sustainable developments. Therefore, future energy supply system features electricity and hydrogen as the dominant energy carriers. Steam Reforming of Methane (SRM) is still the predominant method for producing a hydrogen-rich synthesis gas (H2 + CO). Hydrogen is conventionally produced on a large-scale by the SRM. In conventional technology, SRM is carried out using multi-tubular fixed-bed reactors [1] . High temperatures favour the process, due to the endothermicity of the reforming reactions. One of the main future applications of the kind of technology could be the production of hydrogen [2] . In this process, methane reacts with steam in the conventional Fixed-Bed Reactor (FBR) to produce a mixture of methane (CH4), water (H2O), hydrogen (H2), carbon monoxide (CO) and dioxide carbon (CO2).
The world consumption is about 50 million ton of hydrogen per year (137 million kg of hydrogen per day) and the request for hydrogen is increasing rapidly [3] . In this context, the production of hydrogen using the SRM has been investigated by a lot of authors [4] - [6] . SRM on solid catalysts is the well-known commercial process for the production of hydrogen and synthesis gas. The simulation and optimal project of the commercial process requires information on the intrinsic kinetics. The reaction system considered in this work is given for reactions (1)-(3) as follows:
-Steam Reforming of Methane (SRM);
 (1)
(1)
-Water Gas-Shift (WGS);
 (2)
(2)
-Reverse Methanation (RM).
 (3)
(3)
Steam reforming of methane is a quite complex process. It not only involves the transfer and diffusion of reactants and products, between the bulk phase and catalyst surface, as well as within the catalyst, but also involves several reactions simultaneously in parallel or in series. The most of the researches have been experimentally and numerically investigated to produce H2 at high temperature [7] [8] . The main focus of the experimental studies is to develop the robust catalysts which are resistant for carbon deposition.
The objective of this paper is to evaluate the performance of the conventional FBR used to simulate the SRM. Based on the energy and mass balances of chemical species, a system of Partial Differential Equation (PDE) was formulated for describing governing equations of the energy and mass balances. Simulations presented from the model equations provide the evaluation of the SRM process in FBR reactor with a nickel catalyst. The performance of above reactor was studied in terms of temperature profiles, methane conversion at different temperatures and hydrogen production at different temperatures.
2. Kinetic Modelling
2.1. Reaction Rate Expressions
The reaction rates were formulated by Xu and Froment [9] according to Langmuir-Hinshelwood approach. They are described by Equation (4) below for SRM, WGS respectively.
 (4)
(4)
With,
 (5)
(5)
where Ri is reaction rates i (i = 1, 2 and 3), respectively; ki is reaction rate constants i (i = 1, 2 and 3), respectively; Ki is adsorption constant of chemical species i (i = CH4, H2 and CO), respectively; Keq.,i is equilibrium constants i (i = 1, 2 and 3), respectively; Pi is partial pressures of chemical species i (reaction zone) (i = CH4, H2O, H2, CO and CO2), respectively;  is the molar flow rates i (i = H2O, H2 and CH4).
The feeding partial pressures ( ) of chemical species i are calculated as follows:
 (6)
(6)
 (7)
(7)
With,

2.2. Net Rates
The net rates of chemical species (consumption and formation) for reactions (1), (2) and (3) have been obtained by using the Equation as follows [10] .
 (8)
(8)
where ri is the net rates of chemical species (i) in the reactions (1), (2) and (3), sij is the stoichiometric coefficients of chemical species and Rj is the overall rates of the reactions (1), (2) and (3).
Effectiveness factors (hi) are used to account for the intraparticle transport limitation. Thus, Equation (8) was modified using hi as follows.
 (9)
(9)
Equation (9) has been used to obtain the net rates of chemical species ( ,
,  ,
,  ,
,  and
and ) as follows.
 (10)
(10)
 (11)
(11)
3. Mathematical Modelling
A schematic configuration of the proposed system used in the development of the mathematical model is shown in Figure 1. The system consists of one concentric tube, including the conventional FBR reactor. During the

Figure 1. Schematic diagram of the FBR reactor.
operation, fixed-bed FBR is continuously fed with a gas mixture (H2O/CH4 = 3.86) inlet. The base data used for the geometric conditions, catalyst properties and inlet operating conditions are illustrated in Table 1, in relation to the FBR reactor. The temperature range (500˚C - 973˚C) of the numerical experiments was chosen to cover all possible conditions that may occur in this study in the FBR reactor.
3.1. Energy Balances
・ Energy balance of the gas phase;
 (12)
(12)
where  are the density of the mixture gas, molar heat capacity at constant pressure of the mixture gas, respectively;
 are superficial velocity, film heat transfer coefficient between the gas and the solid phase, heat transfer area per volume of catalyst bed, respectively;
  are temperature of the phase, temperature of the solid phase, respectively.
・ Initial and boundary for the Equation (12)
 (13)
(13)
・ Energy balance of the solid phase;
 (14)
(14)
In Equation (14),  are the void fraction of the solid phase, catalyst density, heat capacity of catalyst bed, respectively; DHj, hj, Rj are density of the catalyst, enthalpy of reaction j, effectiveness factor of reaction j, rate of reaction j, respectively.
・ Initial and boundary for the Equation (14)
 (15)
(15)
3.2. Mass Balances
Based on these simplifications, the differential molar balances to all chemical species (CH4, H2O, H2, CO and CO2) in the shell side are given as follows.
・ Mass balance of methane:
 (16)
(16)
・ Initial and boundary conditions for the Equation (16):
 (17)
(17)
・ Mass balance of water:
 (18)
(18)
・ Initial and boundary conditions for the Equation (18):
 (19)
(19)
・ Mass balance of hydrogen:

Table 1. Geometric conditions, catalyst properties, inlet operating conditions, respectively.
 (20)
(20)
・ Initial and boundary conditions for the Equation (20):
 (21)
(21)
・ Mass balance of carbon monoxide:
 (22)
(22)
・ Initial and boundary conditions for the Equation (22):
 (23)
(23)
・ Mass balance of carbon monoxide:
 (24)
(24)
・ Initial and boundary conditions for the Equation (24):
 (25)
(25)
In Equations (12)-(25),  are the gravity acceleration (m/s2), spatial time (s), gas flow rate (m3/s1), diameter of the reactor (m), respectively;
  are the density of the solid phase (kg/m3), particle radius (m), reactor length (m), void fraction of bed (-), respectively;
  are the molar flow rate of methane (mol/s), molar flow rate of water (mol/s), molar flow rate of hydrogen (mol/s), molar flow rate of carbon monoxide (mol/s), molar flow rate of carbon dioxide (mol/s), respectively;
  are the time (s), spatial coordinate (m), respectively.
3.3. Numerical Solution
Parabolic partial differential equations (PDEs) are frequently used to model one verity of engineering phenomena such as the steady-state conduction in a solid and the reaction-diffusion type problems. In order to solve the governing equations the engineering problems, several numerical methods have been developed to solve EDPs. The choice of method depends on the desired accuracy, as well as, concerns about the stability and robustness of the system while maintaining computational efficiency. Furthermore, these characteristics depend on the form of the PDE will be solved.
For parabolic equations, several numerical methods can be used to obtain a solution [11] . For example, the method of lines (MOL) is an efficient routine in which the spatial dimensions are discretized by using some techniques such as finite difference, finite element, finite volume, or collocation methods [12] . In this paper, we use the MOL for solving the PDEs system formed by the Equations (12)-(25), jointly with the initial and boundary conditions.
4. Results and Discussion
The one-dimensional model presented for this work provides the temperature profiles (as shown in the gas and solid phases) and the molar flow rates of each chemical species. As a result, SRM was tested in a conventional FBR for the simulations of this work; a hot inert initial state has been used where a steady flow of N2 at 500˚C and 650 kPa is fed under adiabatic conditions (no heat gain or loss through the reactor walls).The modelling for SRM in the FBR, sketched in Figure 1, consists in a set of model equations to describe chemical species i (i = CH4, H2O, H2, CO and CO2), as well as, the energy balances of the gaseous and solid phases at this reactor type.
The dynamics modelling bases on energy and species balances with the intrinsic kinetic equations reported by Xu and Froment [9] . The parameter values used for the simulation of the SRM on the FBR reactor are listed in Table 2.
4.1. Analysis for FBR
The conventional FBR technology is still applied on industrial scale to steam reforming of methane [13] [14] . Thermodynamically, the conventional FBR is operated at high temperature to reforming processes [15] . As results, we show in this section the dynamics evolutions (temperatures of the gaseous and solid phases, product gas distribution) for this reactor type.
Figure 2 shows the expected results for the gaseous and solid temperatures, from the start-up of the SRM to the time the reactor reaches the fully steady state. As it is known, the SRM process can start at the catalyst bed in a temperature near 500˚C (773.15 K). Therefore, in this work, the initial catalyst bed temperature is set at this value. In addition, the supplied gas blend is also set at 500˚C (773.15 K) and 650 kPa. The simulation is carried out with different compositions of the biomass-derived syngas (as shown in Table 1). These biomass-derived syngas compositions were used to estimate the molar flow rate ( ) at time zero by using the below Equation (26), as shown in Table 2.
 (26)
(26)
4.1.1. Thermal Evaluation
The steam reforming of methane in a FBR, filled with catalyst particles, is still applied at industrial scale. Due the endothermic nature of the reforming reactions, heat is supplied through electrical heating. Therefore, the reactor and catalyst particles are exposed to significant temperature gradients. As a result, we show in this section the temperature profiles (temperatures of the gaseous and solid phases) for this reactor mode.
Table 2. The parameters of the mathematical model used for the simulation of the SRM process in the FBR.
Figure 2 and Figure 3 show the profiles for the solid temperature at different periods in the FBR and profiles for the gas temperature at different periods in the FBR, respectively. These figures describe a significant increase of the required length (z/L) to reach steady levels when compared to the initial length. As shown in the Figure 1, temperature profiles of the solid phase achieves steady levels about z/L = 0.6 of start of running of the FBR from z/L = 0.0, all curves describing the solid temperature reaches to steady levels at z/L = 1.0. On the other hand, the Figure 2 describes that the gas temperature reaches steady levels faster than the solid temperature after the feeding is introduced. As results, temperature profiles of the gas phase achieves steady levels about z/L = 0.5 of start of running of the FBR from z/L = 0.0, all curves describing the gas temperature reaches steady levels at z/L = 1.0.
4.1.2. Product Distributions
The performance of SRM process under the operating time of 45 sec, spatial time (τ) of  h, inlet gas temperature of 1211.65 K, and molar water to methane S/C = 3.86 ratio is presented in the Figure 4.
The Figure 4 shows the expected product distribution (molar flow rates) in wet basis (water steam included in the product). As the operation proceeds, it is noticed that methane is consumed by steam reforming reaction with water available in inlet gas mixture. It is clear that the molar flow rates of H2, CO and CO2 increase continuously in the direction of the relative reactor length, while the molar flow rates of CH4 and H2O decrease. The wet basis products at z/L = 1.0 contain about 3.27% of CH4, 44.30% of H2O, 32.59% of H2, 12.87% of CO and 6.87% of CO2.
The efficiency of SRM process by the exit of the reactor (z/L = 1.0), spatial time (τ) of  h, inlet gas temperature of 1211.65K, and molar water to methane S/C = 3.86 ratio is shown in the Figure 5.
The Figure 5 describes that the dynamics evolutions of the product gas distribution reach stable level right away after the feeding is introduced. It can be seen that about 18 sec. of start of running of the conventional FBR from initial conditions, all curves describing the product gas distribution achieve teady state. In the transient period, it is remarked that as the operation proceeds, methane is consumed with water available in inlet gas blend (steam reforming reaction of methane). As a conclusion, it can be verified that at 45 sec. the wet basis products (as shown in the Figure 5) contain about 3.29% of CH4, 44.89% of H2O, 32.97% of H2, 13.07% of CO and 6.21% of CO2.
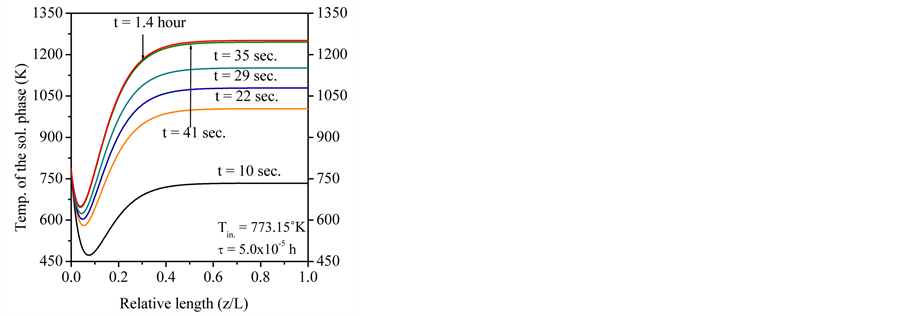
Figure 2. Temperature profiles of the solid phase for the hot start-up simulation along the reactor length (z/L) of conventional FBR. Conditions: Cat. Ni(6.7% wt.)/γ-A2O3, 650 kPa, S/C = 3.86.
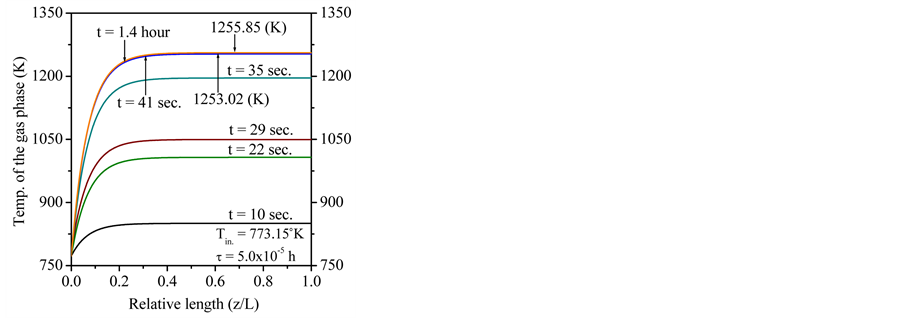
Figure 3. Temperature profiles of the solid phase for the hot start-up simulation along the reactor length (z/L) of conventional FBR. Conditions: Cat. Ni(6.7% wt.)/γ-A2O3, 650 kPa, S/C = 3.86.
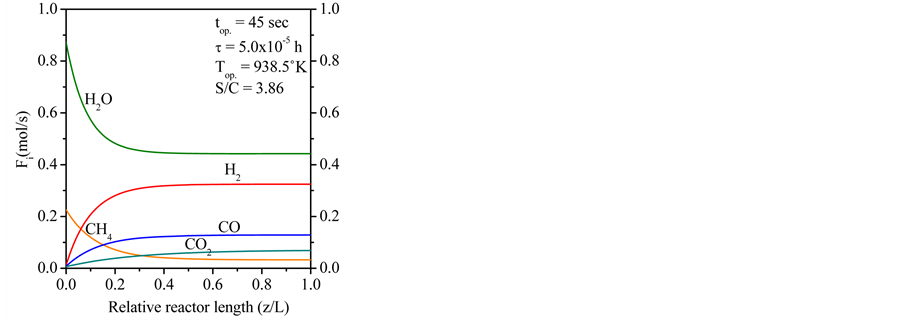
Figure 4. The molar flow rate profiles of chemical species i of SRM in the FBR. Conditions: Cat. Ni(6.7% wt.)/γ-A2O3, 650 kPa.
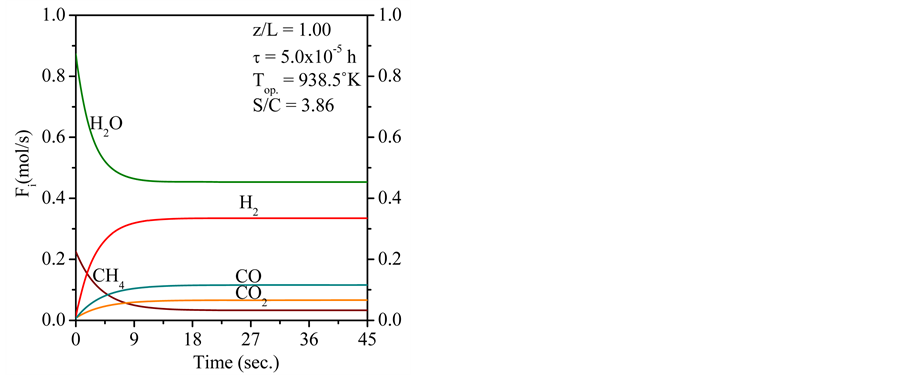
Figure 5. The dynamics evolutions of chemical species i of SRM in the FBR. Conditions: Cat. Ni(6.7% wt.)/γ-A2O3, 650 kPa.
4.1.3. Effect of Reaction Temperature
Based on results from the dynamics modelling after that all curves describing the temperatures and molar flow rates reach to steady levels, the following definitions (the conversion of methane and the yield of hydrogen) of chemical species ( ) are used for describing the FBR as follows:
 (27)
(27)
where  are the conversion of methane, molar flow rates of chemical speciesi (
 ), yield of hydrogen, respectively.
The Figure 6 depicts the effect of the reaction temperature on methane conversion at reaction pressure (650 kPa). As can be seen, the ultimate conversions of methane reach stable levels at reaction temperatures from 500˚C to 977˚C, respectively. In summary, at inlet, the initial equilibrium conversions were 12% (500˚C), 14% (700˚C) and 16% (977˚C), respectively. After 45 sec. of start-up, the ultimate conversions of methane reached steady levels of 97.48%, 73.43% and 54.92% when operating at 977˚C, 700˚C and 500˚C, respectively.
The Figure 7 describes the effect of inlet temperature on the axial profile of hydrogen yield in FBR. The hydrogen yield increases with the inlet feeding temperature increase. Due theendothermicity of the methane steam reforming, the methane conversion increases with temperature as shown in Figure 5. This fact leads to higher production of hydrogen at higher temperature and consequently higher yield at higher inlet feeding temperature. After 45 sec. of start, the yields of hydrogen reach steady levels from 2.2408, 1.9123 and 1.6513 when operating at 977˚C, 700˚C and 500˚C, respectively.
5. Conclusions
Concerning the context of steam reforming of methane in presence of a nickel catalyst (Ni(6.7%wt.)/γ-A2O3), a numerical methodology (method of lines) was applied to establish forecasts over the operation in a FBR reactor. A computer code to process and analyze the performance of the operating variables led to the following conclusions:
1) SRM reactions have great effects on temperature distribution of FBR. The WGS reaction happens in reverse, absorbing heat and reducing the temperature of the catalyst. As a result, we can report that there are negative gradients between the phases.
2) The methane conversion is enhanced in FBR with higher temperature. Simulation results showed that a conversion from 97.48% could be achieved in a FBR at reaction temperature of 977˚C.
3) The H2 yield achieved level from 2.2408 in FBR at reaction temperature of 977˚C while the H2 yield reached level from 1.6513 at reaction temperature of 500˚C.
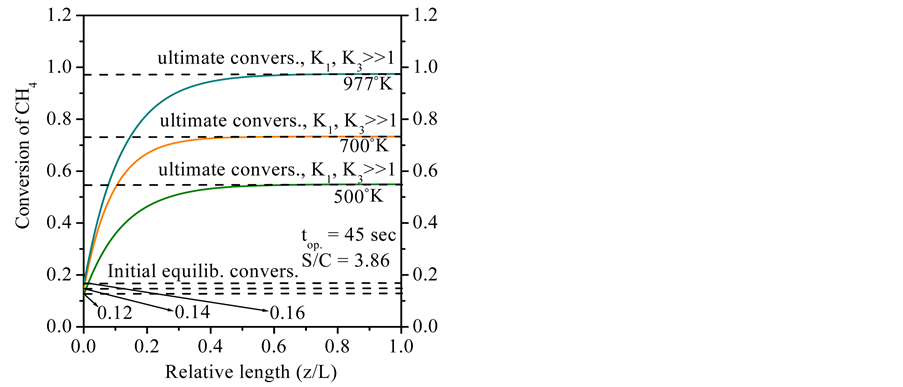
Figure 6. Equilibrium conversion of CH4 affected by inletreaction temperature of SRM in the FBR. Conditions: Cat. Ni(6.7% wt.)/γ-A2O3, 650 kPa.

Figure 7. Yield of H2 affected by inlet reaction temperature of SRM in the FBR. Conditions: Cat. Ni(6.7% wt.)/ γ-A2O3, 650 kPa.
Acknowledgements
The authors of this paper would like to thank CNPq (National Council of Scientific and Technological Development) for the financial support given (Process 48354/2012).
Cite this paper
Fernando Antôniode Araújo Silva,Kenia Carvalho Mendes,Jornandes Dias da Silva, (2016) A Simulation Study of the Steam Reforming of Methaneina Fixed-Bed Reactor. Engineering,08,245-256. doi: 10.4236/eng.2016.84021
References
- 1. Palma, V., Ricca, A. and Ciambell, P. (2013) Structured Catalysts for Methane Auto-Thermal Reforming in a Compact Thermal Integrated Reaction System. Applied Thermal Engineering, 61, 128-133.
http://dx.doi.org/10.1016/j.applthermaleng.2013.03.038 - 2. Silva, J.D. (2014) Dynamic Simulation of the Steam Reforming of Methane for Production of Hydrogen in a Catalytic Fixed Bed Membrane Reactor. Chemical Engineering Transactions, 39, 961-966.
- 3. Pantoleontos, G., Kikkinides, E.S. and Georgiadis, M.C. (2012) A Heterogeneous Dynamic Model for the Simulation and Optimisation of the Steam Methane Reforming Reactor. International Journal of Hydrogen Energy, 37, 16346-16358.
http://dx.doi.org/10.1016/j.ijhydene.2012.02.125 - 4. Karimipourfard, D., Kabiri, S. and Rahimpour, M.R. (2014) A Novel Integrated Thermally Double Coupled Configuration for Methane Steam Reforming, Methane Oxidation and Dehydrogenation of Propane. Journal of Natural Gas Science and Engineering, 21, 134-146.
http://dx.doi.org/10.1016/j.jngse.2014.06.018 - 5. Zamaniyan, A., Behroozsarand, A. and Ebrahimi, H. (2010) Modeling and Simulation of Large Scale Hydrogen Production. Journal of Natural Gas Science and Engineering, 2, 293-301.
http://dx.doi.org/10.1016/j.jngse.2010.10.004 - 6. Zamaniyan, A., Ali Khodadadi, A., Mortazavi, Y. and Manafi, H. (2011) Comparative Model Analysis of the Performance of Tube Fitted Bulk Monolithic Catalyst with Conventional Pellet Shapes for Natural Gas Reforming. Journal of Industrial and Engineering Chemistry, 17, 767-776.
http://dx.doi.org/10.1016/j.jiec.2011.05.028 - 7. Kho, E.T., Scott, J. and Amal, R. (2016) Ni/TiO2 for Low Temperature Steam Reforming of Methane. Chemical Engineering Science, 140, 161-170.
http://dx.doi.org/10.1016/j.ces.2015.10.021 - 8. Solsvik, J., Haug-Warberg, T. and Jakobsen, H.A. (2016) Implementation of Chemical Reaction Equilibrium by Gibbs and Helmholtz Energies in Tubular Reactor Models: Application to the Steam-Methane Reforming Process. Chemical Engineering Science, 140, 261-278.
http://dx.doi.org/10.1016/j.ces.2015.10.011 - 9. Xu, J. and Froment, G.F. (1989) Methane Steam Reforming, Methanation and Water-Gas Shift: I. Intrinsic Kinetics. AIChE Journal, 35, 88-96.
http://dx.doi.org/10.1002/aic.690350109 - 10. Oliveira, C.C.B. and Silva, J. D. (2013) Mathematical Modelling of the Steam Reforming of Toluene for Fuel Gas Production in a Fixed Bed Catalytic Reactor. Chemical Engineering Transactions, 35, 307-312.
- 11. Northrop, P.W.C., Ramachandran, P.A., Schiesser, W.E. and Subramanian, V.R. (2013) A Robust False Transient Method of Lines for Elliptic Partial Differential Equations. Chemical Engineering Science, 90, 32-39.
http://dx.doi.org/10.1016/j.ces.2012.11.033 - 12. Subramaniana, V.R. and White. R.E. (2004) Semianalytical Method of Lines for Solving Elliptic Partial Differential Equations. Chemical Engineering Science, 59, 781-788.
http://dx.doi.org/10.1016/j.ces.2003.10.019 - 13. Wang, F. Zhou, J. and Wang, G. (2012) Transport Characteristic Study of Methane Steam Reforming Coupling Methane Catalytic Combustion for Hydrogen Production. International Journal of Hydrogen Energy, 37, 13013-13021.
http://dx.doi.org/10.1016/j.ijhydene.2012.05.062 - 14. Gil, A.G., Wu, Z., Chadwick, D. and Li, K. (2015) Ni/SBA-15 Catalysts for Combined Steam Methane Reforming and Water Gas Shift-Prepared for Use in Catalytic Membrane Reactors. Applied Catalysis A: General, 506, 188-196.
http://dx.doi.org/10.1016/j.apcata.2015.09.009 - 15. Fukuhara, C., Yamamoto, K., Makiyama, Y., Kawasaki, W. and Watanabe, R. (2015) A Metal-Honeycomb-Type Structured Catalyst for Steam Reforming of Methane: Effect of Preparation Condition Change on Reforming Performance. Applied Catalysis A: General, 492, 190-200.
http://dx.doi.org/10.1016/j.apcata.2014.11.040
Nomenclatures
 Heat transfer area per volume of catalyst bed, m2/m3
 Specific heat of gas, J/kg∙K
 Specific heat of catalyst bed, J/kg∙K
 Inlet molar flow rates of chemical species i, kmol/h
 Gravity acceleration, m/h2
 Reaction (R1) rate constants, kmol kPa0.5/kgcat h
 Reaction (R2) rate constants, kmol kPa−1/kgcat h
 Reaction (R3) rate constants, kmol kPa0.5/kgcat h
 Adsorption constant of chemical species i (i = CH4, H2 and CO), kPa−1
 Adsorption constant of H2O, (-)
 Equilibrium constants, i = 1 and 3, kPa2
 Equilibrium constants, (-)
 Reactor length, (m)
 Partial pressure of chemical species i in the shell side (i = CH4, H2O, H2, CO and CO2), kPa
 Operating pressure, kPa
 Gas flow rate m3/h
 Particle radius at the surface
 Gasconstant, J/kmol K
 Reaction rates i (i = 1, 2 and 3), kmol/kgcat.h
 Net rate of chemical species i (i = 1, 2, 3, 4 and 5), kmol/kgcat.h
 Reactorradius, m
 Gas Temperature, ˚C
 Solid Temperature, ˚C
 Time, sec.
 Superficialvelocity, m/h
 Molar fractions of chemical species i (i = CH4, H2O, H2, CO and CO2), (-)
 Spatial coordinate, m
Greek Letters
 Spatial time, sec
 Void fraction of bed, (-)
 Catalyst density, kg/m3
 Effectiveness factor of reactions, i = 1, 2 and 3
NOTES

*Corresponding author.