Engineering
Vol. 3 No. 11 (2011) , Article ID: 8661 , 4 pages DOI:10.4236/eng.2011.311137
Analysis of the Effects of Valve Propagated Pressure Surge on Pipe Flow
Department of Mechanical Engineering, Rivers State University of Science and Technology, Port Harcourt, Nigeria
E-mail: lebele-alawa.thaddeus@ust.edu.ng
Received September 15, 2011; revised October 8, 2011; accepted October 22, 2011
Keywords: Pressure, Surge, Crude-oil, Pipes
ABSTRACT
This paper analyses the effects of pressure surge on pipe flow. The surge pressure investigated is that propagated by the emergency relief coupling valve (ERV) connected to a loading system carrying crude oil from four flow stations. The results of the analysis show remarkable changes in the fluid parameters arising from the shut down of the loading system by the ERV in the event of storm. For instance, in pipe 1 the pressure dropped from an initial value of 25 × 105 N/m2 to 19 × 105 N/m2, while the velocity of flow increased from 1.76 m/s to 2.97 m/s. The system showed high Reynolds number indicating turbulent flow and the Mach number in pipe IV as high as 3.6 indicating supersonic flow. The consequence of the pressure drop is column separation or cavitations. If the bubbles collapse, re-surge pressures occur leading to possible leakages and rupture of the pipes. All these can be minimized by selecting appropriate surge suppression devices for the system.
1. Introduction
It is imperative to transport fluids through pipes to places where they are needed. Crude oil (a special type of fluid) is transported through a system of large diameter pipes. The force that propels the fluid is its pressure which usually dissipates as it travels through the pipeline. Also considering the development in engineering fluid system, the increase in flow rates of fluid using large pumps is now a common practice. In controlling such systems, valves are used. The closure and opening of valve in a pipeline leads to pressure rise.
Lingireddy, et al. [1] carried out the analysis of pressure surge in pipeline Systems resulting from air releases. In their research, they noted that since air valves are integral parts of a long pipeline passing through elevations, pressure surge propagation is quite inevitable. Pressure surge will occur due to the release of air accumulated in a pipeline in the course of transmission. But the effect of this would be reduced to a minimum if proper sized surge suppression device like orifice plate is installed in the system. The work specifically considered the pressure reduction in a pipeline system when a 12.5 mm orifice was installed in pipeline compared to a 75 mm orifice also installed. The pressure surge when a 12.5 mm orifice plate was installed reduced to about 30 meter of water while the pressure when a 75 mm orifice was installed was still as high as 168 meter of water from a surge pressure of 210 meters of water.
Krope and Goricanec [2] carried out the analysis of the influence of changing pipe diameter on flow pressure characteristics of pipe network using linear Theory method. The analysis showed that the pressure drops in the network are in accordance with the Darcy-Weisbach equation. According to the research, the effect of surge can be minimized by increasing the pipe diameter, since a large diameter pipe reduces the speed of flow and flow rate of fluid. This will in turn have an adverse effect on surge pressure propagation [3].
Douglas, et al. [4] examined rigid column theory of pressure surge analysis as one that may be applied to transient conditions displaying slow rate of flow accelerations. Liu [5] predicted surge pressures which results from running liners. His work was based on a computer program that considered the analysis on three broad approaches viz: sensitivity analysis which considered surge propagation at different flow speed; design mode which considered surge propagation on the basis of depth of pipe underground at different flow speed; and thirdly, the analysis based on varying flow speed with liners on pipe. His analyses concluded that pipe ending condition has much influence on the pressure surge propagation. Also the use of specially developed engineering software for advanced simulation and evaluation of pipe flow pressure has been studied [6]. Lubinski [7], Lal [8], and Mitchel [9] used dynamic models to predict Surge Pressures. These models are complex, requiring not only more input data, which may not be readily available to engineers, but also more computer resources.
This paper presents surge analyses carried out on four different pipes in which crude oil flows, aided by pumps from four different flow stations. The four pipes empty into a central point termed the manifold station or point (stagnation) from which the fluid connected by the various pipes join a central pipe which terminates at a loading point. The loading system has two valves namely: the normal shut-off valve (NSV) and the emergency relief coupling valve (ERV).
2. Materials and Methods
The values of the pipe parameters relevant to this analysis were obtained from direct measure-ments. The fluid (crude oil) parameters were obtained from operational log/data sheets. Then calculations were made using existing and derived formulas to obtain the values of the parameters that could not be measured directly or derived from log/data sheets.
The friction factor, f, was determined for each pipeline using the Moody Chart. The head loss due to friction Hf in the pipe was determined using the Darcy-Weisbach equation:
 (1)
(1)
The shock wave speed was evaluated for each pipe using the formula
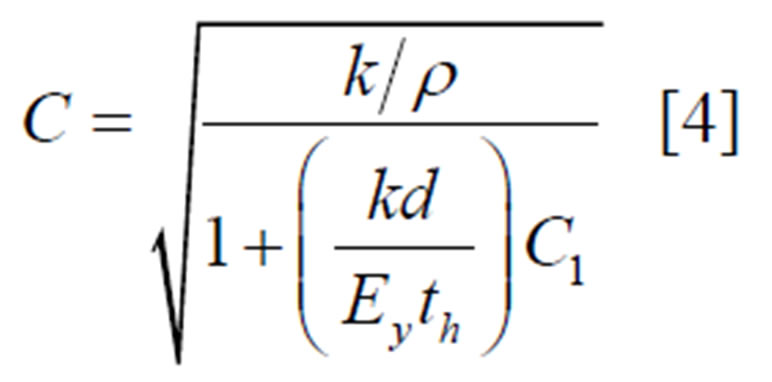 (2)
(2)
The period (t) for pressure wave to travel from source to the manifold is calculated using
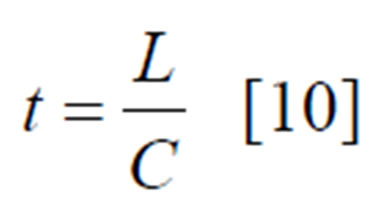 (3)
(3)
The Mach number M is evaluated from the formula
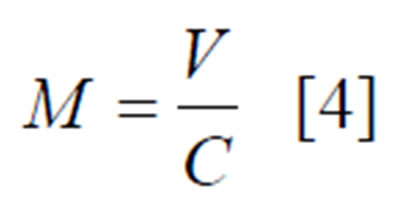 (4)
(4)
The Mass flow rate is evaluated using the relationship
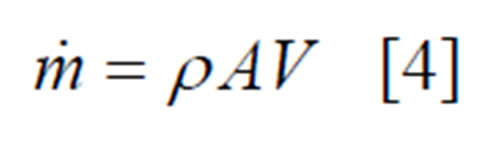 (5)
(5)
The stagnation temperature and pressures are calculated using the formulas:
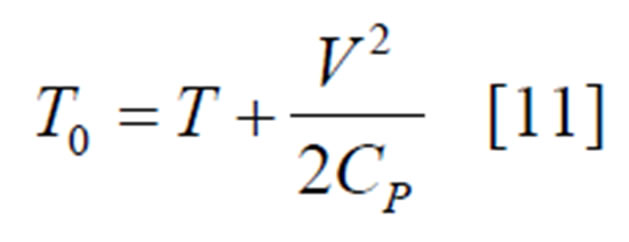 (6)
(6)
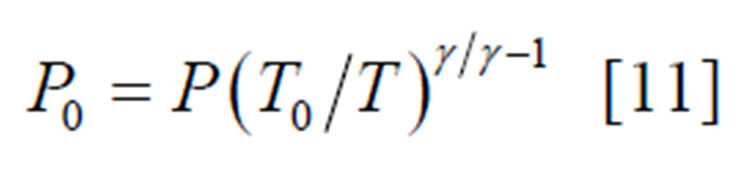 (7)
(7)
3. Results and Discussions
The results are presented in tables 1-5 below.

Table 1. Pipe parameters.

Table 2. The fluid (Crude oil) parameters.

Table 3. Head loss Hf analysis results.
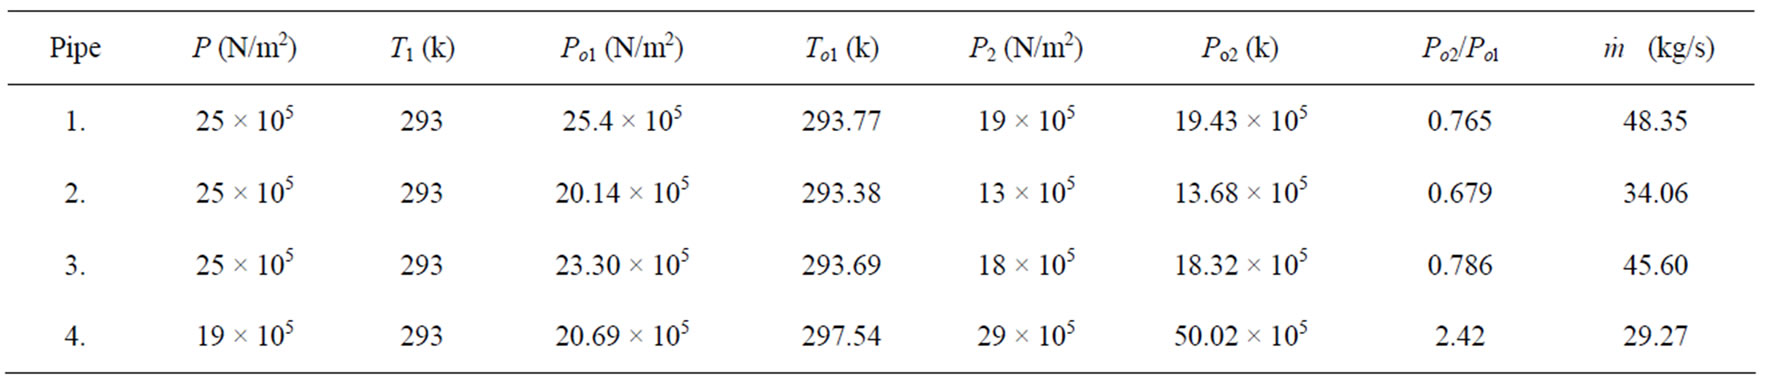
Table 4. Table showing stagnation temperatures, pressures and mass flow rate.
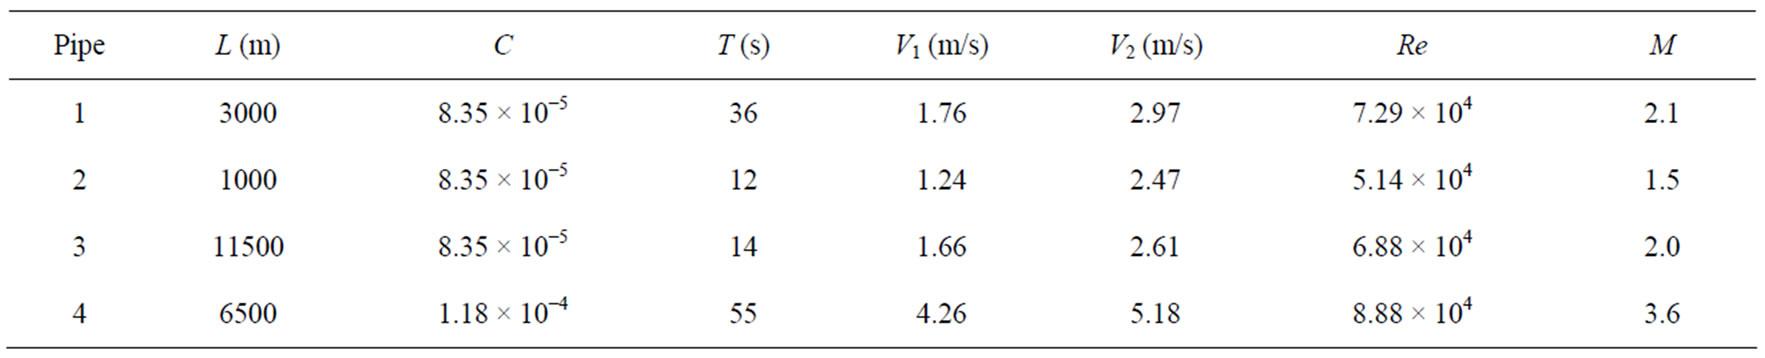
Table 5. Table Showing Wave period, Reynolds number and Mach number.
The results indicate the existence of surge pressure in the system.
In pipe 1, the velocity increased from 1.76 m/s to 2.97 m/s while the pressure dropped from 25 × 105 N/m2 to 19 × 105 N/m2 with a slight increase in temperature and a high friction loss in the pipe. The flow is super sonic and turbulent having a Mach number of 2.1 and Reynolds number of 7.29 × 10⁴. The same sequence of parameter changes is observed in pipes 2 and 3. Pipe 4 shows an increase in pressure from 19 × 105 N/m2 to 29 × 105 N/m2. This pipe showed the highest Mach number of 3.6 and the disturbance lasted 55 seconds. It also has the highest frictional loss of 2132.32 m of crude oil.
The decrease in pressure in the pipes may result in column separation. When the vapour cavity collapses, a re-surge pressure phenomenon will occur. This fluctuation in pressure subject the pipelines to uneven force distributions which subsequently weakens the joints and leakages may occur. Also the lifespan of the pipeline is threatened as the collapsing bubbles can cause local erosion of the internal pipe surfaces.
4. Conclusions
The results of the analysis presented in this work show remarkable changes in the fluid parameters. The pressure fluctuations along the supply pipeline are largely due to the instantaneous closure of the emergency relief coupling valve (ERV). The flow in all the pipelines is turbulent showing evidence of pressure surge. As a result of turbulence in the pipeline, the velocity gradients near the pipe walls are quite large resulting in more shear. The surge generated can result to cavitations or column separation
5. REFERENCES
- S. Lingireddy, D. J. Wood and N. Zloczower, “Pressure Surges in Pipeline System Resulting from Air Releases,” Journal AWWA, Vol. 96, No. 7, July 2004, pp. 88-94.
- J. Krope and D. Goricanec, “Analysis of Pipe Networks including Pumps,” Energy and Buildings, Vol. 17, No. 2, 2003, pp. 141-145. doi:10.1016/0378-7788(91)90006-O
- J. Krope, D. Dobersek and D. Goricanec, “Flow Pressure Analysis of Pipe Networks with Linear Theory Method,” Proceedings of WSEAS/IASME International Conference on Fluid Mechanics, Miami, Florida, 18-20 January 2006, pp. 59-62.
- J. F. Douglas, J. M. Gasiorek and J. A. Swaffield, “Fluid Mechanics,” 4th Edition, Pearson Education, New Jersey, 2002, pp. 287-288, 516, 631.
- G. Liu, “Predicting Surge Pressures That Result from Running Liners,” Pegasus Ventures, Inc., Houston, 2001.
- Sunrise Systems Customer Education Training Manuel, “Modelling Pipeline and Utility Systems using Pipnet Vision,” 2008. http://www.sunrise-sys.com
- A. Lubinski, F. H. Hsu and K. G Nolte, “Transient Pressure Surges due to Pipe Movement in an Oil Well,” Oil & Gas Science and Technology—Revue de l’IFP, Vol. 32, No. 3, 1977, pp. 307-348. doi:10.2516/ogst:1977019
- M. Lal, “Surge and Swab Modeling for Dynamic Pressure and Safe Trip Velocities,” Proceedings 1983 IADC/ SPE Drilling Conference, New Orleans, 1983.
- R. F. Mitchell, “Surge Pressure: Are Steady State Models Adequate?” Proceedings SPE 63rd Annual Technical Conference, Houston, 1988.
- R. K. Raiput, “A Textbook of Fluid Mechanics and Hydraulic Machines,” S. Chand and Company Ltd, New Delhi, 2004, pp. 604, 724.
- T. D. Eastop and A. McConkey, “Applied Thermodynamics for Engineering Technologists,” Prentice Hall, Singapore, 1993.
Notations
A Area of pipe, m2
C Shock wave speed, m/s
C1 Pipe distensibility (restrain factor)
Cp Specific heat of fluid at constant pressure, kJ/kgK
d Diameter of pipe, m
Ey Young’s Modulus for the pipe material, N/m2
ERV Emergency relief coupling valve
f Moody friction factor
g Acceleration due to gravity, m/s2
Hf head loss due to friction, m
K Fluid bulk Modulus, N/m2
L Length of pipe, m
M Mach Number
 Mass flow rate, Kg/s
NSV Normal shut-off valve
P Pipe pressure, N/m2
Po Stagnation pressure, N/m2
Re Reynolds number
t Period (time), s
th Pipe thickness, m
T Temperature, K
To Stagnation temperature, K
V Flow velocity, m/s
Greek Letters
ρ Mass density of fluid, Kg/m3
γ Ratio of specific heats
Suffixes
1. Initial state
2. Final state