Intelligent Control and Automation
Vol.4 No.1(2013), Article ID:27704,6 pages DOI:10.4236/ica.2013.41006
Fault Detection and Isolation in Industrial Systems Based on Spectral Analysis Diagnosis
1Electrical Engineering Field, Faculty of Science and Technology, University of Djelfa DZ, Djelfa, Algeria
2Faculty of Science and Technology, University of Medea, Medea, Algeria
Email: hafaifa@hotmail.com, guemana_m@yahoo.fr, attia_daoudi@yahoo.fr
Received November 9, 2012; revised December 21, 2012; accepted December 30, 2012
Keywords: Diagnosis; Spectral Analyzes; Faults Detection and Isolation; Condition Monitoring
ABSTRACT
The diagnoses in industrial systems represent an important economic objective in process industrial automation area. To guarantee the safety and the continuity in production exploitation and to record the useful events with the feedback experience for the curative maintenance. We propose in this work to examine and illustrate the application ability of the spectral analysis approach, in the area of fault detection and isolation industrial systems. In this work, we use a combined analysis diagram of time-frequency, in order to make this approach exploitable in the proposed supervision strategy with decision making module. The obtained results, show clearly how to guarantee a reliable and sure exploitation in industrial system, thus allowing better performances at the time of its exploitation on the supervision strategy.
1. Introduction
The development of diagnosis system appears additional expensive solution in the industrial investment, but it deadens during the production phase. During the execution of the strategy of diagnosis, the measurable signals can provide significant information, on the defects appearance to facilitate the determination of the supervision parameters, representing the defects signatures, their degree and persistence. From these parameters, the decisional system can conceive powerful diagnosis approach [1-3]. To realise this prospect, we proposes in this work to examine and illustrate the application ability of the spectral analysis approach, in the area of fault detection and isolation industrial systems. Thus it is essential to maintain the exploitation system apart from this instability zone. The signals temporal representation does not give a good sensitivity of fault detection on defective components, while the frequencies representation given by Fourier transform does not allow the temporal localization of these components [4-6]. In this work, we use a combined analysis diagram of time-frequency, in order to make this approach exploitable in the proposed supervision strategy with decision making module.
The obtained results, show clearly how to guarantee a reliable and sure exploitation of the studied industrial system, thus allowing better performances at the time of its exploitation on the supervision strategy. The application results of the investigated approach, validated by experimental test, allowing that the use of the combined time-frequency method give excellent results on the tested models with better performances. The proposed approach, allows the detection of the defects at the beginning of their appearance. The studied approach ensures an effective monitoring, allows detecting the defects to avoid any degradation and also to ensure an operation reliable and increase the working time of this industrial system.
2. Diagnosis Based on Spectral Analysis Approach
The detection and the identification of the defects in the industrial systems it is an important subject in modern automation engineering companies [7-9]. Indeed, in large industrial applications it is often posed the question, how guarantee the people security and preserving their environment?
The diversity of the developed approaches for the diagnosis of the industrial systems, seem to be the result of various applications aimed by specifications which result from it. Thus, the nature of information available on the system or the defects type to be detected led to the implementation of this specific strategy [3,6,7]. In this work, we present the application of the spectral analysis method to the diagnosis of the complex industrial systems, based on Fourier transform; we consider the signal  absolutely integrable on
 , the transform of Fourier of this signal is to give by:
 (1)
(1)
This transform is invertible by:
 (2)
(2)
While applying this transform, we pass from the temporal field to the frequencies presentation, the energy is preserved in both representations. It is noted that the signal  tends towards the zero when t tends towards the infinite, for practical reasons, this signal is sampling in the following form [8]:
 (3)
(3)
With  is an approximation of
  at the points
![]() . The power density spectral is defined as being the square module of the Fourier transform of
. The power density spectral is defined as being the square module of the Fourier transform of .
.
In our investigation, we add a Gaussian white signal disturbed, as it’s shown on the Figure 1, this white vi-
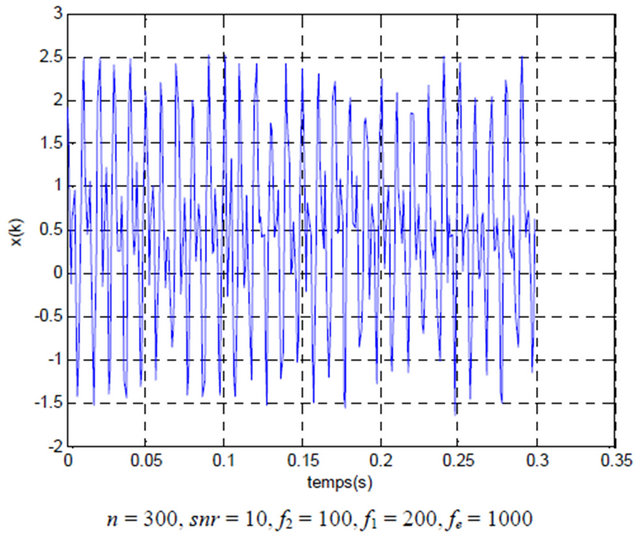
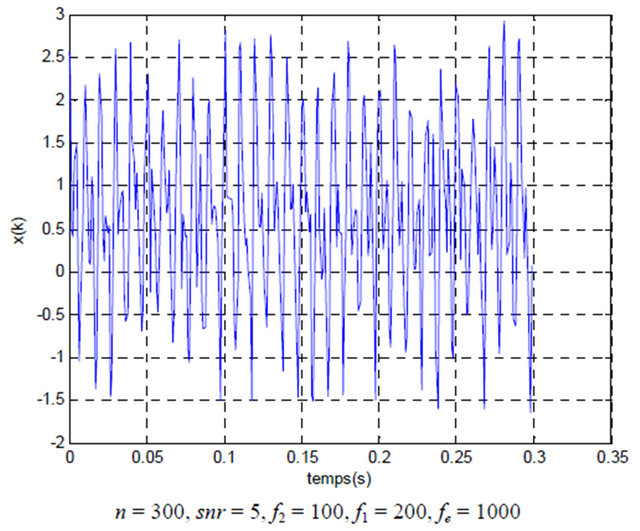
Figure 1. Gaussian white signal disturbed.
bration is a realized with a random process, were the power density spectral is the same for all frequencies. This white vibration is a normal law of average and variance given by the following equation [10]:
 (4)
(4)
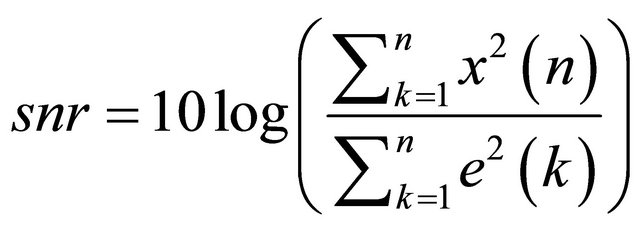
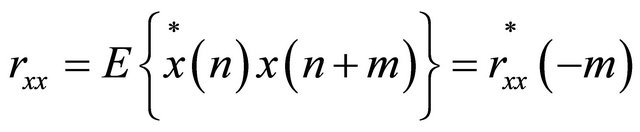
In literary, there exist many methods to estimate the faults [4,5,11]. In our investigation, we chose the power density spectral, the estimation being carried out directly starting from the Fourier transform of the signal without concerned the models parametric in consideration. Under the hypothesis of stationary and ergodic signals, the function of autocorrelation of the power density spectral is defined by:
 (5)
(5)
 (6)
(6)
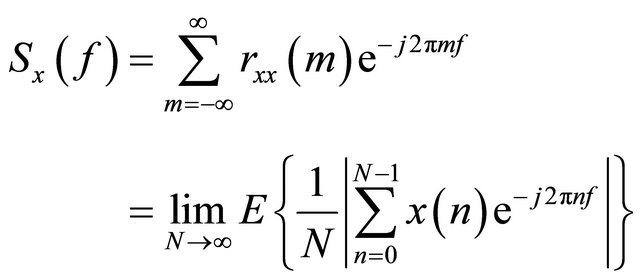
One supposes we have N samples  of the signal to be analyzed and we thus seek to consider the power density spectral starting from the measured data. Using a nonparametric estimate of the spectrum, each method being related to the equalities in the Equaion (6). The representation of the power density spectral using the FFT is shown on Figure 2, this resolution method is nominal one Hz equal to the inverse number of multiplies sampling by the sampling frequency; this resolution decreases the important noise in our system.
2.1. Estimation of the Spectrum by the Periodogram Method
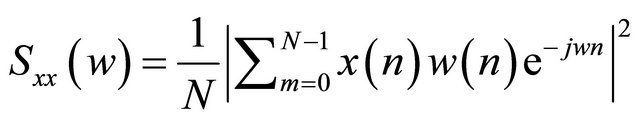
Now we will use the spectrum estimation by the method of periodogram [12], in this method we used the signal directly. The spectrum is estimated by the following relation:
 (7)
(7)
The periodogram is the convolution of the spectrum by a window in cardinal sine, there resolution is about the periodogram is a skewed estimator, given by [13]:
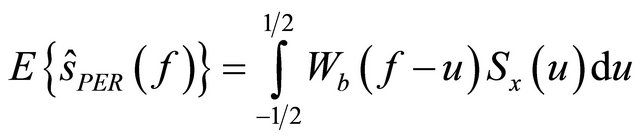 (8)
(8)

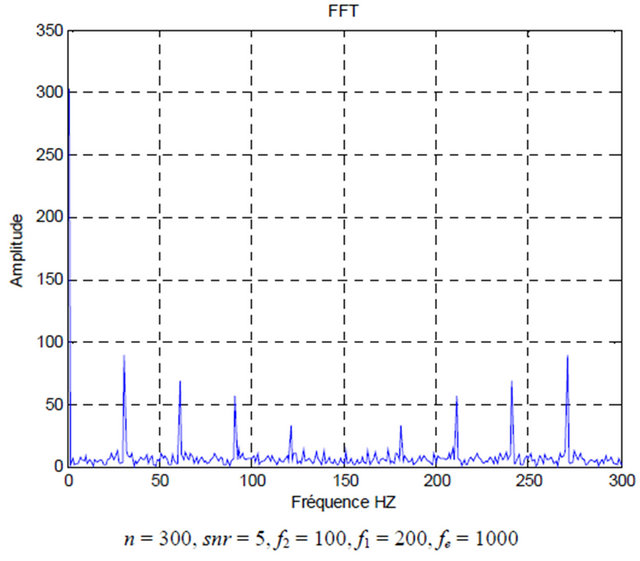
Figure 2. Power density spectral using the Fast Fourier Transform FFT.
 (9)
(9)
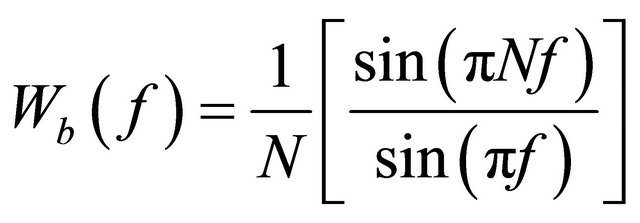
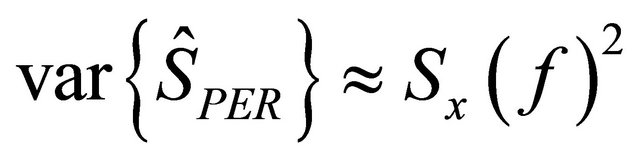
This periodogram representation is the triangular window of Fourier transform, when , the presentation of the power spectrum using the periodogram method, is shown on the Figure 3, the skew becomes null, that show us that the variance is practically independent of N and proportional to the spectrum, given by [6]:
 (10)
(10)
The periodogram is not consistent an estimator for the DSP, to decrease the variance of this estimator, we can used the periodogram modify. It is possible to balance the estimator of the autocorrelation function by a window function  on N measures. The spectral estimator must be calculated as follows:
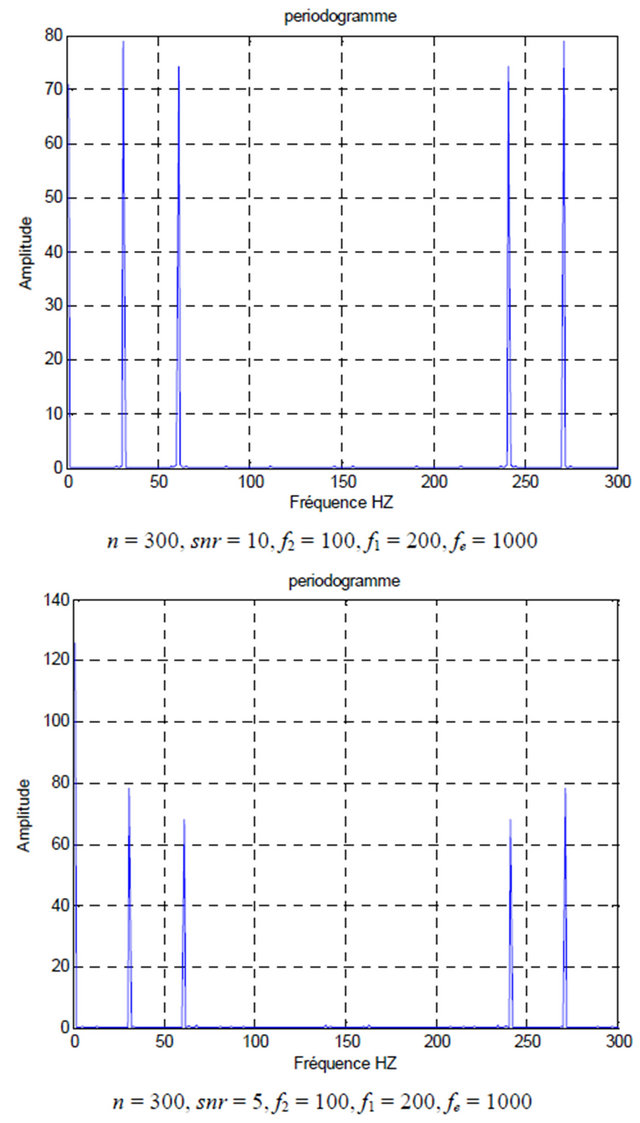
Figure 3. Power density spectral using the periodogram method.
 (11)
(11)
Using a normalized function U to eliminate the skew introduced by the window function , given by:
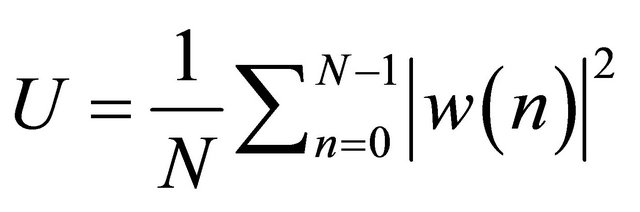 (12)
(12)
This new estimator is as skewed by comparison with the precedent; the applied window function to the samples is obtained before calculation of FFT. His advantage is reduced its variance, because the effect of smoothing of the power density spectral is realized by the convolution with the window function. The representation of the power density spectral, by using of the periodogram modify method is shown on Figure 4. The choice of the window function becomes important, when the power density spectral of the studied signal includes superimposed lines of broad band noise, like the vibration in our application.
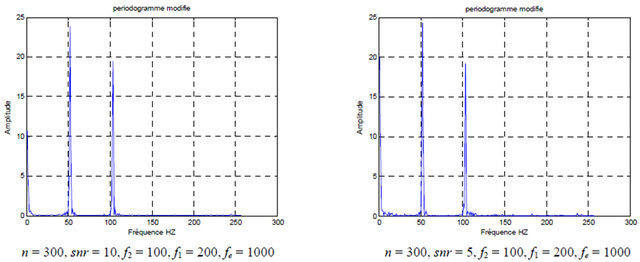
Figure 4. Power density spectral using the periodogram modify method.
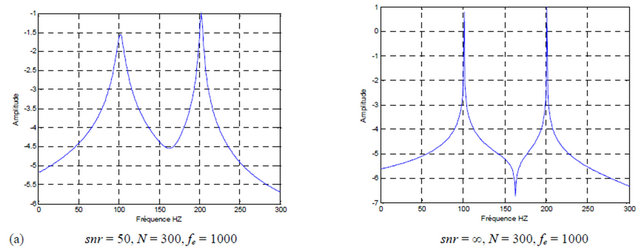
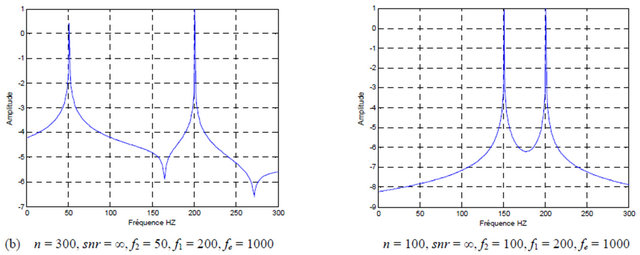
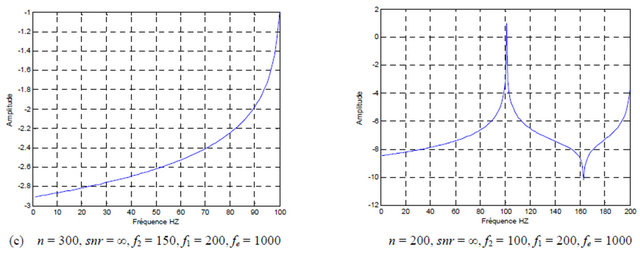
Figure 5. (a) Power density spectral using Prony method: Analyzed with the snr number; (b) Power density spectral using Prony method: Analyzed with the f1, f2; (c) Power density spectral using Prony method: Analyzed with the variation of n.
2.2. Power Density Spectral Estimated by PRONY
The proposed approach of detection and localisation of defects using PRONY [12] method is an exponential sum of the probability defects model to approach at the follows , given by:
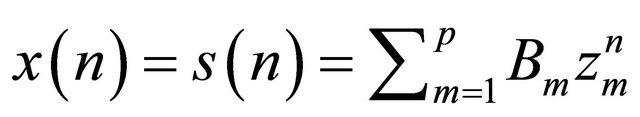 (13)
(13)
In this model, the exponential  noted the poles of model are carrying the information of the nature of defects, known in signal treatment and in system modelling by:
 and
and  (14)
(14)
With  are respectively the amplitude and the phase of the damping vector and
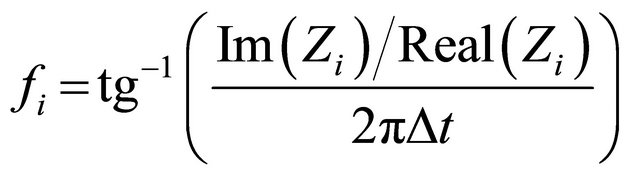
  is the frequency and the step of sampling. To determine the frequencies and the damping coefficients, in our application we have used the following equations:
 (15)
(15)
 (16)
(16)
For the determination of the amplitudes and the phases we based on the Equations (15) and (16):
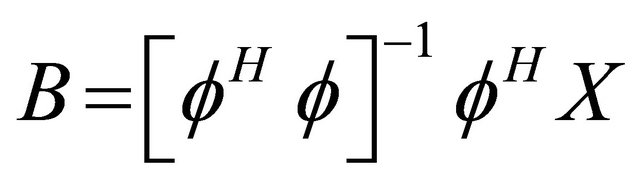 (17)
(17)
The approximation function becomes then:
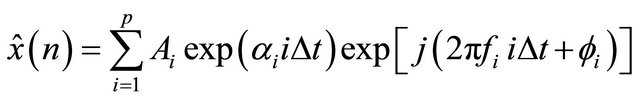 (18)
(18)
The power density spectral estimated by PRONY is then given by:
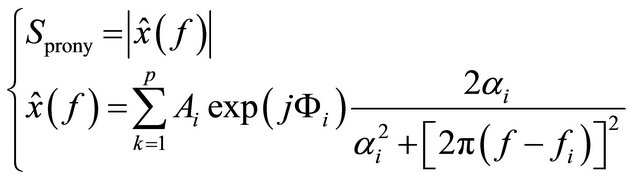 (19)
(19)
The spectral analysis consists in raising the fault signal measures on the examined system and to proceed has a systematic analysis, to seek the presence of fault situation of the whole of the defects suitable for affect the installation considered. That gives access to the diagnosis; to identify with precision the nature of the anomaly and to specify revolves it with a good localization of these defects. The representation of the power density spectral with the use of Prony method is shown on the Figures 5(a)-(c).
3. Conclusion
In the presented results in this paper, we have showed that the use of the analysis spectral method, the power of the signals models using Prony method, these responses shows that the technique of Prony makes it possible to distinguish the frequencies  and
and  in spite of their close values, and in the presence of satisfactory noise signal
 . For our investigation the starting and stopping control of the studied sytsem is supervised by the distributed control system, the fault measurements in the used system is done on-line, these measurements are taken periodically by using the various measurements sensors.
REFERENCES
- C. M. Xia, J. Howell and N. F. Thornhill, “Detecting and Isolating Multiple Plant-Wide Oscillations via Spectral Independent Component Analysis,” Automatica, Vol. 41, No. 12, 2005, pp. 2067-2075. doi:10.1016/j.automatica.2005.02.011
- O. Coutier-Delgosha, R. Fortes-Patella and J. L. Reboud, “Evaluation of the Turbulence Model Influence on the Numerical Simulations of Unsteady Cavitation,” Journal of Fluids Engineering, Vol. 125, No. 1, 2003, pp. 38-45. doi:10.1115/1.1524584
- A. Hafaifa, A. Daoudi and K. Laroussi, “Application of Fuzzy Diagnosis in Fault Detection and Isolation to the Compression System Protection,” Control and Intelligent Systems ACTA Press, Vol. 39, No. 3, 2011, pp. 151-158.
- A. Hafaifa, F. Laaouad and K. Laroussi, “A Numerical Structural Approach to Surge Detection and Isolation in Compression Systems Using Fuzzy Logic Controller,” International Journal of Control, Automation, and Systems, Vol. 9, No. 1, 2011, pp. 69-79. doi:10.1007/s12555-011-0109-3
- Y. Tsujimoto, Y. Yoshida, Y. Maekawa, S. Watanabe, and T. Hashimoto, “Observations of Oscillating Cavitation of an Inducer,” Journal of Fluids Engineering, Vol. 119, No. 1, 1997, pp. 775-781. doi:10.1115/1.2819497
- J. L. Weiss, “Threshold Computations for Detection of Failures in SISO Systems with Transfer Function Errors,” Proceedings of the American Control Conference, Atlanta, 15-17 June 1988, pp. 2213-2218.
- A. S. Willsky, “A Survey of Design Methods for Failure Detection in Dynamic Systems,” Automatica Journal, Vol. 12, 1976, pp. 601-611. doi:10.1016/0005-1098(76)90041-8
- A. Hafaifa, F. Laaouad and K. Laroussi, “Fuzzy Logic Approach Applied to the Surge Detection and Isolation in Centrifugal Compressor,” Automatic Control and Computer Sciences, Vol. 44, No. 1, 2010, pp. 53-59. doi:10.3103/S0146411610010074
- M. Guemana, S. Aissani and A. Hafaifa, “Use a New Calibration Method for Gas Pipelines: An Advanced Method Improves Calibrating Orifice Flowmeters While Reducing Maintenance Costs,” Hydrocarbon Processing Journal, Vol. 90, No. 8, 2011, pp. 63-68.
- D. Van Schrick, “Estimator Schemes for Instrument Fault Detection and Isolation,” IEEE Proceeding of the International Conference on System, Man and Cybernetic, LeTouquet, 17-20 October 1993, pp. 406-411. doi:10.1109/ICSMC.1993.385045
- B. K. Walker and E. Gai, “Fault Detection Threshold Determination Techniques Using Markov Theory,” International Journal Guidance, Control and Dynamics, Vol. 2, No. 4, 1979, pp. 313-319. doi:10.2514/3.55881
- P. Weber, S. Gentil, P. Ripoll and L. Foulloy, “Multiple Fault Detection and Isolation,” Proceeding of the 14th IFAC World Congress, Vol. P, No. 7e-092, 1999, pp. 223-228.
- H. L. Jiang, M. A. A. Shoukat Choudhury and L. Sirish Shah, “Detection and Diagnosis of Plant-Wide Oscillations from Industrial Data Using the Spectral Envelope Method,” Journal of Process Control, Vol. 17, No. 2, 2007, pp. 143-155. doi:10.1016/j.jprocont.2006.09.006