Journal of Information Security
Vol. 3 No. 3 (2012) , Article ID: 21343 , 9 pages DOI:10.4236/jis.2012.33027
Data Stream Subspace Clustering for Anomalous Network Packet Detection
Department of Computer Science, Houghton College, Houghton, USA
Email: wei.hu@houghton.edu
Received March 17, 2012; revised April 26, 2012; accepted May 5, 2012
Keywords: Anomaly Detection; Intrusion Detection System; Network Security; Preference Subspace Clustering; Stream Data Mining
ABSTRACT
As the Internet offers increased connectivity between human beings, it has fallen prey to malicious users who exploit its resources to gain illegal access to critical information. In an effort to protect computer networks from external attacks, two common types of Intrusion Detection Systems (IDSs) are often deployed. The first type is signature-based IDSs which can detect intrusions efficiently by scanning network packets and comparing them with human-generated signatures describing previously-observed attacks. The second type is anomaly-based IDSs able to detect new attacks through modeling normal network traffic without the need for a human expert. Despite this advantage, anomaly-based IDSs are limited by a high false-alarm rate and difficulty detecting network attacks attempting to blend in with normal traffic. In this study, we propose a StreamPreDeCon anomaly-based IDS. StreamPreDeCon is an extension of the preference subspace clustering algorithm PreDeCon designed to resolve some of the challenges associated with anomalous packet detection. Using network packets extracted from the first week of the DARPA ’99 intrusion detection evaluation dataset combined with Generic Http, Shellcode and CLET attacks, our IDS achieved 94.4% sensitivity and 0.726% false positives in a best case scenario. To measure the overall effectiveness of the IDS, the average sensitivity and false positive rates were calculated for both the maximum sensitivity and the minimum false positive rate. With the maximum sensitivity, the IDS had 80% sensitivity and 9% false positives on average. The IDS also averaged 63% sensitivity with a 0.4% false positive rate when the minimal number of false positives is needed. These rates are an improvement on results found in a previous study as the sensitivity rate in general increased while the false positive rate decreased.
1. Introduction
Since the explosion of internet usage in the early 1990s, people are now able to communicate over larger distances at a faster rate than previously possible. As the number of Internet-capable devices available to consumers increases, new forms of communication are created. This new level of connectivity is often exploited as computer attackers are now able to share and distribute malicious programs and ideas effectively allowing inexperienced attackers to create sophisticated viruses and malware. Because of the increased need for network security, Intrusion Detection Systems (IDSs) are an integral part of any network [1].
Intrusion Detection Systems focus on preventing modern-day attacks directed towards a network through two techniques. The first type use signatures created by a human expert to represent and detect previous attacks. The signature-based IDSs provide a simple and effective security tool through signature matching, but are unable to detect new attacks [2]. The second type, anomalybased IDSs, take a different approach by modeling normal traffic and comparing each incoming packet to this model [1]. Although anomaly-based IDSs can automatically detect new attacks, they generally suffer from a high false positive rate (normal packets being classified as abnormal) and are vulnerable to polymorphic attacks. These attacks try to fool anomaly-based IDSs by making malicious packets appear normal. Because anomalybased IDSs can detect new attacks, several anomalybased IDSs have addressed the high false positive rate while improving detection.
Numerous anomaly-based IDSs have been proposed and developed. NIDES [3], one of the first anomalybased IDSs, models network behavior using source and destination IP addresses as well as the TCP/UDP port numbers to detect statistically deviant packets as abnormal attacks. Another early system, NETAD [4], analyzes the first 48 bytes of IP packets and constructs models for the most common types of network protocols to detect anomalies specific to the packets’ protocol. Mahoney et al. [5] developed a two tiered IDS formed by the parts PHAD and ALAD [5]. PHAD creates a model using the packet headers from each packet, and ALAD analyzes the TCP connections to detect anomalies. Using the two system approach, Mahoney et al. [5] developed a twofold Intrusion Detection System able to detect individual and sets of anomalous packets. Two recently proposed IDSs, PAYL and McPAD employ n-gram features to represent network packets.
PAYL [6,7] creates a histogram model based on 1- gram features from the ASCII characters in the packet’s payload. As new packets come in, PAYL generates a histogram based on the each packet’s payload and compares the incoming histogram with the model using the Mahalanobis distance. Although PAYL achieves a high level of accuracy detecting abnormal packets, it suffers from a high false positive rate and low detection rate of polymorphic attacks. To improve these results, Roberto Perdisci et al. [8] developed McPAD, an IDS which utilizes multiple one-class support vector machines to accurately classify packets. In the McPAD [1,8] study, Perdisci represented network packets through 2-gram features as well as 2ν-gram where ν is the space between two characters in the packet used to capture structural information within the payload. With 2ν-gram features, McPAD detects the polymorphic attacks while keeping the false positive rate minimal. Despite the high detection rates of PAYL and McPAD, they cannot treat the dynamic nature of network packets.
A changing flow of network traffic can be viewed as a stream of packets. Therefore, stream mining algorithms can naturally be applied to anomaly-based intrusion detection [9]. Because data streams are very different from traditional batch data, data stream mining algorithms must resolve numerous challenges. These algorithms must process a large (sometimes infinite) number of data points in an online fashion with one pass. As a result of the restrictions on processing time, memory usage and the need for making use of the most recent data points, stream mining algorithms tend to perform worse than batch algorithms [9].
In 2011 we created two anomaly-based IDSs based on stream mining algorithms, and tested the IDSs on network packets represented by 2-gram features [10]. The first IDS used a modification of the density-based stream clustering algorithm DenStream [11]. This IDS preformed moderately well given its simple concept and small number of parameters. The second was a streaming histogram IDS based on the approach of PAYL. The histogram IDS performed better than the DenStream IDS but required more parameters to tune. After testing the IDSs with network packets represented by 2-gram features, we tested 1-gram features as a comparison. Even though the IDSs using the 1-grams did not achieve the detection rates of the 2-gram tested IDSs, they took much less time to process the data. This study planned to extend and improve the detection and false positive rates of the previous stream IDSs with StreamPreDeCon, a modified subspace clustering algorithm for an evolving data stream.
2. Materials and Methods
2.1. Data
Two publically available datasets were combined to provide testing data for our proposed IDS. The first was the DARPA ’99 intrusion detection evaluation dataset (http://www.ll.mit.edu/mission/ communications/ist/corpora/ideval/data/1999data.html) and the second was provided by the creators of McPAD [1]. The DARPA data was used in this study as an example of normal traffic and was extracted from the HTTP requests in the first week of the dataset. The payload information was retrieved using Jpcap (http://netresearch.ics.uci.edu/kfujii/ Jpcap/doc/) and the payload characters were converted to their corresponding ACSII numbers if the packet length was above 1400 characters. This preprocessing resulted in 5594 packets of normal traffic grouped by day. The number of times each ASCII character occurs was counted to generate 256 1-gram features. These features were selected instead of the 2-gram features as they provide a compact representation of network packets.
The anomaly detection algorithm proposed in this study was tested with packets of three attack types. To simulate attacks to a network, 66 different types of Generic HTTP attacks were included in our study. These HTTP attacks included threats caused by standard attacks like buffer overflow, URL decoding error and input validation error. Shellcode attacks were also included as they are a special type of packet where the payload contains executable code. CLET attacks attempt to hide from the detection algorithm by polymorphically enciphering the payload of the packet to appear normal. These attacks were also extracted from the packet’s payload using Jpcap and inserted into the normal packet stream. On each day of the DARPA dataset, the first 20% of the packets were set aside for a parameter-tuning phase, and the remaining 80% for a full-scale anomaly detection testing phase.
2.2. Methods
PAYL and McPAD perform well in a static network environment, but are not designed to consider the dynamic nature of real network traffic. To remedy this, we explore the use of the modified density based clustering algorithm PreDeCon [12]. PreDeCon is inspired by a wellknown algorithm DBSCAN [13] and its generalization OPTICS [14]. DBSCAN stands for Density Based Spatial Clustering of Applications with Noise and uses two simple parameters to cluster dense points together [13]. The first of these is , which defines the radius of a neighborhood of a point, termed
  -neighborhood. When the
  -neighborhood of a point is calculated, DBSCAN clusters the points together if the number of points in the
  -neighborhood is larger than the second user-specified parameter minPts. Because DBSCAN is a fairly simple and effective algorithm, it is the basis for several density based clustering algorithms such as OPTICS [14]. Instead of assigning points to particular clusters, OPTICS orders the points in the way that the DBSCAN algorithm would cluster the points if an infinite number of epsilon values exist.
DBSCAN and OPTICS are proven to efficiently cluster dense points together; however, the accuracy of the clustering models decreases with high-dimensional data. To extend the effectiveness of DBSCAN and OPTICS to high dimensional datasets, the notion of a preference subspace is introduced in the clustering algorithm PreDeCon [12]. The preference subspace is formally defined as the subset of features for a point in Euclidean space that exhibit a low user-specified variance when compared with its other features.
2.2.1. PreDeCon
PreDeCon uses the preference subspace concept to compute the  -neighborhood of a point to cluster points together. The preference subspace is defined as a vector computed using the variance along a feature of a point to a given
  -neighborhood. The variance of an
  -neighborhood is calculated using the following formula:
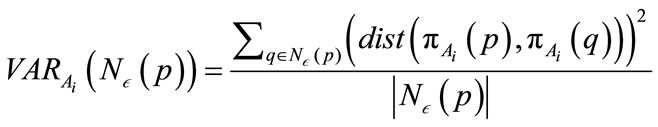 , (1)
, (1)
where p and q are points, 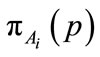 is the
  feature of
 , and
, and  is the
  -neighborhood of p or all points r where
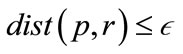 . The preference vector is then calculated by defining the subspace preference vector as
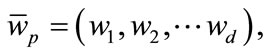 (2)
(2)
 (3)
(3)
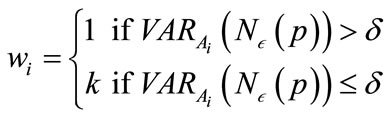
where . Using the subspace preference vector, a preference weighted similarity measure associated with a point p is defined as
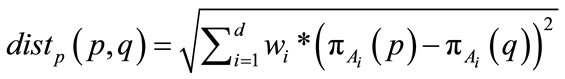 (4)
(4)
A preference weighted  -neighborhood
 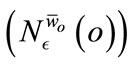 can then be formed using this weighted distance function. The
  -neighborhood is formally defined as:
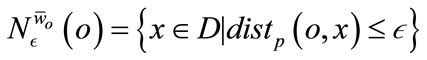 (5)
(5)
Using , a preference weighted core point is defined as a point whose preference dimensionality of its
  -neighborhood is at most a user defined parameter λ and the
  -neighborhood contains at least µ minimum points. If a point is a preference weighted core point, the
  -neighborhood of the point is inserted into a queue. PreDeCon then iterates through the queue and checks to see if the points in the
  -neighborhood can reach different points in the data set using the preference weighted subspace. A point q is reachable by a point p if q is a core point and is within the preference weighted
  -neighborhood of p. If a point is reachable but unclassified, the point is added to the queue. Using these definitions, PreDeCon then creates the clusters using the ExpandCluster method described in Figure 1.
2.2.2. PreDeConInc
The incremental version of PreDeCon attempts to update the clustering model built by the original algorithm as new data comes in through an added update step [15]. This update step simply checks to see if the new point causes a core point to change its preference vector or to become a non-core point and vice versa. Once an affected point (one of the points that has changed) from the insert is found, all reachable points are found using the new preference weighted subspace and updated with the new subspace preference vector. This approach minimizes the number of distance queries between two points because the extra steps to find the reachable neighbors of a point x are not executed unless the new point affects x. Although the incremental version of PreDeCon allows
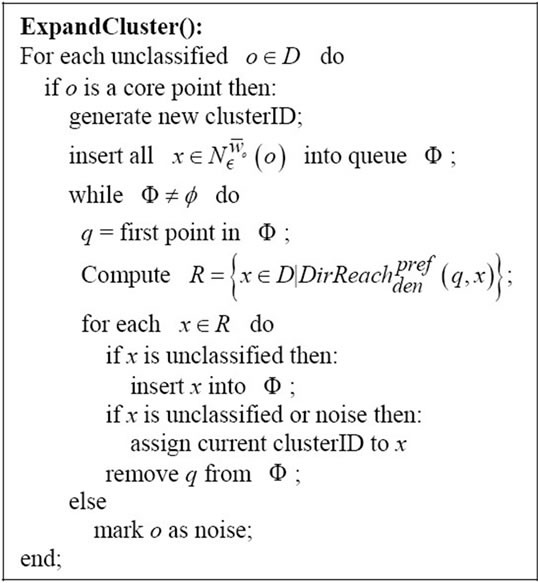
Figure 1. Expand cluster method to create preference weighted subspace clusters.
the clustering model to update itself as new points arrive into the system, this algorithm needs to be modified to handle streaming data.
2.2.3. StreamPreDeCon
Here we propose a new algorithm StreamPreDeCon, which applies the preference weighted subspace clustering techniques of PreDeConInc to the stream setting. To accomplish this, we apply a decay factor to the Euclidean Distance and the Preference Weighted Similarity Measure so that the algorithm can capture the concept shifting and drifting nature of a data stream. Due to the potentially large volume of data in a data stream, a weighted distance deletion method of noise points is implemented to maintain an effective model of constant size.
The large amount of data that needs to be processed as well as the possibility for data evolution warrants a decay factor be applied to the distances between points. This allows for recently arrived points to have greater influence on the clustering. The decay factor was generated using the function:
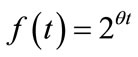 , (6)
, (6)
where  is a predefined constant greater than 0 and t is the difference in the timestamp between the current point and the point already in the model. After the decay factor is determined, the distance between the points is calculated with the weighted distance function multiplied by the decay factor through the formula:
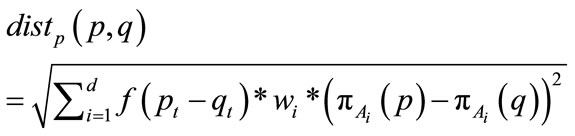 (7)
(7)
where  is the timestamp of a point
 . This multiplication causes older points to seem further away from newer points. The decay factor is also applied to the preference vector calculation by modulating the variance depending on the timestamp.
In order to process the large amount of stream data while keeping only the recent information in our model, PreDeConInc needs to be modified further to allow deletion of old points in the model. This is done by adding a new step immediately after the new point arrives. During this step, StreamPreDeCon checks the decayed distance between the new point and the model of core points. If this distance is above a certain threshold parameter  and the point is currently a noise point, it is deleted. This step not only reduces the size and maintains recent information stored in the model, but also improves clustering efficiency and accuracy by removing old points that are very far from the clusters in the data stream. Core points are also eligible for future deletion because they are not guaranteed to remain core points in the future. By implementing the deletion step in Figure 2, the model
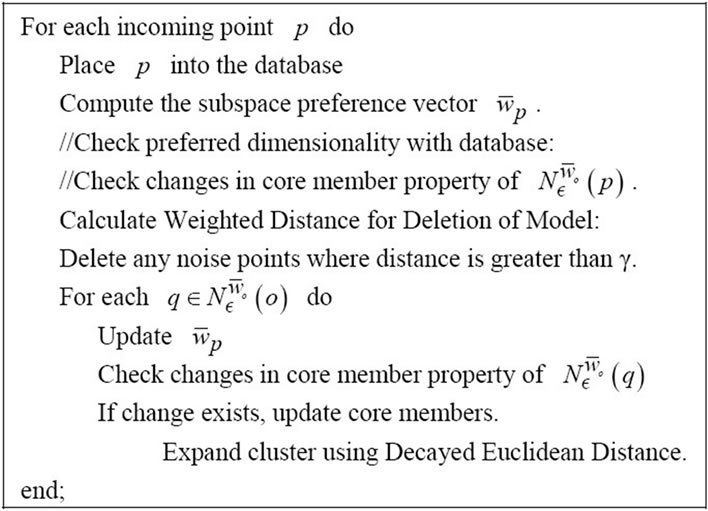
Figure 2. StreamPreDeCon algorithm for anomalous packet detection.
remains current within the stream of data.
The clustering models generated by StreamPreDeCon can be used to classify data points in the stream. When a new point arrives, StreamPreDeCon calculates the preference vector for the new point and checks where the new point is clustered. After the point has been clustered or marked as noise, StreamPreDeCon classifies the point as a core or non-core point. Since a point can either be classified as a core or non-core point, this approach lends itself well to binary classification problems such as the detection of abnormal packet within a network stream. To apply StreamPreDeCon, we consider packets classified as core points normal and noise points as abnormal.
The classification of network packets is evaluated through the performance metrics of sensitivity and false positive rate. Sensitivity measures the detection rate of abnormal packets and the false positive rate measures the number of false-alarms. These are defined as:
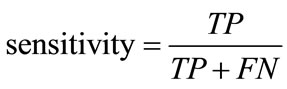 , (8)
, (8)
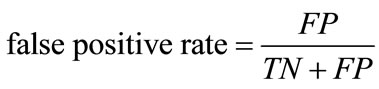 , (9)
, (9)
where TP is the number of correctly classified abnormal packets, FP is the number of incorrectly classified normal packets, TN is the correctly classified normal packets, and FN is the number of incorrectly classified abnormal packets.
3. Results and Discussion
In this section, we describe the setup of our evaluation tests for the StreamPreDeCon IDS. After the appropriate values of parameters were determined through a parameter-tuning phase, the performance of the StreamPreDeCon IDS was tested with the remaining 80% data. This new IDS performed well in all but one day. To gain understanding of this anomaly, we analyzed both the packets themselves and the algorithm’s output at each step.
An initial setup of the StreamPreDeCon algorithm was required due to the number of parameters used. To find which parameters have the highest influence on the clustering, each virus type for a particular day was run. Because  was found to have the greatest effect on the outcome of the algorithm, we fixed the remaining parameters to values that gave us a good initial clustering model. The values of the parameters used for both the tuning and the testing phases are displayed in Table 1.
Once the initial values of the parameters were identified, we tuned the  parameter to get a basic idea of
  values we should try in the full-scale test. Using the 20% data set, we began with
  and increased this value if we desired a lower false positive rate, and lowered it if we wanted a better detection rate. By using the small 20% data set, we quickly found a range of parameter values ideal to start the full scale tests on the 80% of data.
Keeping the same parameter values from the parameter-tuning phase, we began testing different values for . The effect
  has on the classification is demonstrated in Figure 3. As
  is increases, the detection rate and the false positive rate both decrease. In other words, to maintain a low false positive rate at the expense of a lower detection rate, a higher
  must be selected. For the Monday data, when
  is less than 480, the sensitivity is greater than 94% for all attack types, but the false positive rate is above 40%. Then when
  is greater than 680, the false positive rates and the sensitivity decrease to less than 10% and 54% respectively. This trend is further observed for greater
  values, the false positive and detection rates both continue to decrease. We also noticed slight differences in the detection rates of the different virus types in this preliminary tuning phase. The CLET attacks generally had lower detection rates but higher false positive rates in comparison with the other two attack types. This means that the overall range of
  values would most likely be much smaller than those for
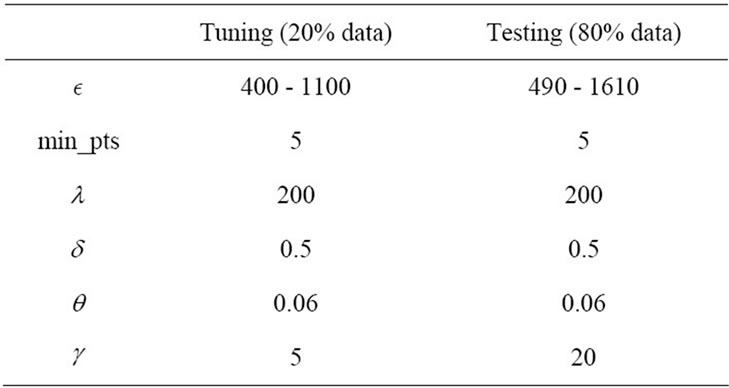
Table 1. Parameter values used for streamPreDeCon parameter-tuning and testing phases.
Generic Http and Shellcode attacks. Also, the Shellcode attacks exhibited a near perfect detection rate while the false positive rate was below 10%. This gave us some room to work as we could get the false positive rate below 1% with a higher  value. Because of the larger number of packets, the
  ranges needed to be altered slightly as the amount of variation between packets increases with the number of packets. Also to keep the algorithm running efficiently, we multiplied the gamma parameter by a factor of four to reflect the number of packets in the 80% test data.
After performing multiple experiments on a set of  values, we displayed three test runs for each virus type and day. We selected the test that demonstrated the highest detection rate while keeping the false positive rate below 10%, a run where the lowest false positive rate occurred while keeping the detection rate above 60% and a
  in between the highest and lowest. The sensitivity and false positive rates are displayed in Table 2.
As demonstrated by Table 2, the StreamPreDeCon based IDS is an improvement over previous stream anomaly-based IDSs. For all days except for Thursday, the StreamPreDeCon clustering algorithm achieved the highest detection rates with the least false positive rates for the Shell-code attacks averaging 94 percent with the
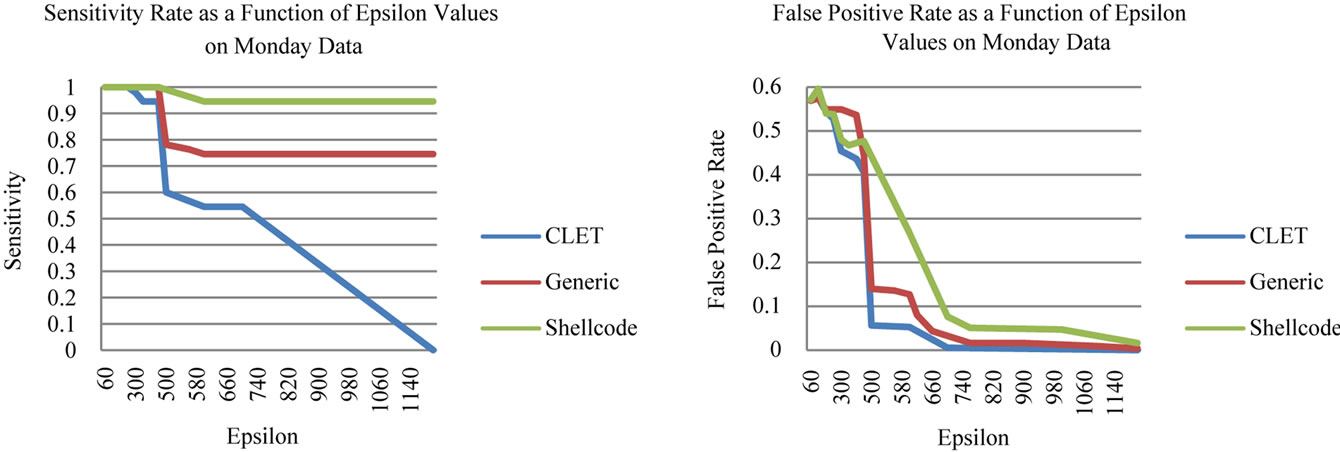
Figure 3. Anomalous packet detection sensitivity and false positive rates of the StreamPreDeCon IDS.
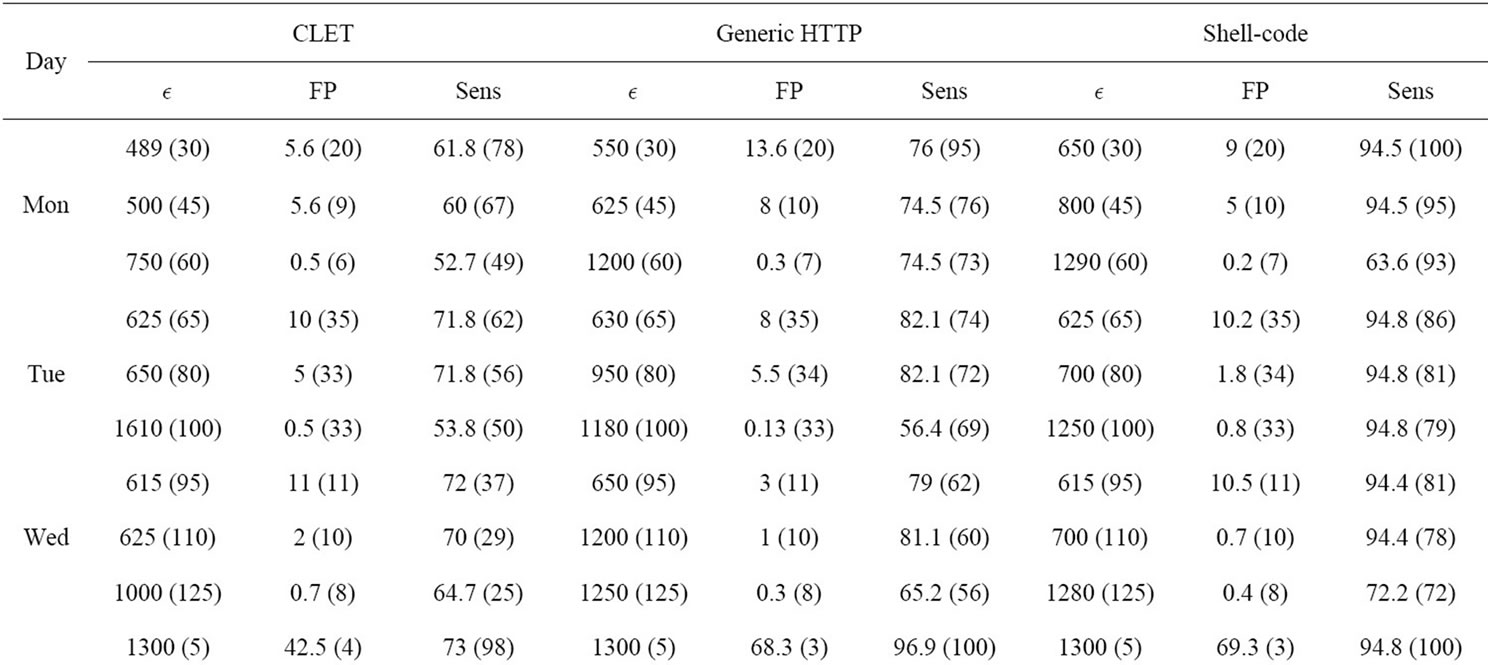
Table 2. StreamPreDeCon ID detection results of anomalous packets within the 80 testing data.
smallest  values. StreamPreDeCon also achieved moderate results for the Generic HTTP and CLET attacks.
Because the CLET attacks are meant to fool the anomaly-based IDS through polymorphic techniques, these attacks cause the lowest acceptable detection rates. Despite the slightly poor detection of CLET attacks, the StreamPreDeCon IDS on average had mostly higher sensitivity values with substantially lower false positive rates than the results of [10].
The poor results for the Thursday data are attributed to the data itself. Within the initial 200 normal packets, there is a large amount of variation between packets in the same  -neighborhood. This causes StreamPreDeCon to create an inaccurate initial clustering model as its preferred subspace dimensionality is larger than 200. In fact, for StreamPreDeCon to initially cluster the packets, all 265 features are needed compared to the other days needing fewer than 200. Also, after a certain packets, every single normal packet is the same. This causes normal packets to be classified as abnormal once an abnormal packet is classified as normal. Because of this, both the sensitivity and false positive rates for Thursday data are very close for all parameter values tested.
To further analyze the data, we counted the occurrence of each ASCII character in each normal and abnormal packet and then normalized frequency counts and grouped them by day and attack type. In Figure 4, we display the histogram generated for Monday since all the days except Thursday shared a similar distribution pattern. We also generated separate histograms for each attack type to view their differences.
There is a clear difference between the typical normal packets and the Thursday normal packets (Figure 4). In general, the normal packets have a high normalized occurrence of the ACSII code 0 and low normalized counts for the rest. In particular the normal packets for Thursday
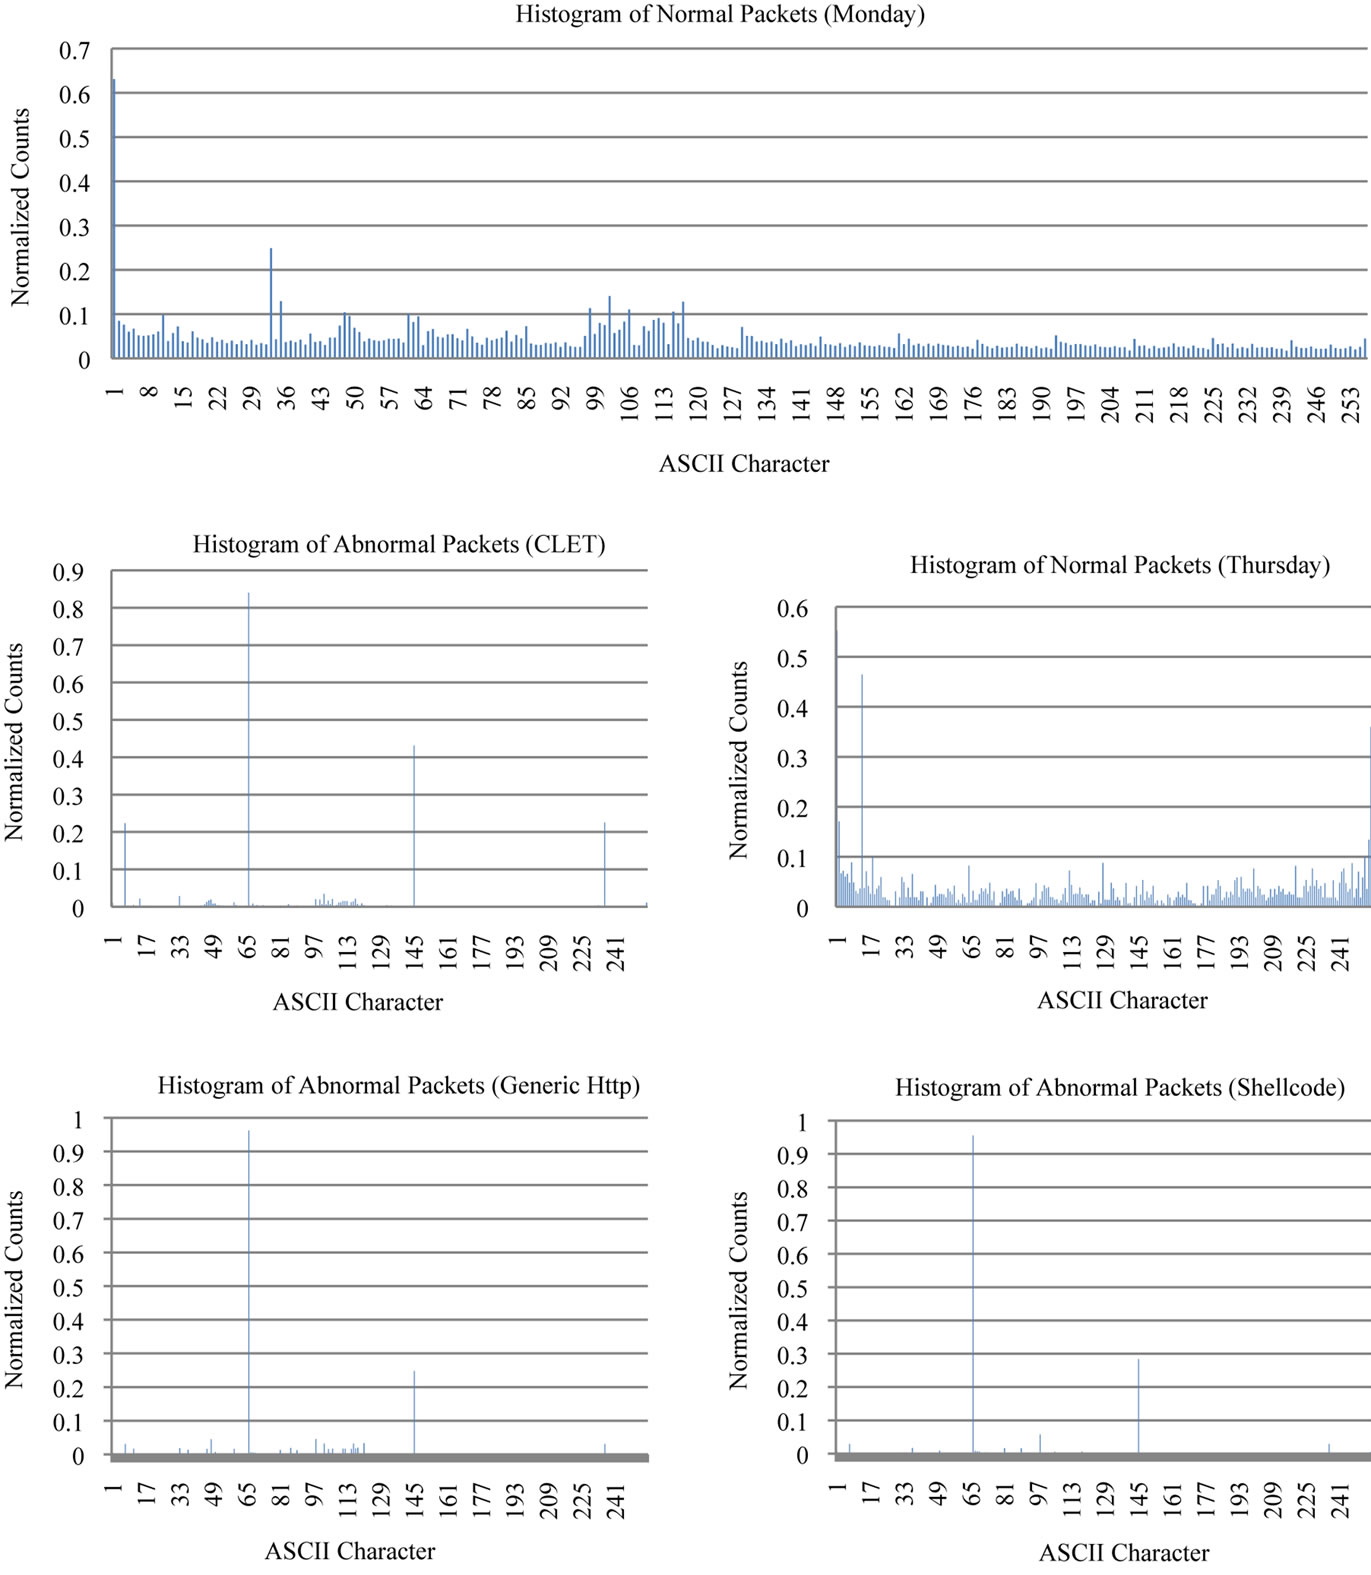
Figure 4. Assorted histograms generated using byte frequency distribution.
do not have the high occurrence of ASCII code 0 which might have caused the poor performance rates on those tests. The abnormal packets each have unique signatures in comparison to normal packets which offer the basis for anomaly detection. Each of the three attack types has peaks at positions 66 and 145. CLET has two more peaks at position 7 and 236 which might help these attacks blend in with normal traffic. Because StreamPreDeCon monitors the stream one packet at a time, there could be packets appear to be normal. This would explain the high detection rates in certain attack types on particular days. The histograms illustrate the different distribution patterns of the average packet payload.
4. Conclusions
This study aimed to create an anomaly-based IDS based on StreamPreDeCon. In general, anomaly-based IDSs are characterized by being able to detect new attacks but suffer from a high false-positive rate and difficulty detecting polymorphic attacks. The preference subspace clustering algorithm offers a unique method to analyze how particular subspaces interact which could maximize the detection of polymorphic attacks while maintaining a low false positive rate. In order for the PreDeCon algorithm to handle data changes within the network packet stream, we modified PreDeCon by adding a decayed distance measurement along with a deletion scheme and binary classification technique, which allow the IDS to detect anomalous packets. The addition of a decay factor give the most recent points in the model a greater influence on the clustering of the incoming points. The deletion step keeps the model current and manageable by deleting old noise points that have no effect on the clustering.
Tested on a dataset comprised of normal packets from the first week of the DARPA ’99 intrusion detection evaluation dataset and various types of malicious traffic from [1], the IDS based on StreamPreDeCon out-performed previous stream-based IDS [10] using the same dataset in all days except for one day. For these days, the anomalous packet detection of the StreamPreDeCon IDS improved the sensitivity rate of the DenStream based IDS from 30% - 90% to 60% - 94% and reduced the false positive rates from a high of 20% to between 1% and 10%.
Although our proposed IDS achieved better results when compared with other IDSs of the same type, there is still room for improvement. First StreamPreDeCon needs to be more efficient. This could be implemented with the help of micro-clusters utilized by other stream clustering algorithms such as DenStream [11]. Microclusters will allow the Intrusion Detection System to store a compact representation of a set of points and thus reduce the number of distance calculations. Second, a smarter classification technique could be developed to better differentiate the normal core points from abnormal core points to increase the detection rate and decrease the number of false positives. These two adjustments will potentially help both the efficiency and effectiveness of the StreamPreDeCon IDS.
5. Acknowledgements
We thank Houghton College for its financial support and William Deitrick for his help with data preprocessing and editing of this manuscript. We also thank Dr. Ntoutsi for sharing the code of PreDeConInc.
REFERENCES
- R. Perdisci, G. Gu and W. Lee, “Using an Ensemble of One-Class SVM Classifiers to Harden Payload-Based Anomaly Detection Systems,” Proceedings of the Sixth International Conference on Data Mining, Hong Kong, 18-22 December 2006, pp. 488-498. doi:10.1109/ICDM.2006.165
- R. Perdisci, “Statistical Pattern Recognition Techniques for Intrusion Detection in Computer Networks, Challenges and Solutions,” Ph.D. Thesis, University of Cagliari, Italy, 2006.
- D. Anderson, T. Lunt, H. Javits and A. Tamaru, “Nides: Detecting Unusual Program Behavior Using the Statistical Component of the Next Generation Intrusion Detection Expert System,” Technical Report SRI-CSL-95-06, Computer Science Laboratory, SRI International, Menlo Park, 1995.
- M. Mahoney, “Network Traffic Anomaly Detection Based on Packet Bytes,” ACM-SAC, Melbourne, 2003, pp. 346- 350.
- M. Mahoney and P. Chan, “Learning Non Stationary Models of Normal Network Traffic for Detecting Novel Attacks,” ACM SIGKDD International Conference on Knowledge Discovery and Data Mining, Edmonton, July 2002, pp. 376-385.
- K. Wang and S. Stolfo, “Anomalous Payload-Based Network Intrusion Detection,” Recent Advances in Intrusion Detection, Vol. 3224, 2004, pp. 203-222. doi:10.1007/978-3-540-30143-1_11
- K. Wang, “Network Payload-Based Anomaly Detection and Content-Based Alert Correlation,” Ph.D. Thesis, Columbia University, New York, 2006.
- R. Perdisci, D. Ariu, P. Fogla, G. Giacinto and W. Lee, “McPAD: A Multiple Classifier System for Accurate Payload-Based Anomaly Detection,” Computer Networks, Special Issue on Traffic Classification and Its Applications to Modern Networks, Vol. 5, No. 6, 2009, pp. 864- 881.
- J. Gama, “Knowledge Discovery from Data Streams,” CRC Press, Boca Raton, pp. 7-9.
- Z. Miller, W. Dietrick and W. Hu, “Anomalous Network Packet Detection Using Data Stream Mining,” Journal of Information Security, Vol. 2, No. 4, 2011, pp. 158-168. doi:10.4236/jis.2011.24016
- F. Cao, M. Ester, W. Quan and A. Zhou, “Density-Based Clustering over an Evolving Data Stream with Noise,” 2006 SIAM Conference on Data Mining, Bethesda, 20-22 April 2006.
- C. Bohm, K. Kailing, H. Kriegel and P. Kroger, “Density Connected Clustering with Local Subspace Preferences,” Proceedings of the Fourth IEEE International Conference on Data Mining, Brighton, 1-4 November 2004, pp. 27-34.
- M. Ester, H. Kriegel, J. Sander and X. Xu, “A DensityBased Algorithm for Discovering Clusters in Large Spatial Databases with Noise,” International Conference on Knowledge Discovery in Databases and Data Mining (KDD-96), Portland, August 1996, pp. 226-231.
- M. Ankerst, M. Breunig, H. Kriegel and J. Sander, “OPTICS: Ordering Points to Identify the Clustering Structure,” SIGMOD, Philadelphia, 1999, pp. 49-60.
- H. Kriegel, P. Kroger, I. Ntoutsi and A. Zimek, “Towards Subspace Clustering on Dynamic Data: An Incremental Version of PreDeCon,” Proceedings of First International Workshop on Novel Data Stream Pattern Mining Techniques, Washington DC, 2010, pp. 31-38. doi:10.1145/1833280.1833285