Materials Sciences and Applications
Vol.3 No.3(2012), Article ID:18060,5 pages DOI:10.4236/msa.2012.33026
Dielectric Spectroscopy of PVAc at Different Isobaric-Isothermal Paths
![]()
Department of Physics, University of Sistan and Baluchestan, Zahedan, Iran.
Email: soheil.sharifi@gmail.com, sharifi@df.unipi.it
Received December 30th, 2011; revised January 29th, 2012; accepted February 29th, 2012
Keywords: Dielectric Relaxation; Nan-Size Motion; Pressure and Temperature
ABSTRACT
We studied broadband dielectric spectroscopy of a glass from systems that the dynamics of the primary aand the Johari-Goldstein (JG) b-processes are strongly correlated in Poly(vinyl acetate) over a wide temperature T and pressure P range. Analysing the temperature and pressure behaviour of the aand (Non-JG) b-processes, a correlation hasnot been found between the structural relaxation time, the (Non-JG) b-processes relaxation time and the dispersion of the structural relaxation. These results support the idea that the (JG)-processes relaxation acts as a precursor of the structural relaxation and therefore of the glass transition phenomenon but it isnot clear relation in the (Non-JG) bprocesses and structural relaxation at PVAc .
1. Introduction
Usually in the Glass former materials we can find complex relaxation pattern, which evolves over several time decades. A technique that it is useful for study the dynamic of relaxation inside the liquid and glass state is Dielectric spectroscopy [1-3]. It has turned out that in such a broad dynamic range several molecular processes take place, and usually most of them are characterized by non-exponential relaxation functions. In polymeric materials the slowest of these processes is called normal mode: simplifying, if we consider a vector connecting the two ends of a polymeric chain, the normal mode reflects the motion of such vector. In non polymeric materials the slowest process is usually called main, structural or α- relaxation [2-6]. It reflects the cooperative motion of the molecules and its characteristic time can be related to the overall viscosity of the material. The origin of the structural a-relaxation is ascribed to cooperative motions that involve an increasing number of molecules and slow down dramatically when the glass transition is approached, for example either by decreasing temperature T or increasing pressure P (i.e., density) [1-3]. So, it is challenging to distinguish between intermolecular and intramolecular secondary processes also in systems with a complex molecular structure, even showing more than one secondary process.
In this work, we contribute to such discussion by investigating the relation between the structural and the secondary processes in the poly (vinyl acetate) (PVAc) in an interval of pressure ranging from 0.1 to 600 MPa and temperature from 100 to 350 K. The main goal is to find relation between alpha and secondary relaxation in PVAc and compare this system with relation of alpha and secondary relaxation in the mixture of the rigid polar molecule quinaldine (QN) and tristyrene.
2. Experiment and Materials
The complex dielectric constant ε= ε′ – iε″ was measured in the frequency range from 10–2 Hz up to 107 Hz at different isothermal and isobaric conditions using Novocontrol Alpha analyser. The temperature at atmospheric pressure was varied from 100 K and 320 K by means of a conditioned nitrogen flow cryostat. The high pressure experiment was carried out by means of an hydrostatic press and silicon oil as a pressure transmitting medium. A Teflon membrane prevented the oil to contact the dielectric cell. The temperature of the whole pressure chamber was controlled by a thermal jacket connected to a liquid circulator.
Poly (vinyl acetate) (PVAc), with M.W. = 167 Kg/mol, and Tg = 310.7 K is purchased from Aldrich. PVAc has interesting structural variations and can be obtained in the atactic, and thus amorphous form, which is crucial for investigations of the glass transition. PVAc has been often chosen to test the current aspects of various theories related with glass transition phenomena. An ample dipole moment makes PVAc a good candidate of dielectric spectroscopy [7-10].
3. Results
Dielectric loss spectra, ε(ω) = ε′ – iε″ of PVAc was measured from above to below the glass transition. We applied the different thermodynamic paths to studied the relation between the structural and the secondary relaxation close to Tg (P).
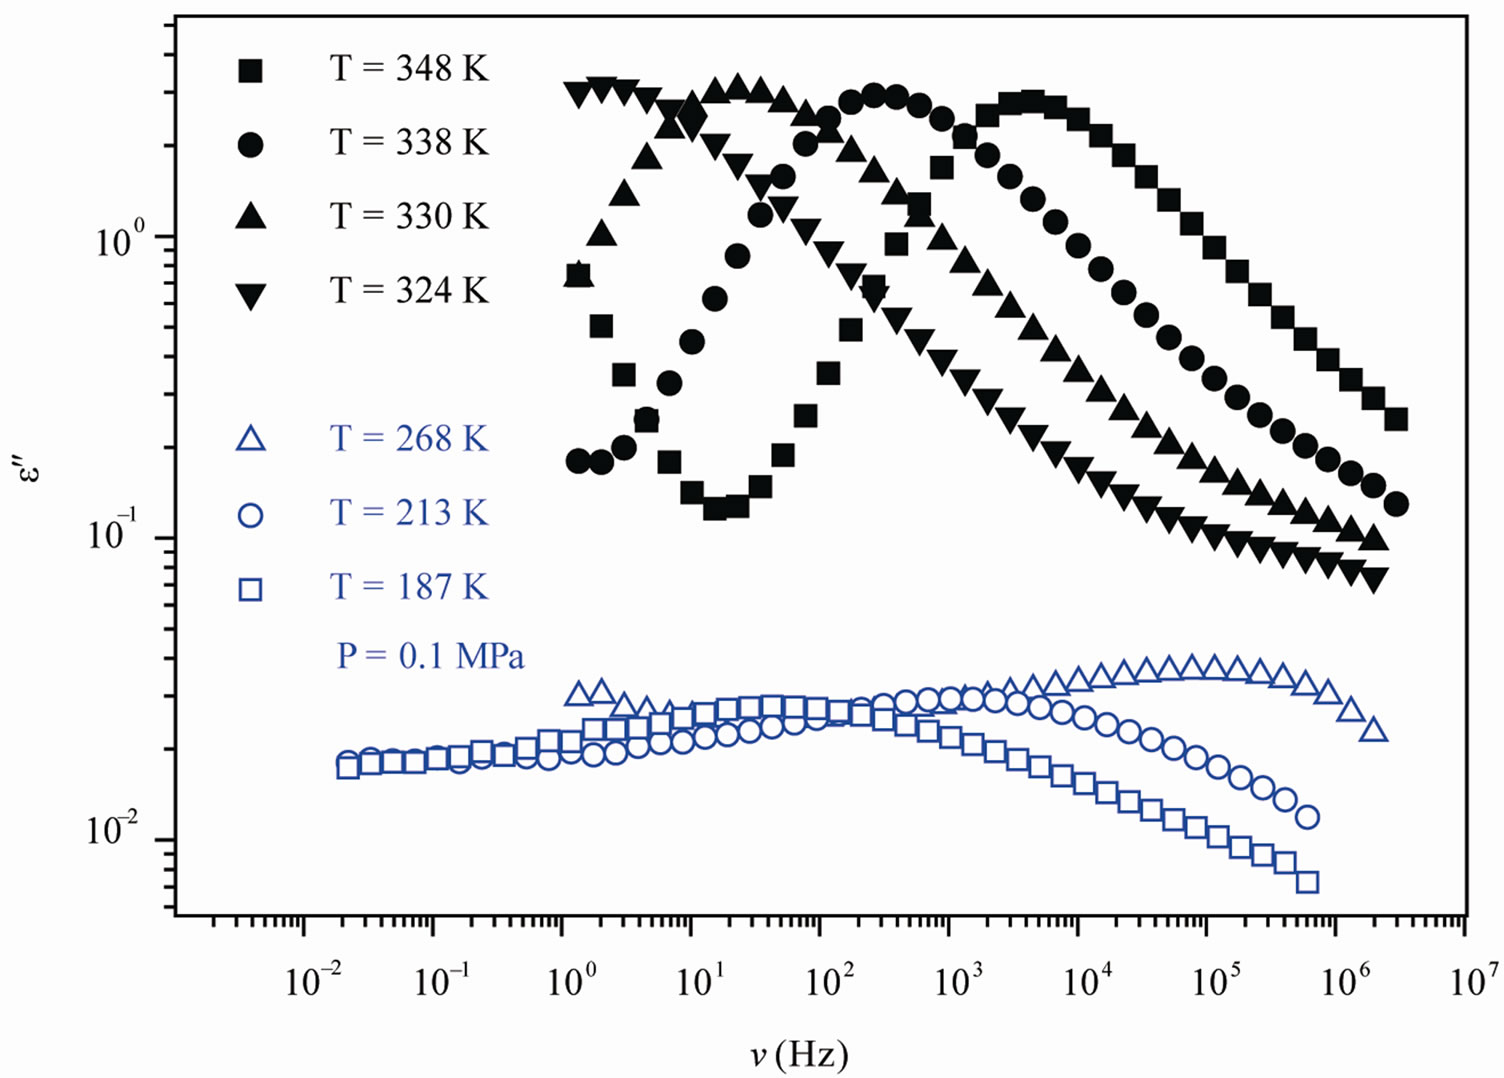
We acquired dielectric spectra along isothermal paths by varying pressure from 0.1 MPa up to the maximum value of 600 MPa, with step of 10 MPa in the supercooled liquid and step of 50 MPa in the PVAC, Figure 2. We also measured dielectric spectra by varying temperature at high pressure from 100 to 300 K in supercooled liquid and in the glass. The increase of pressure slows down the structural relaxation similarly to the decrease of temperature: the structural relaxation peak shifts to lower frequencies until the structure of the liquid is eventually arrested in a glassy state. At ambient pressure in PVAc only the α-structural process is visible above Tg, when spectra are collected in the frequency interval 10–2 - 106 Hz. At temperatures below Tg two further relaxation processes, β-, is visible in the frequency interval, Figure 1. All the observed relaxation processes move towards lower frequencies on decreasing temperature or increaseing pressure, the α-process being the most sensitive and the β- the less. The β-process occurs only at very high frequency and we can measure only at very low temperature at ambient pressure, but never at high pressure due to limitation of the temperature interval, Figure 1. In the PVAc below Tg we observe only one secondary relaxation.
Dielectric spectra were fitted with a superposition of different HN and CC functions [1-3], one for each relaxation process. Since for any value of temperature not more than two relaxation processes appear, in the fitting procedure we never used more than two relaxation functions. Moreover, the β-process was usually described by the CC function. The fitting program, based on a least square minimizing procedure, contemporary fits the real and the imaginary part of the dielectric spectrum and furnishes the values of the parameters and the corresponding errors. Table 1, report some representative values of the parameters α and β for the considered systems at different pressure and temperature.
Finally, since in all the cases, near Tg, the structural and the secondary relaxations are well separated in the frequency scale we reproduced the structural relaxation peak by the Fourier transform of the KWW function. This further analysis allowed a direct estimation of the stretching parameter characterizing the broadness of the structural peak.
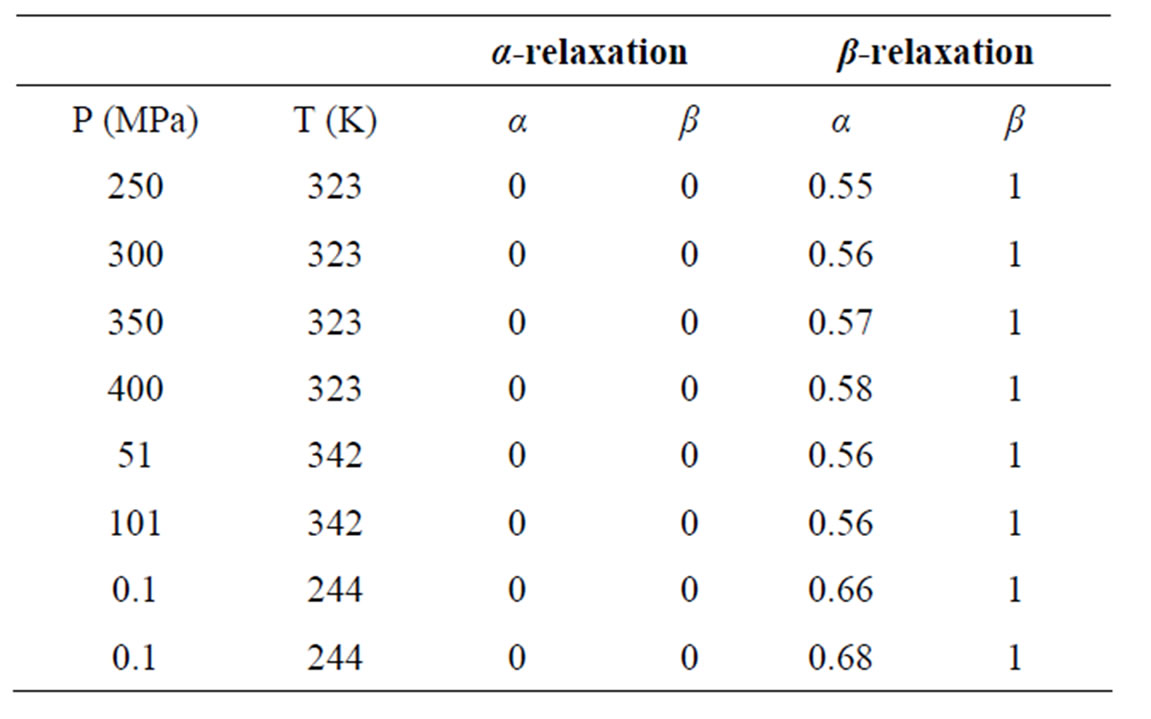
Table 1. Parameters of α-(structural), β-(secondary) relaxation at different pressure and temperature for PVAc.
As model independent parameter for the characteristic time scale of the process we considered the maxima of frequency, 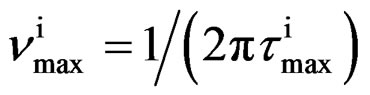 corresponding to the loss peak maximum frequency, which was calculated by
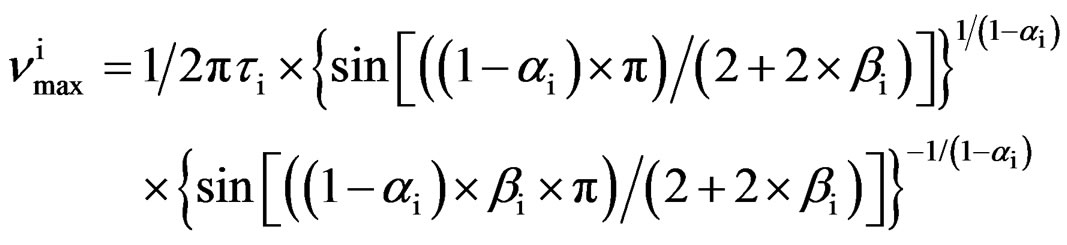 (1)
(1)
The temperature dependence of  can be well fitted by a Vogel-Fulcher-Tammann, VFT, equation,
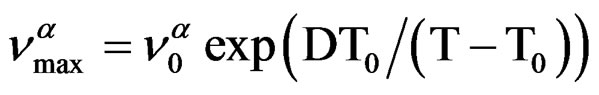 over the entire temperature interval. The pressure dependence of
  can be well fitted by a Vogel-Fulcher-Tammann like, PVFTequation,
over the entire pressure interval. In the isothermal paths, pressure dependence of  below Tg are well reproduced by the Arrhenius equation,
 (where ΔVβ is the activetion volume of the secondary β-relaxation), and in isobaric condition the temperature dependence of
  below Tg is well reproduced by the Arrhenius equation,
 . The different VFT and Arrhenius parameters for the isobaric dielectric relaxation spectra of the different are listed in Table 2.
The value of the glass transition temperature, Tg, determined by τα(Tg) = 10 s at ambient temperature is (310 K ± 2 K) for PVAc. From the Figure 2, it is clear that the position of secondary relaxation at Tg for isobaric paths, Figure 2(a), isn’t the same of isothermal path, Figure 2(b).
4. Discussion
The combined variation of both temperature and pressure allows to reach dynamic states characterized by the same value of structural relaxation time, but different thermal
 (a)
(a)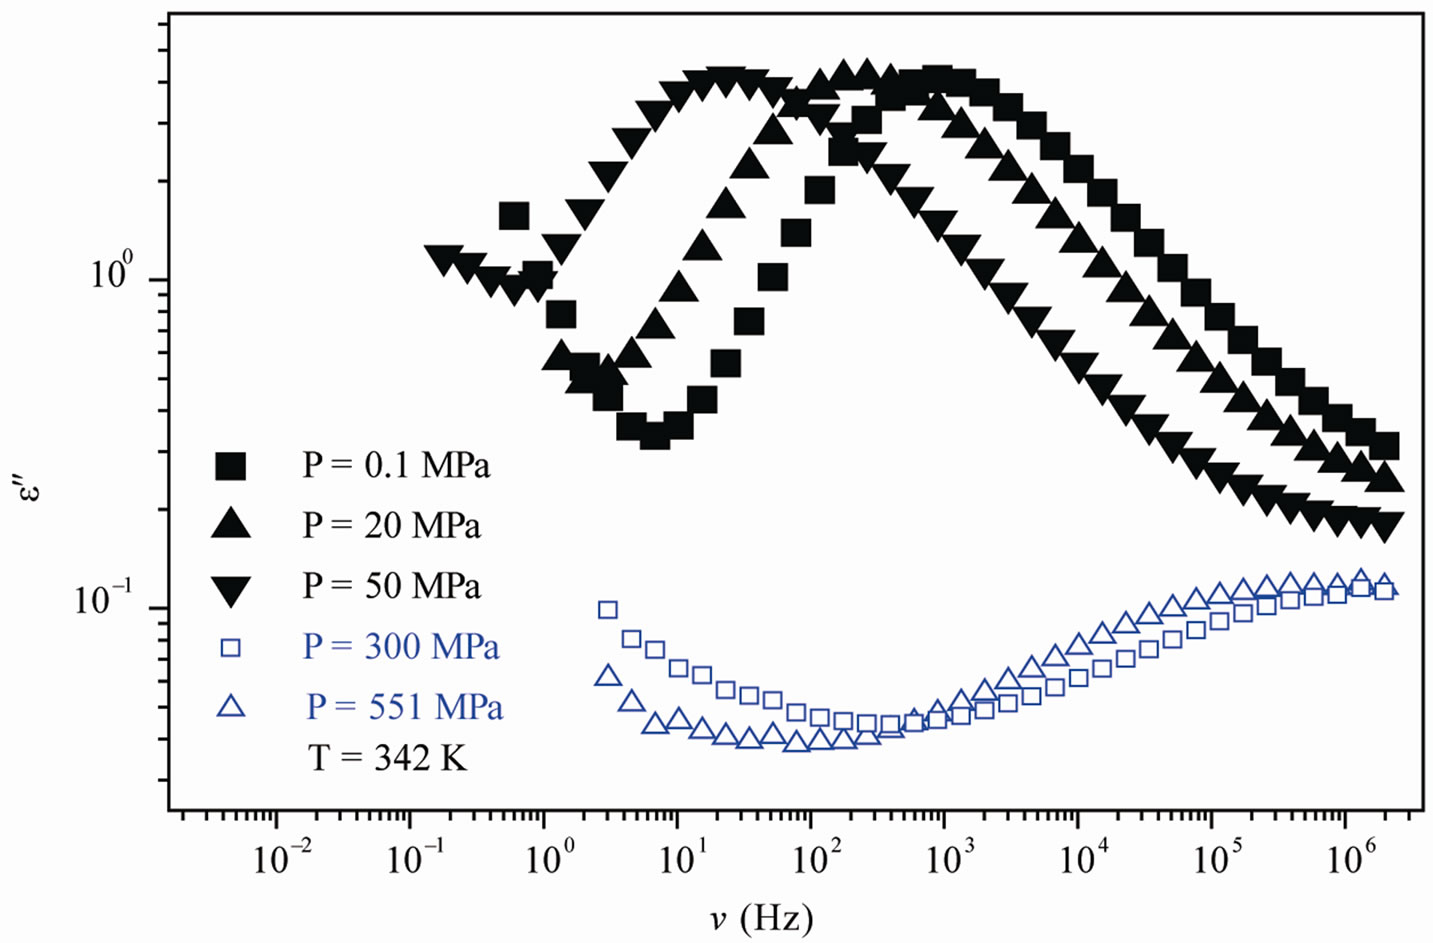 (b)
(b)
Figure 1. (a) Isobaric (0.1 MPa) dielectric loss spectra of PVAc measured at different temperatures (values reported in the figure); (b) Isothermal (342 K) dielectric loss spectra of PVAc measured at different pressure (values reported in the figure). The black spectra are measured in the supercooled liquid and are dominated by the α-peak and the blue open symbols spectra are measured in the glassy state and are dominated by the β-peak.
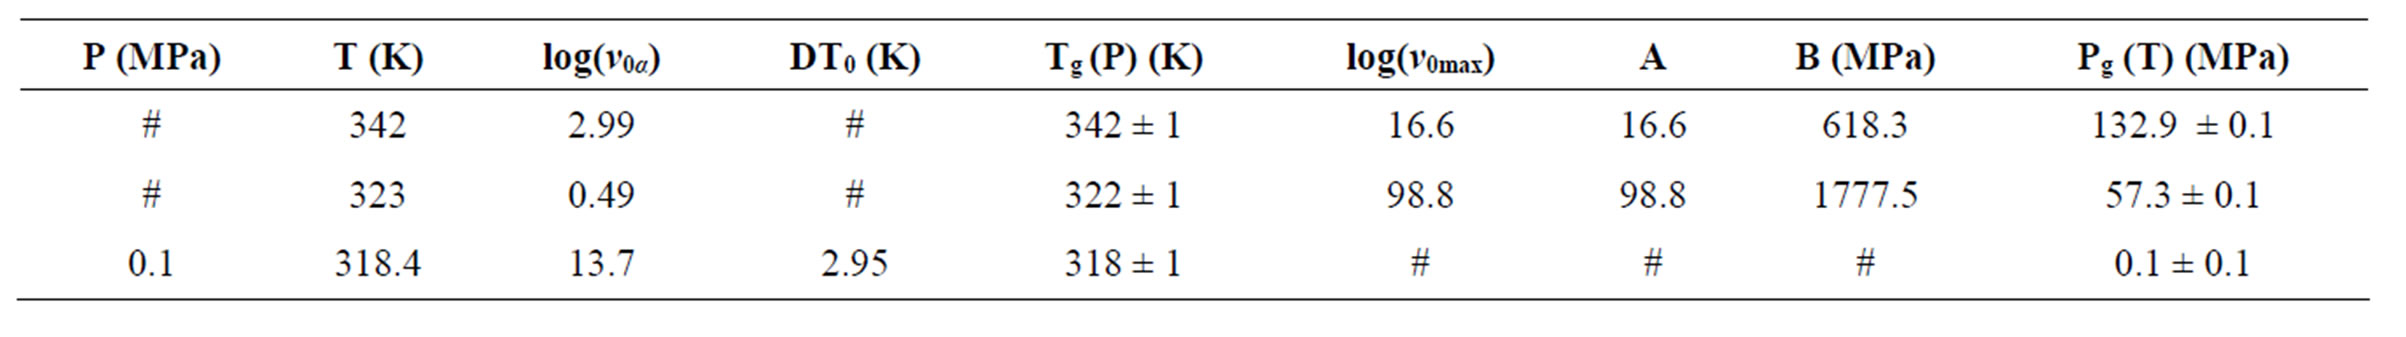
Table 2. The glass transition temperature and the relevant VFT parameter for three different systems, as determined by dielectric relaxation measurement [parameter of A and B come from the equation,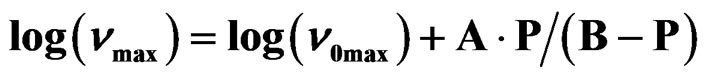 ].
].
energies and densities. The relative role of density and thermal energy on the slowing the structural relaxation on approaching the glass transition is a matter of study. Even if a similar behavior can be found for materials belonging to the same class, the detail of their relative role varies for each system [11]. From the dynamic point of view the glass transition is traditionally defined by considering the structural relaxation time being a fixed long value. In other words, at different of temperature and of pressure the ratio  isn’t con-
 (a) (b)
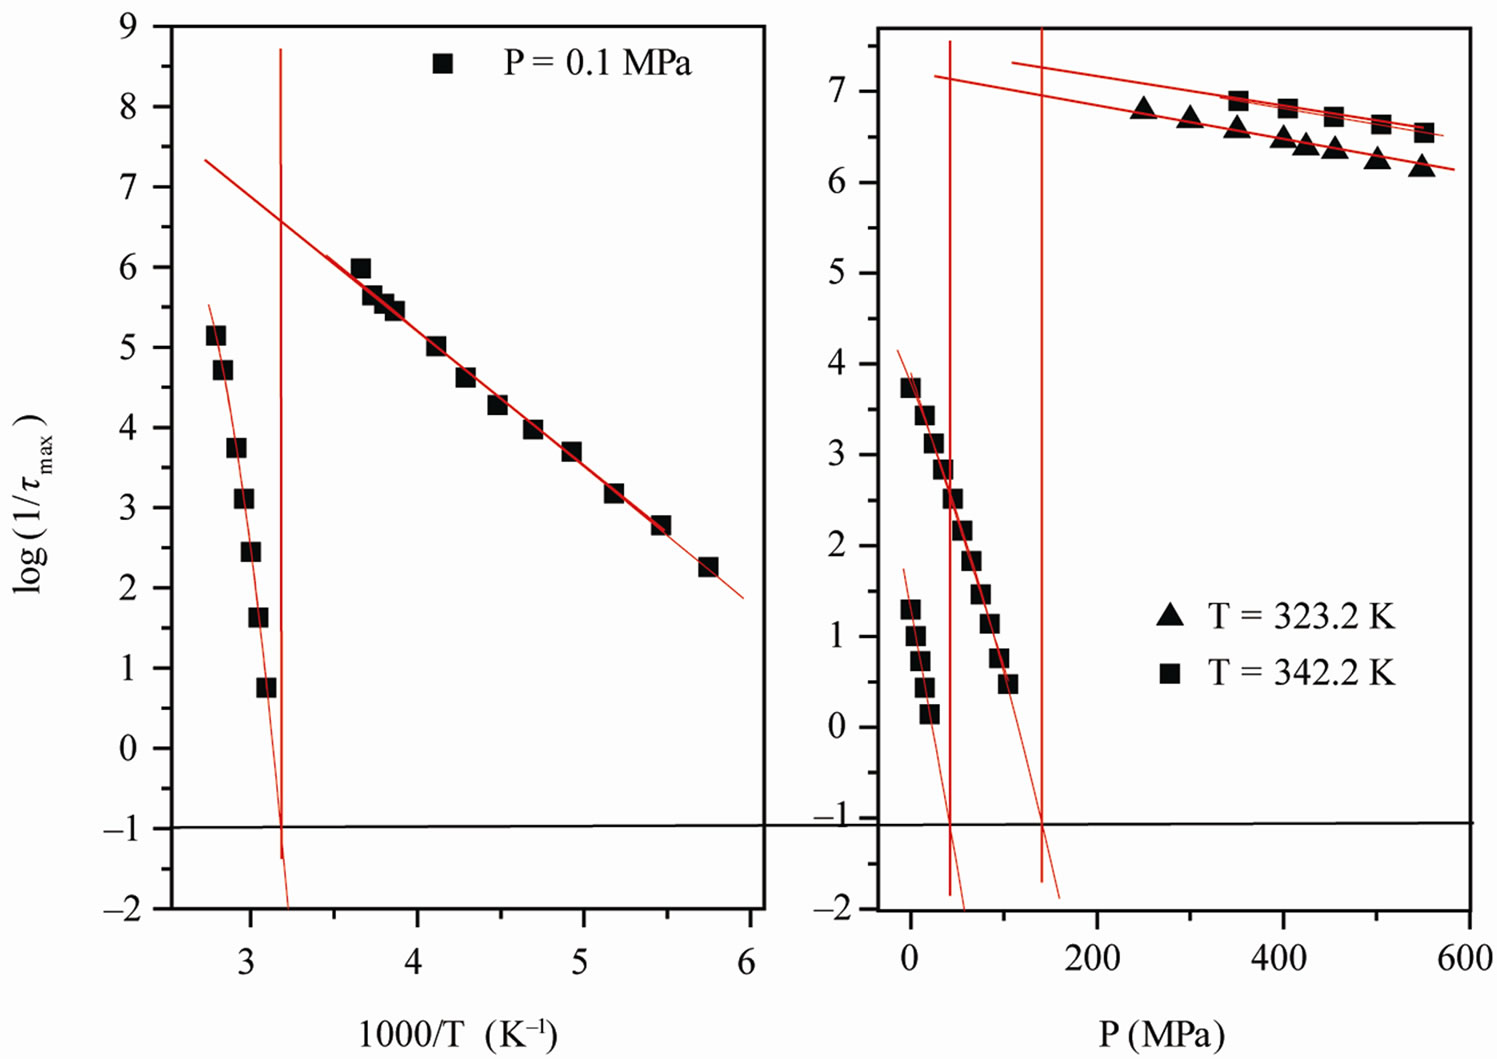
Figure 2. (a) Pressure dependence of the logarithmic of τmax for the α-(full symbols) and the β-(secondary) process, at two different values of T: 342K (squares), and 323.2 K (triangles) of PVAc (b) Temperature dependence of the logarithmic of  for the α-(full symbols) and the β-(secondary) process, at ambient pressure: 0.1 MPa (squares) of PVAc. In both panels the continuous lines represent fit with the VFT (α-relaxation) and Arrhenius (β-relaxation) equations. The horizontal dotted line show the relaxation time value used to define the glass transition. Crosses represent the values of τmax at (T, P)g.
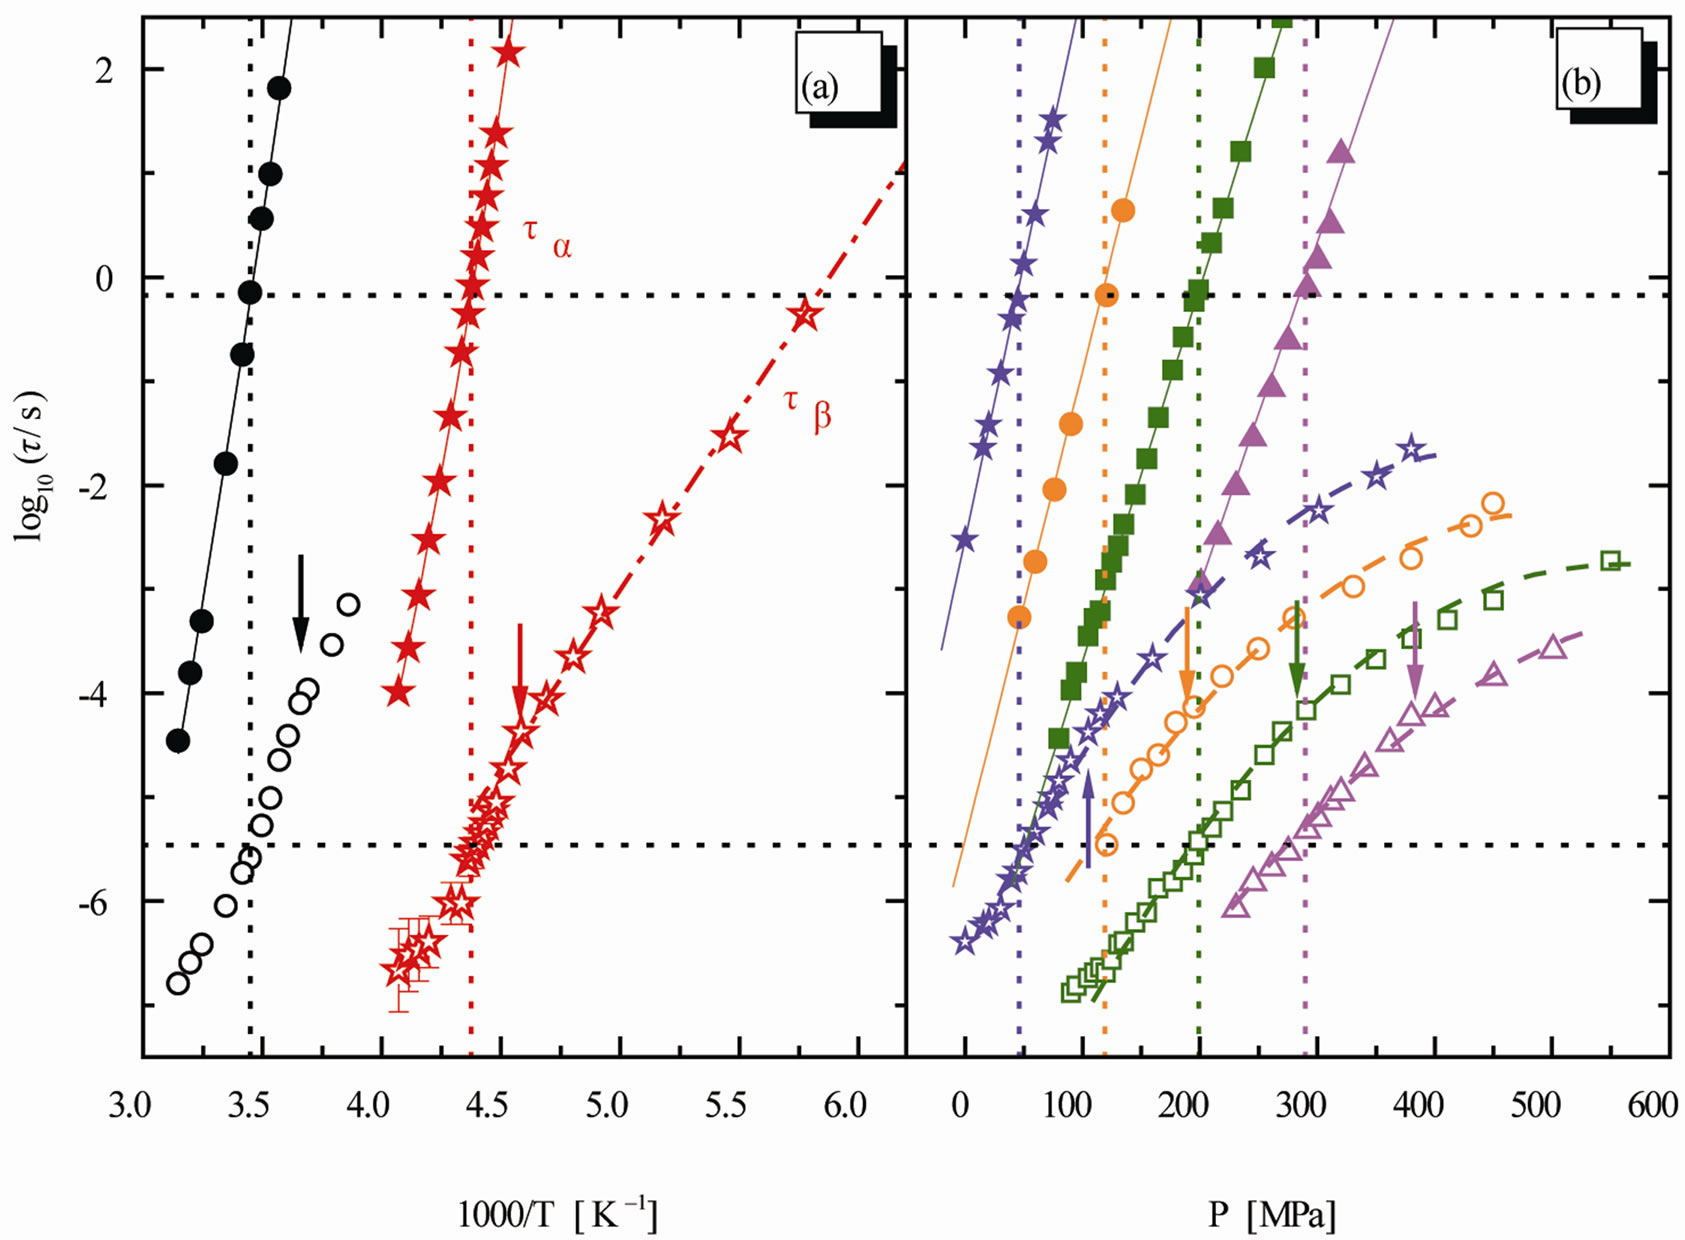
Figure 3. Relaxation map for the mixture 10% QN in tristyrene. (a) Isobaric data: 0.1 MPa (stars), 380 MPa (circles). (b) Isothermal data: 238 K (stars), 253 K (circles), 263 K (squares), 278 K (triangles). The ratio  is constant [12].
stant for PVAC for all thermodynamic paths. It is likely to suppose that the connection between α- and β-dynamoics isn’t a universal feature of all β-processes, but only of those local processes intimately connected to the cooperative structural dynamics. For comparison of β- process at JG and Non-JG relaxation we compare the Non-JG relaxation at PVAc with JG relaxation at mixture of quinaldine (QN) with tristyrene.
At mixtures of quinaldine (QN) with tristyrene, Figure 3, ref. [12], the , T is constant for all the isobaric-isothermal paths but at PVAc the
  isn’t constant. So, it is likely to suppose that the connection between α- and β-dynamics isn’t a universal feature of all β-processes, but only at the JG relaxation.
5. Conclusion
We investigated the relation between secondary and structural dynamics of PVAc under variations of temperature and pressure. We found that the Non-JG relaxations and α-relaxation inside of PVAc is not relation to each other that it is different behaviour than the JG relaxation inside the mixture systems. The analysis consists in investigating the ratio  for different values of pressure and temperature (density and thermal energy), but the same value of structural relaxation time. According to such analysis we evidenced that the β- process in PVAc isnot related with the structural dynamics at the glass transition.
REFERENCES
- S. Sharifi, “Temperature Dependence of the Activation Volume of Secondary Relaxation in Glass Formers,” ISRN Materials Science, 2011, Article ID: 460751. doi:10.5402/2011/460751
- S. Sharifi and J. M. Asl, “Secondary Relaxation inside the Glass,” ISRN Materials Science, 2011, Article ID: 764874. doi:10.5402/2011/764874
- S. Sharifi, “Activation Volume of Secondary Relaxation,” Materials Sciences and Applications, Vol. 2, No. 6, 2011, pp. 624-628. doi:10.4236/msa.2011.26084
- H. Jansson and J. Swenson, “The Slow Dielectric Debye Relaxation of monoalcohols in Confined Geometries,” Journal of Chemical Physics, Vol. 134, No. 10, 2011, Article ID: 104504. doi:10.1063/1.3563630
- R. Bergman, H. Jansson and J. Swenson, “Slow DebyeType Peak Observed in the Dielectric Response of polyalcohols,” Journal of Chemical Physics, Vol. 132, No. 4, 2010, Article ID: 044504. doi:10.1063/1.3294703
- J. E. McKinney and R. Simha, “Configurational Thermodynamics Properties of Polymer Liquids and glasses,” Macromolecules, Vol. 7, No. 6, 1974, pp. 894-901. doi:10.1021/ma60042a037
- G. Dlubek, D. Kilburn and M. A. Alam, “Temperature and Pressure Dependence of α-Relaxation and Free Volume in Poly(vinyl acetate),” Macromolecular Chemistry and Physics, Vol. 206, No. 8, 2005, pp. 818-826. doi:10.1002/macp.200400495
- M. Tyagi, A. Aleg and J. Colmenero, “Broadband Dielectric Study of oligomer of poly(vinyl acetate): A Detailed Comparison of dynamics with Its Polymer Analog,” Physical Review E, Vol. 75, No. 6, 2007. doi:10.1103/PhysRevE.75.061805
- A. Alegr, L. Goitiand, I. Teller and J. Colmenero, “α- Relaxation in the Glass-Transition Range of Amorphous Polymers. 2. Influence of Physical Aging on the Dielectric Relaxation,” Macromolecules, vol. 30, No. 13, 1997, pp. 3881-3887. doi:10.1021/ma961266m
- L. Goitiandi and A. Alegría, “Physical aging of poly (vinyl acetate). A Thermally Stimulated Depolarization Current Investigation,” Journal of Non-Crystalline Solids, vol. 287, No. 1-3, 2001, pp. 237-241. doi:10.1016/S0022-3093(01)00578-6
- G. Floudas, “Effects of pressure on systems with intrinsic Orientational Order,” Progress in Polymer Science, Vol. 29, No. 11, 2004, pp. 1143-1171. doi:10.1016/j.progpolymsci.2004.08.004
- K. Kessairi, S. Capaccioli, D. Prevosto, M. Lucchesi, S. Sharifi and P. A. Rolla, “Interdependence of Primary and Johari-Goldstein Secondary Relaxations in Glass-Forming Systems,” The Journal of Physical Chemistry B, vol. 112, No. 15, 2008, pp. 4470-4473. doi:10.1021/jp800764w