Advances in Bioscience and Biotechnology
Vol.3 No.8(2012), Article ID:25819,8 pages DOI:10.4236/abb.2012.38137
Hyperammonemia induced oxidative stress in cirrhotic rats without promoting differential protein expression in the brain cortex: A 2D-DIGE analysis*
![]()
1Departamento de Bioquímica y Biología Molecular, Facultad de Farmacia, Universidad de Sevilla, Sevilla, Spain
2UCM Digestive Diseases and CIBERehd, Hospital Universitario de Valme, Sevilla, Spain
Email: #jdbaut@us.es
Received 20 September 2012; revised 27 October 2012; accepted 19 November 2012
Keywords: Oxidative Stress; Hyperammonemia; Cirrhosis; Hepatic Encephalopathy; Protein Expression
ABSTRACT
Oxidative stress induced by a high ammonia concentration could modify protein expression in the brain. This study was undertaken in order to investigate the impact of hyperammon-emia, caused by thioacetmide (TAA) in rats, on brain cortex protein expression using 2D-DIGE, and analyzing its role in the pathogenesis of HE. Hyperammonemia was induced with TAA. Ammonia and active oxidants were measured by L-glutamate dehydrogenase and dichlorodihydrofluorescein diacetate methods, respectively. Lipid peroxidation and protein oxidation biomarkers were also studied. Differential protein expression in the cortex of TAAand control-rats was studied by 2D-DIGE. Image analysis was performed using the DeCyder™ Software. Ammonia concentration in plasma and brain tissue was higher in TAA-rats compared to control-rats, 3.12 and 2.43 fold higher, respectively. Active oxidants production in TAA-rats was increased by 2.7 fold compared to control-rats. Measurements of MDA, HNE and carbonyl groups, biomarkers of lipid peroxidation and protein oxidation respectively, were found to be statistically significantly increased in TAA-rats compared to control-rats (3.16-, 2.44- and 1.95-fold, respectively), reflecting the presence of oxidative stress in the brain of TAA-rats. 2D-DIGE analysis of brain cortex protein allowed the detection of 2896 spots, however, image analysis showed no statistically significant differential protein expression between the proteins expressed in TAAand control-rats. No statistical significant differential protein expression in the cortex of TAA-rats was observed, although oxidative stress biomarkers for lipid and proteins were higher in the brain of TAA-rats than in control-rats. These results support the idea that oxidative post-translational modifications are implicated in HE physiopathology.
1. INTRODUCTION
Hepatic encephalopathy (HE) is the major neurologic disorder occurring in patients with severe liver disease which presents in chronic and acute forms. Chronic HE is a neuropsychiatric disorder which commonly occurs in the setting of alcoholic cirrhosis and is often associated with changes in personality, altered mood, decline in intellectual capacity and abnormal muscle tone. Acute HE (acute liver failure) has a high mortality rate (80% - 90%) due to the development of brain edema and increased intracranial pressure, and often presents with the abrupt onset of delirium, seizures and coma [1]. Although the pathophysiology of HE remains unclear, it is well established that ammonia plays a major role [2,3]. Ammonia accumulates in the brain in both acute and chronic liver failure, leading to a series of metabolic, energetic and signal transduction-related alterations [4]. However, it appears that other factors may also contribute. In particular, microglial activation and brain inflammation correlate with the progression of encephalopathy and the onset of brain edema in rats with acute liver failure [5]. Moreover, increased expression of the endothelial and inducible isoforms of nitric oxide synthase as well as heme oxygenase-1 [6] and direct oxidative biomarkers [7,8] have been reported in animal models, suggesting that oxidative/nitrosative stress also plays a significant role in the pathogenesis of brain complications observed in liver failure, and particularly in HE.
All these data indicate that oxidative stress is implicated in the development of HE, but they are not able to give any precise information about the mechanisms and proteins/enzymes involved in the physiopathology of HE. Therefore, the aim of the present work was to study the effect of oxidative stress, induced by high ammonia concentration, on rat brain proteins, using an animal model of HE. As a model of chronic HE, TAA-rats are often used because they allow studying longer exposition to high ammonia concentrations than the PCS-rat model [9]. In an attempt to gain knowledge on the pathogenesis of chronic HE, differential proteins expression was studied using a two dimensional differential in gel electrophoresis (2D-DIGE) approach, which allowed its identification and to study its relation with HE.
2. MATERIALS AND METHODS
2.1. Chemicals
Chemicals, proteases, and antibodies used in these studies were mainly purchased from Sigma-Aldrich (Madrid, Spain). Electrophoresis and DIGE materials were purchased from GE Healthcare (Barcelona, Spain). SuperSignal West Pico Chemiluminiscent Substrate was purchased from Thermo Scientific Inc. (Rockford, USA).
2.2. Animals
Male Wistar rats (n = 20) weighing 230 - 260 g at the beginning of the experiments, were used in the present study. Animals were supplied by the Centre of Production and Experimental animal of Espartinas, University of Seville, Spain. The animals were housed four per cage, and maintained at constant room temperature (22˚C ± 2˚C), with artificial light-dark cycle of 12 h and a relative humidity of 65% - 70%, and free access to food and water during 2 weeks for acclimation. All animal procedures were performed with approval from the Sevilla University Animal Ethics Committees, under the guidelines of the directive 86/609/CEE of the European Community.
2.3. Animal Model of HE (Thioacetamide Treatment)
After the 2 weeks of acclimation, the animals were divided into two groups, and two animals per cage: control group (n = 10) and thioacetamide (TAA) treated group (TAA-rats, n = 10). The control-rats received food and normal water and served as a control for 16 weeks. The TAA-rats received food and continuous administration of 0.03% TAA (Sigma, Madrid, Spain) in the drinking water as an initial concentration that was subsequently modified according to weight changes in response to TAA during the induction of cirrhosis. The treatment was maintained during 12 weeks [10]. At the 12th week the TAA-rats group had 8 animals (n = 8) and the control-rat group had 10 animals (n = 10). Animals were weighed weekly. Animals were killed by an overdose of pentobarbital and brains rapidly removed. Different brain loci (cortex, cerebellum, hippocampus) were dissected, frozen with liquid N2, and stored at –80˚C until use. In this study the cortex was used.
2.4. Sample Preparation for Analytical Procedures
Brain samples (cortex) (100 mg) were homogenized in 1 ml homogenization buffer (10 mM Hepes, 137 mM NaCl, 4.6 mM KCl, 1.1 mM KH2PO4, 0.6 mM MgSO4, 0.5 μg/ml leupeptin, 0.7 μg/ml pepstatin, 0.5 μg/ml type II S soybean trypsin inhibitor, 40 μg/ml PMSF), using a manual glass homogenizer (~50 passes). Homogenates were vortexed and sonicated for 10 s at 20% power in a sonication bath (Braun, Berlin, Germany), and centrifuge at 2500 × g in a microfuge (Mikro 200R, Hettich, Tübingen, Germany) to remove intact cells and nuclei. Protein concentrations were determined according to the Bradford method [11].
2.5. Measurement of Ammonia Concentration
Ammonia concentrations were measured in arterial plasma and brain tissue using the L-glutamate dehydrogenase method [12]. Plasma concentrations of ammonia were measured before the TAA-treatment and at the time of killing. Ammonia concentration was calculated and expressed as μmol/l. Brain tissue was homogenized as described above, and deproteinized in 5 volumes of icecold trichloroacetic acid (TCA) (100 g/l), and kept on ice for 15 min. After centrifugation at 12,000 × g for 10 min at 4˚C, the supernatant was collected, neutralized with 2 M KHCO3 and centrifuged at 12,000 × g for 10 min at 4˚C. The neutralized supernatant was used to measure ammonia by the glutamate dehydrogenase method as described above.
2.6. Measurement of Active Oxidants Production
Brain active oxidants production was measured in brain homogenates obtained as described above by the Thorburne and Juurlink method [13] using 5-(and-6)-carboxy- 20,70-dichlorodihy-drofluorescein diacetate (DCFDA), with minor modifications [14].
2.7. Measurement of Low Molecular Dialdehydes
Malondialdehyde (MDA) was determined by HPLC according to Mateos et al. [15] as described in [8]. 4-Hydroxy-2-noneal (HNE) was determined according to standard immunodetection procedures [16] as described in [8].
2.8. Measurement of Carbonyl Groups
The total protein carbonyl levels in homogenates from brain tissue (cortex) obtained in homogenization buffer, as described above, of TAAand control-rats were assayed following the Evans method [17] as described in [8].
2.9. Sample Preparation for Electrophoretic Separations
Cortex samples (in control or TAA-treated rats) were made powder with liquid N2 and kept at –80˚C. Approximately 10 mg of powder were mixed with 100 µl of lysis buffer (30 mM Tris-Cl pH 8.5, 2 M Thiourea, 7 M Urea, 4% (w/v) Chap). The homogenate were left on ice 10 minutes and sonicated 5 min. The homogenates were centrifuged in QIAshredder (Qiagen, Hilden, Germany) for eliminate the DNA and then centrifuged 15 min at 18,000 g at 4˚C in a microfuge (Mikro 200 R, Hettich, Tübingen, Germany). The supernatant was taken and protein content was determined according to the method of Bradford [11].
2.10. Conventional 2D-Electrophoresis
Protein samples (150 µg) were loaded onto IPG strips (pH 4 - 7, 13 cm) previously hydrated over-night with rehydration buffer (2 M Thiourea, 7 M Urea, 4% (w/v) Chaps, 0.2% IPG Buffer pH 3 - 10, 0.2% (w/v). The first dimension was performed using IPGphor 3 IEF system (GE Healthcare, Buckinghamshire, UK) at 20˚C. The conditions for the IEF were performed according to the manufacturer’s instructions (300 V during 3 hours, gradient to 1000 V during 3 h, gradient to 8000 V during 6 h, 8000 V during 6 h). The focused strips were equilibrated in equilibration buffer (50 mM Tris-Cl, 6 M Urea, 30% (v/v) glycerol, 2% (w/v) SDS) with 1% (w/v) dithiothreitol (DTT) for 15 min and transferred to 2.5% (w/v) iodoacetamide for 15 min. The SDS-polyacrilamide gel electrophoresis (SDS-PAGE) was run on 12% T and 2.7% C, 20˚C, 450 V, 10 W, 15 mA/gel 10 min, 25 mA/gel 2 h using a Criterion Cell unit (Bio-Rad Laboratories Inc., Munich, Germany). Two gels were stained with SYPRO-Ruby protein gel staining to visualize total proteins and for protein identification.
2.11. Differential in Gel Electrophoresis
2.11.1. Sample Preparation and Protein Labeling with Cydye
Proteins samples (100 mg cortex) of control and TAAtreated rats were treated with 2-D Clean-Up Kit (GE Healthcare) following the manufacturer’s instructions. The protein pellet was resuspended in lysis buffer (30 mM Tris, 7 M urea, 2 M thiourea, and 4% (w/v) CHAPS pH 8) and adjusted to pH 8. Protein concentration was determined using the Bradford method. Prior to labeling the proteins with saturation dye, the amounts of Tris (2- carboxyethyl) phosphine hydrochloride (TCEP; Invitrogen, USA) and dye were optimized according to the manufacturer’s protocol.
Traditional three-dye system was employed to reduce variability associated with the multiple samples being compared [18]. Control and TAA-treated rat samples were labeled with N-hydroxy succinimidyl ester derivatives of the cyanine dyes Cy2, Cy3, and Cy5 following a standard protocol [19].
2.11.2. 2-D Gel Electrophoresis
Immobilised 24 cm linear pH gradient (IPG) strips, pH 3-11NL, were rehydrated in rehydration buffer (7 M Urea, 2 M Thiourea, 4% CHAPS, 0.5% IPG Buffer, 50 mM DTT) overnight, according to the standard guidelines. Iso-Electric-Focusing (IEF) was performed using an IPGphorTM 3 apparatus (GE Healthcare) for a total of 40 kV/hour at 20˚C. Equilibrated IPG strips were transferred onto 12.5% uniform polyacrylamide gels poured between low fluorescence glass plates. Strips were overlaid with 0.5% w/v low-melting-point agarose in running buffer containing bromphenol blue. Gels were run using the Ettan Dalt 12 device (GE Healthcare) at 2.5 W/gel for 30 minutes then 100 W in total at 10˚C until the dye front had run off the bottom of the gels.
2.11.3. Image Acquisition and Statistical Analysis
After second-dimension SDS-PAGE, gels were scanned using the Typhoon 9400 variable mode imager (GE Healthcare). Cy2 protein maps were scanned using a 488-nm laser with a 530-nm emission filter; Cy3 was scanned using a 532-nm laser with a 605-nm emission filter; Cy5 was scanned using a 635-nm laser with a 695-nm emission filter. Gels were scanned at 100 μm resolution. Image analysis was performed using the DeCyder™ Software version 7.0 (GE Healthcare). Gel-togel matching of the standard protein maps from each gel, followed by statistical analysis of differential protein abundance between samples, was determined using the biological variation analysis module (BVA) of DeCyder™. Analysis of variance (ANOVA) was applied to matched spots and the data were filtered to retain protein spots with p ≤ 0.05 determined by 1-way ANOVA and a fold-change of ≥1.2. Using the EDA Version 1.0 (extended data analysis) module within the DeCyder software (GE Healthcare), data analysis was performed using principal components analysis (PCA) on proteins of interest [20].
2.12. Statistical Analysis
Results are expressed as mean ± SEM. Statistical analysis was carried out using Student’s t test. A value of p < 0.05 was considered significant.
3. RESULTS
In this work we have studied the effect of oxidative stress induced by hyperammonemia in an animal model (TAA-rats) of HE. Our aim has been the analysis of protein expression in the brain of TAA-rats and control-rats, and the correlation between these alterations and the physiopathology of HE.
First of all, we have confirmed that the animal model used, TAA-rats, was a suitable model to study HE-associated hyperammonemia. Rats treated with TAA showed symptoms of brain injury such as lethargy, lack of spontaneous movement, loss of righting reflex, lack of response to pain; and as shown in Table 1, the level of ammonia in plasma (303.98 ± 13.56 μmol/l versus 97.50 ± 9.23 μmol/l) and in brain cortex (8.39 ± 1.07 μmol/g tissue versus 3.44 ± 0.56 μmol/g tissue) were higher in TAA-rats compared with control-rats.
3.1. Oxidative Stress Biomarkers
Once it was established that TAA-rats were hyperammonemic, and that its behavior was related with some of the hallmarks of HE and taken into account that oxidative stress has been implicated as possible cause of HE [7-9,14], we tested the hypothesis that high ammonia concentration could promotes oxidative stress in the brain of TAA-rats. For this purpose the production of active oxidants (see Figure 1) and biomarkers of lipid and protein oxidations (see Table 1) have been quantified.
Measurements of global active oxidants production were carried out in a heterogeneous mixture of neurons, glial and microglial cells from TAAand sham-rat brain using DCFDA as a probe. As Figure 1 shows, active oxidants production in TAA-rats was 2.47 times higher than that of the control-rats (247% ± 16% versus 100%, respectively). Since DCFDA method mainly measured reactive oxygen species (ROS) we also investigated the production of reactive nitrogen species using nitric oxide (NO) as an appropriate marker of reactive nitric species (RNS). The production of NO was significantly higher in TAA-rats than in control-rats (21.80 ± 1.57 μmol/mg protein versus 14.76 ± 1.26 μmol/mg protein, respectively, p < 0.01) (Figure 2).
Measurement of low molecular dialdehydes (MDA and HNE) and carbonyl groups, biomarkers of lipid peroxidation and protein oxidation, respectively, were carried out by standardized methods as described in Materials and Methods. Results are shown in Table 1. The oxidation of lipids has been analyzed using two different methods: malondialdehyde (MDA) and 4-hydroxy-2- nonenal (HNE). In both cases, we found higher levels in TAA-rats than in control-rats (0.062 ± 0.006 μmol MDA/mg protein versus 0.021 ± 0.004 μmol MDA/mg protein, p < 0.01; and 0.018 ± 0.003 μmol HNE/mg protein versus 0.008 ± 0.002 μmol HNE/mg protein, p < 0.01, respectively).
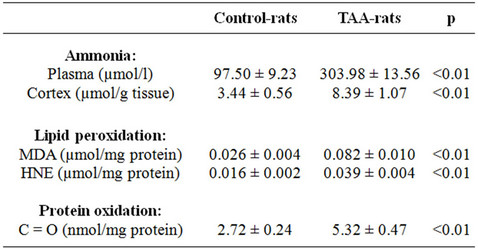
Table 1. Ammonia concentration in plasma and cortex. Lipid peroxidation and protein oxidation in the cortex of controland TAA-rats.
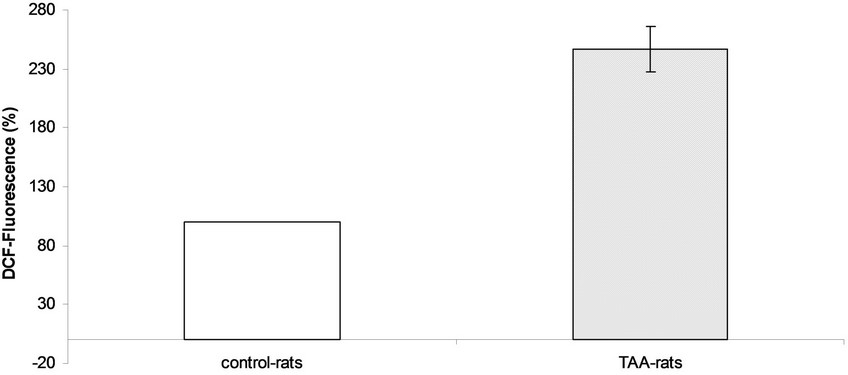
Figure 1. Active oxidants production in controland TAA-rats.
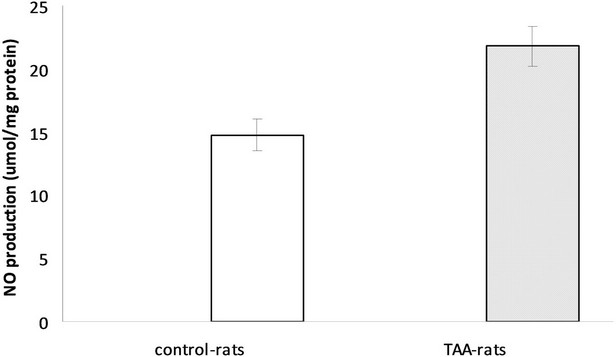
Figure 2. NO production in control and TAA-rats.
Protein oxidation has been studied by quantification of carbonyl groups, by 2,4-dinitrophenylhidrazine (DNPH) method, observing a higher level of protein oxidation in TAA-rats compared to sham-rats (5.30 ± 0.57 nmol/mg protein versus 2.72 ± 0.24 nmol/mg protein, p < 0.01, respectively).
These results show that hyperammonemia promotes oxidative stress in the brain of TAA-rats, but they do not reveal the mechanisms and proteins involved in the physiopathology of HE.
3.2. 2D-DIGE Analysis of Hyperammonemic Rat Brain Cortex Proteins
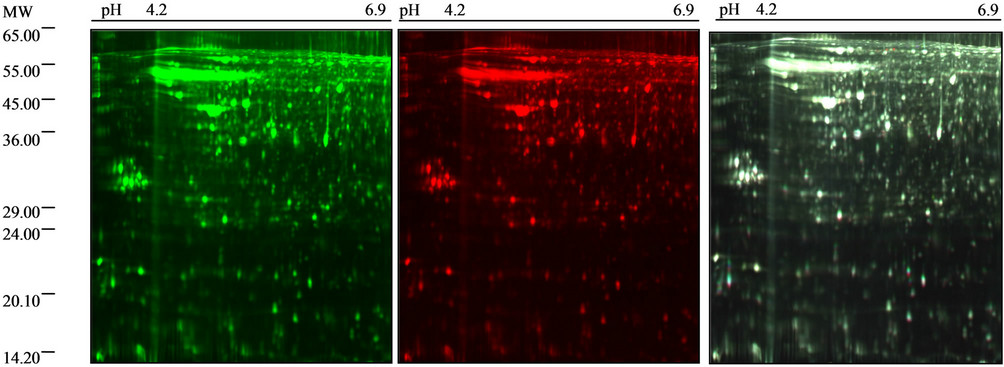
In order to identify proteins involved in the physiopathology of HE, we have studied differential protein expression in brain cortex from TAAand control-rats. Differential protein expression pattern has been analyzed by 2D-DIGE technique using minimal labeling with three fluorophores (Cy2, Cy3 and Cy5). Contrary to conventional protein staining such as Coomassie brilliant blue (CBB) or silver staining, fluorescent tagging of the entire brain cortex proteins drastically increases the number of detectable protein spots in standard 2-DE. A previous proteomic study of brain rat brain cortex proteins using CBB G-250 resulted in the detection of 636 individual 2-D spots (results not shown). The fluorescent DIGE analysis of brain cortex protein from TAAand control-rats described here resulted in the visualization of 2896 ± 18 spots (Figure 3). Hence, the DIGE-based proteomic profiling study of brain cortex rat proteins is approximately 4.5-fold more sensitive as compared to conventional protein labelling techniques. In addition, gel-to-gel variations in the 2-D protein distribution pattern are greatly reduced due to the simultaneous analysis of two different proteomes and a pooled standard on the same slab gel [21-23]. Thus, around 3000 differentially labelled brain cortex proteins can be analyzed per gel using 2D-DIGE technology, which is far superior to conventional nonfluorescent methods. In order to prevent the introduction of potential artifacts due to subcellular fractionation, this study employed total brain cortex extracts as starting material for our comparative proteomic profiling study. Consequently, the brain cortex proteins analyzed here represents major soluble proteins and therefore does not take into account potential changes in integral receptors and other non-soluble components. Figure 3 illustrates the representative protein spot pattern obtained for a 2D-DIGE experiment, showing the spots obtained for the control-rats cortex proteins (Cy3 excited, image A) and the TAA-rats cortex proteins (Cy5 excited, image B), respectively. As shown in the superposition of protein spot pattern obtained by labeling with Cy3 and Cy5 (image C). The analysis of these results by the DeCyder™ Software, reveals that no statistical differences between protein expressions in the cortex of TAAand control-rats were observed.
4. DISCUSSION
To verify that after 12 weeks TAA-treated rats (n = 8) were hyperammonemic, ammonia concentration in plasma and brain of controland TAA-rats was assessed; obtaining the following results: 96.6 ± 12.3 μmoles/l and 356.6 ± 32.3 μmoles/l, p < 0.01, in plasma and 0.36 ± 0.05 μmoles/g tissue and 0.97 ± 0.13 μmoles/g tissue, p < 0.01, in the brain, respectively. These results show that ammonia levels in plasma and total brain tissue were higher in TAA-rats compared to control-rats, 3.12- and 2.43-fold higher, respectively.
The presence of oxidative stress in the brain of 12 weeks-old TAA-rats was confirmed by measurement of global active oxidants production, in a heterogeneous mixture of neurons, glial and microglial cells from TAAand control-rat brain. Active oxidants production was measured using DCFDA as a probe. Active oxidants
 (a) (b) (c)
Figure 3. 2-D gel images of rat cortex labeled with minimal CyDye DIGE fluorophores. Control-rats sample labeled with Cy3, (a); TTA treated-rats sample labeled with Cy5, (b); Superposition of images A and B, (c).
production in TAA-rats was 2.7-fold higher than control-rats (Figure 1). The measurement of low molecular dialdehydes (MDA and HNE) and carbonyl groups, biomarker of lipid peroxidation and protein oxidation, respectively, were found to be significantly increased in TAA-rats compared with control-rats (Table 1). This result reflects the presence and action of oxidative stress in the brain of 12 week-old TAA-rats, where lower enzymatic antioxidant defense has been described too [24, 25].
These results agree with other studies that show that high ammonia concentration exposure induces oxidative stress in rat astrocyte cultures and mouse brain slices in vitro [14,26,27], and in vivo in the rat brain [24].
Metabolic, energetic and signal transduction-related alterations observed in HE and hyperammonemic rats [4] has been related with altered movements and psychointellectual activities. These alterations might be explained in part by differential expression of proteins and enzymes in the cortex of hyperammonemic rats [28-30], a brain area related with psychomotoric disturbances. Therefore, we study protein expression in the cortex of TAA-rats, an animal model of chronic HE, and sham-rats by a proteomic approach based on 2D-differential in gel electrophoresis (2D-DIGE).
2D-electrophoresis is an important proteomic tool, where thousands of proteins spots can be visualized, resulting in a global view of the state of a proteome [31], and comparing the 2D spot patterns from different samples (controland TAA-rats cortex, for example), changes in individual proteins abundance can be detected and quantified; allowing the identification of protein markers that are characteristic for a specific physiological or pathological state of a cell or a tissue [32]. However, a limitation on comparative 2-D analysis is the high degree of gel-to-gel variation in spot patterns that makes it difficult to distinguish any true biological variation from experimental variation [33]. A method that minimized these drawbacks is differential in gel electrophoresis (DIGE), were samples are labeled prior to electrophoresis with spectrally resolvable dyes CyTM2, Cy3 and Cy5. Samples are then mixed prior to EIF and resolved on the same gel [21]. The fluorophores are structurally similar and undergo nucleophilic substitution with the ε-amino group of lysine residues forming an amide. The fluorescent dyes have very similar molecular masses and are positively charged to mach the charge that is replaced on the lysine residue. This charge/mass matching ensures that all the samples essentially comigrate to the same point during electrophoresis. This ensures that, when the dye:protein ratio is low, protein molecules are only labelled with a single dye molecule [22], refining greatly the detection of changes at the protein level between samples.
Variation in spot intensity due to experimental factors, such as protein loss during sample entry into the strips, will be the same for each sample within a single DIGE gel. Therefore the relative amounts of a protein between samples in a gel will be unchanged. With conventional “one sample per gel” 2D techniques, samples to be compared are separated independently in different gels, and consequently, spot migration and intensity will be differ for each gel and sample in an experiment adding to the overall experimental variation.
The analysis of the spots (Figure 3) showed no statistically significant differences in expression among the 2896 resolved spots by DIGE method in the cortex of TAA-treated rats and control-rats. Although these results clearly indicate that no statistically significant differences (p < 0.05) were observed between TAA-treated rats and sham-rats, it should be stated that systematic differences for 14 spots were observed by DIGE study. Although these slightly differences could not be considered as the main causes of HE, its role should also not be excluded.
These results support the idea that oxidative posttranslational modifications are implicated in HE physiopathology, and have leaded us to consider the hypothesis that the cause of HE lies in post-translational modifications rather than in differential expression of proteins. We are currently working on this hypothesis.
REFERENCES
- Monfort, P., Cauli, O., Montoliu, C., Rodrigo, R., Llansola, M., Piedrafita, B., el Mlili, N., Boix, J., Agustí, A. and Felipo, V. (2009) Mechanisms of cognitive alterations in hyperammonemia and hepatic encephalopathy: Therapeutical implications. Neurochemistry International, 55, 106-112. doi:10.1016/j.neuint.2009.01.021
- Butterworth, R.F. (2002) Pathophysiology of hepatic encephalopathy: A new look at ammonia. Metabolic Brain Disease, 17, 221-227. doi:10.1023/A:1021989230535
- Romero-Gomez, M. (2010) Pharmacotherapy of hepatic encephalopathy in cirrhosis. Expert Opinion on Pharmacotherapy, 11, 1317-1327. doi:10.1517/14656561003724721
- Kosenko, E., Kaminsky, Y. and Grau, E. (1994) Brain ATP depletion induced by acute ammonia intoxication in rats is mediated by activation of NMDA receptors and Na1, K1-ATPase. Journal of Neurochemistry, 63, 2172- 2178. doi:10.1046/j.1471-4159.1994.63062172.x
- Jiang, W., Desjardins, P. and Butterworth, R.F. (2009a) Direct evidence for central proinflammatory mechanisms in rats with experimental acute liver failure: Protective effect of hypothermia. Journal of Cerebral Blood Flow & Metabolism, 29, 944-952. doi:10.1038/jcbfm.2009.18
- Jiang, W., Desjardins, P. and Butterworth, R.F. (2009b) Hypothermia attenuates oxidative/nitrosative stress, encephalopathy and brain edema in acute (ischemic) liver failure. Neurochemistry International, 55, 124-128. doi:10.1016/j.neuint.2009.02.007
- Norenberg, M.D., Jayakumar, A.R. and Rama Rao, K.V. (2004) Oxidative stress in the pathogenesis of hepatic encephalopathy. Metabolic Brain Disease, 18, 313-329. doi:10.1023/B:MEBR.0000043978.91675.79
- Carbonero-Aguilar, P., Diaz-Herrero, Mª.M., Cremades, O., Romero Gomez, M. and Bautista, J. (2011) Brain biomolecules oxidation in portocaval shunted rats. Liver International, 31, 964-969. doi:10.1111/j.1478-3231.2011.02515.x
- Reddy, P.V.B., Murthy, C.R.K. and Reddanna, P. (2004) Fulminant hepatic failure induced oxidative stress in nonsynaptic mitochondria of cerebral cortex in rats. Neuroscience Letters, 368, 15-20. doi:10.1016/j.neulet.2004.06.046
- Li, X.N., Irving, S.B. and Barry, A. (2002) Reproducible production of thioacetamide-induced macronodular cirrhosis in the rat with no mortality. Journal of Hepatology, 36, 488-493. doi:10.1016/S0168-8278(02)00011-9
- Bradford, M.M. (1976) Rapid and sensitive method for the quantitation of microgram quantities of protein utilizing the principle of protein-dye binding. Analytical Biochememistry, 72, 248-254.
- Bergmeyer, H.U. and Beutler, H-O. (1996) Method of enzymatic analysis, Vol. VIII. 3rd Edition, Academic Press, New York, 454-461.
- Thorburne, S.K. and Juurlink, B.H. (1996) Low glutathione and high iron govern the susceptibility of oligodendroglial precursors to oxidative stress. Journal of Neurochemistry, 67, 1014-1022. doi:10.1046/j.1471-4159.1996.67031014.x
- Murthy, C.R., Rama Rao, K.V., Bai, G. and Norenberg, M.D. (2001) Ammonia-induced production of free radicals in primary cultures of rat astrocytes. Journal of Neurosciene Research, 66, 282-288.
- Mateos, R., Lecumberri, E., Ramos, S., Goya, L. and Bravo, L. (2005) Determination of malondialdehyde (MDA) by high-performance liquid chromatography in serum and liver as a biomarker for oxidative stress: Application to a rat model for hypercholesterolemia and evaluation of the effect of diets rich in phenolic antioxidants from fruits. Journal of Chromatography B, 827, 76-82. doi:10.1016/j.jchromb.2005.06.035
- Kurisaki, E. and Hiraiwa, K. (2009) Western blot analysis for 4-hydroxy-2-nonenal (HNE)-modified proteins in paraquat-treated mice. Legal Medicine, 11, S431-S433. doi:10.1016/j.legalmed.2009.01.082
- Evans, P., Lyras, L. and Halliwell, B. (1999) Measurement of protein carbonyls in human brain tissue. Methods in Enzymology, 300, 145-156. doi:10.1016/S0076-6879(99)00122-6
- Karp, N.A. and Lilley, K.S. (2005) Maximising sensitivity for detecting changes in Protein expression: Experimental design using minimal CyDyes. Proteomics, 5, 3105-3115. doi:10.1002/pmic.200500083
- Alban, A., David, S.O., Bjorkesten, L., Anderson, C., Sloge, E., Lewis, S. and Currie, I. (2003) A novel experimental design for comparative two-dimensional gel analysis: Two-dimensional difference gel electrophoresis incorporating a pooled internal standard. Proteomics, 3, 36-44. doi:10.1002/pmic.200390006
- Perez-Perez, R., Ortega-Delgado, F.J., García-Santos, E., Lopez, J.A., Camafeita, E., Ricart, W., Fernendez-Real, J.M. and Peral, B. (2009) Differential proteomics of omental and subcutaneous adipose tissue reflects their unalike biochemical and metabolic properties. Journal of Proteome Research, 8, 1682-1693. doi:10.1021/pr800942k
- Unlu, M., Morgan, M.E. and Minden, J.S. (1997) Difference gel electrophoresis: A single gel method for detecting changes in protein extracts. Electrophoresis, 18, 2071- 2077. doi:10.1002/elps.1150181133
- Tonge, R., Shaw, J., Middleton, B., Rowlinson, R., Rayner, S., Young, J., Pognan, F., Hawkins, E., Currie, I. and Davison, M. (2001) Validation and development of fluorescence two-dimensional differential gel electrophoresis proteomics technology. Proteomics, 1, 377-396. doi:10.1002/1615-9861(200103)1:3<377::AID-PROT377>3.0.CO;2-6
- Marouga, R., David, S. and Hawkins, E. (2005) The development of the DIGE system: 2D fluorescence difference gel analysis technology. Analytical and Bioanalytical Chemistry, 382, 669-678. doi:10.1007/s00216-005-3126-3
- Kosenko, E., Kaminsky, Y., Kaminsky, A., Valencia, M., Lee, L., Hermenegildo, C. and Felipo, V. (1997) Superoxide production and antioxidant enzymes in ammonia intoxication in rats. Free Radic Research, 27, 637-644. doi:10.3109/10715769709097867
- Widmer, R., Kaiser, B., Engels, M., Jung, T. and Grune, T. (2007) Hyperammonemia causes protein oxidation and enhanced proteasomal activity in response to mitochondria-mediated oxidative stress in rat primary astrocytes. Archives of Biochemistry and Biophysics, 464, 1-11. doi:10.1016/j.abb.2007.03.027
- Schliess, F., Görg, B., Fischer, R., Desjardins, P., Bidmon, H.J., Herrmann, A., Butterworth, R.F., Zilles, K. and Häussinger, D. (2002) Ammonia induces MK-801-sensitive nitration and phosphorylation of protein tyrosine residues in rat astrocytes. FASEB Journal, 16, 739-741.
- Reinehr, R., Görk, B., Becker, S., Qvartskhava, N., Bidmon, H.J., Selbach, O., Haas, H., Schliess, F. and Häussinger D. (2007) Hypoosmotic swelling and ammonia increase oxidative stress by NADPH Oxidase in cultured astrocytes and vital brain slices. Glia, 55, 758-771. doi:10.1002/glia.20504
- Cauli, O., Lopez-Larrubia, P., Rodrigues T.B., Cerdan, S. and Felipo, V. (2007) Magnetic resonance analysis of the effects of acute ammonia intoxication on rat brain. Role of NMDA receptors. Journal of Neurochemistry, 103, 1334-1343. doi:10.1111/j.1471-4159.2007.04878.x
- Cauli, O., Mlili, N., Rodrigo, R. and Felipo, V. (2007) Hyperammonaemia alters the mechanisms by which metabotropic glutamate receptors in nucleus accumbens modulate motor function. Journal Neurochemistry, 103, 38-46.
- Cauli, O., Rodrigo, R., Piedrafita, B., Boix, J. and Felipo, V. (2007) Inflammation and hepatic encephalopathy: Ibuprofen restores learning ability in rats with portacaval shunts. Hepatology, 46, 514-519. doi:10.1002/hep.21734
- Görg, A., Obermaier, C., Boguth, G., Harder, A., Scheibe, B., Wildgruber, R. and Weiss, W. (2000) The current state of two-dimensional electrophoresis with immobilized pH gradients. Electrophoresis, 21, 1037-1053. doi:10.1002/(SICI)1522-2683(20000401)21:6<1037::AID-ELPS1037>3.0.CO;2-V
- Friso, G., Kaiser, L., Raud, J. and Wikström, L. (2001) Differential protein expression in rat trigeminal ganglia during inflammation. Proteomics, 1, 397-408. doi:10.1002/1615-9861(200103)1:3<397::AID-PROT397>3.0.CO;2-Z
- Voss, T. and Haberl, P. (2000) Observations on the reproducibility and matching efficiency of two-dimensional electrophoresis gels: Consequences for comprehensive data analysis. Electrophoresis, 21, 3345-3350. doi:10.1002/1522-2683(20001001)21:16<3345::AID-ELPS3345>3.0.CO;2-Z
NOTES
*This work was supported by a grant (Accion integrada: DE2009-0098) of the ministry of Innovación y Ciencia of Spain.
#Corresponding author.