Modern Economy
Vol. 4 No. 5 (2013) , Article ID: 32382 , 12 pages DOI:10.4236/me.2013.45041
Is Agricultural Production Spillover the Rationale behind CAADP Framework? Spatial Panel Model Approach
1International Food Policy Research Institute, Washington DC, USA
2Sandia National Laboratory, Albuquerque, USA
Email: J.Ulimwengu@cgiar.org, psanyal@sandia.gov
Copyright © 2013 John Ulimwengu, Prabuddha Sanyal. This is an open access article distributed under the Creative Commons Attribution License, which permits unrestricted use, distribution, and reproduction in any medium, provided the original work is properly cited.
Received January 14, 2013; revised February 15, 2013; accepted March 10, 2013
Keywords: CAADP; Agricultural Growth; Spatial Panel Model; Spillover; Convergence
ABSTRACT
The creation of a union is often rationalized on grounds of moving the equilibrium toward the first best solution whenever independent policies generate spillovers. This arises as a common agenda can significantly reduce the scope of free-riding behavior among member countries. In addition, cross-border externalities arising out of higher levels of market integration entails countries to agree on policy coordination. The present study explores the extent and magnitude of agricultural production spillover that might validate the adoption of a common agriculture agenda among African countries. Overall, our results suggest the presence of positive and significant agricultural production spillover. No evidence of beggar-thy-neighbor or negative spillover policies was found; on average, each country received 2.5 percent growth as a result of spillover. Our results also suggest that convergence dynamics is much stronger when spillover is accounted for, which provides a rationale for a common agenda such as CAADP.
1. Introduction
The majority of poor people in Africa lives in rural areas and depends directly or indirectly on agriculture for their livelihoods. Sustainable poverty alleviation strategies should thus focus on improving agricultural productivity. As pointed by [1], policy reforms undertaken by many African countries between the mid-1980s and the second half of the 1990s have played an important role in improving agriculture’s performance. The trend of total factor productivity (TFP) suggests a remarkable recovery in the performance of Sub-Saharan Africa’s agriculture during the 1984-2003 period after a long period of poor performance and stagnation in output.
However, to sustain high productivity growth in agriculture in the future, African countries in general and Sub-Saharan countries in particular will need well designed and better coordinated policies to improve the productivity of smallholder farmers who constitute the backbone of agricultural sector in Africa. Such common policy agenda should cover market and trade opportunities at domestic, regional, and international levels by providing appropriate incentives including infrastructure for improved market access. Infrastructure remains poor in most Sub-Saharan African (SSA) countries with the consequence that many SSA countries are often poorly integrated and characterized by a low level of competetion [2].
The lack of market integration implies that production shortfalls cannot easily be reversed via intraregional, interregional or international trade which may explain why the incidence of food emergencies remains high in many countries of the region. As a result, even where food production increases in some areas, food emergencies might not be averted in nearby zones due to the deficiencies in the structure and distribution of local markets and their lack of coordination with national and international distribution systems [3,4]. Therefore, there is a need for organizations such as the New Partnership for Africa’s Development (NEPAD), and regional economic communities (RECs) to initiate coordinated actions to improve access to public services and markets, hold governments’ accountable, make markets work for both the public and private sector, and address collective issues facing smallholder farmers. The main question then becomes: how to design and implement collective agricultural agenda aimed at lifting people out of poverty and hunger through improved agricultural productivity.
In order to address the above question, it is important to note that there are two broad strands of thought on the potential role of agriculture in Sub-Saharan African countries. The first view emphasizes the role of agricultural development within a market-based economic framework [5-7]. In contrast, the second school of thought highlights the potential of growth and poverty reduction through the rural off-farm sector or manufacturing exports [8,9]. Regardless of how agriculture is viewed, agricultural development and poverty reduction goals cannot be achieved simultaneously unless more attention is given to the agricultural sector in terms of both policy and investments. For many African countries, agriculture growth will remain the platform for initiating both forward and backward linkages to the rest of the economy in the coming decades, and thus will have strong spillover effects in raising agricultural productivity and incomes [10]. As a result, strategies and policies that aim at reducing food insecurity and poverty in the medium to long-term should not only focus on addressing these issues within the agricultural sector alone, but also through its interactions with the rest of the economy.
Adoption of common agricultural policies has the potential to exploit the continent’s abundant natural resources and achieve significant economies of scale, thereby making the sector globally competitive. In addition, by addressing access to interregional and intraregional trade for smallholder farmers, improvement of technology through sustainable natural resource management practices, and the fragility of different eco-systems in the region, common agricultural policies can strengthen the role of farmers’ organizations and improve productivity and incomes of smallholder farmers. However, there are also significant costs associated with common agricultural policies, as member countries lose part of their sovereignty in engaging in a common process of setting up policies and strategies. In addition, overlaps in memberships, mandates, objectives and protocols are also likely to generate “unhealthy multiplication and duplication of efforts” that leads to implementation challenges of two or more programs trying to address the same set of issues [11]. Moreover, regional integration through RECs remains inefficient and to a large extent resource constrained owing to “the substantial gaps between what is written in treaties and what happens on the ground” [12].
In theory, adoption of a common agenda should improve the efficiency of policy outcome whenever independent policies generate spillovers [13]. This arises as a common agenda can significantly reduce the scope of free-riding behavior among member countries. The present study seeks to determine whether there is evidence of the presence of spillovers that might justify the adoption of CAADP agenda among sub-Saharan African countries. We also explore possible impact of the presence of agricultural production spillover on spatio-temporal dynamoics of agricultural production among sub-Saharan African countries.
This paper is organized as follows: In the next section, we provide the current trends and challenges facing agricultural development in Africa while highlighting few areas where cross-country externalities can arise. Section three discusses the conceptual framework of the role of spatial externalities and the priority areas of cooperation for regional, international and national bodies. Section IV formulates the spatial econometric model used in the study, provides the main results of the study and a discussion based on the results of the rationale of a common agricultural policy. The final section provides some concluding thought of how best to rationalize common agriculture strategy for Africa that can ensure the unification of programs, activities and functions of regional and national agencies.
2. Issues Facing Agricultural Development in Sub-Saharan Africa and Policy Responses
The considerable homogeneity of production conditions over extensive areas of irrigated land with similar agroecological conditions, presence of factor and product markets, and a supportive institutional environment fostered rapid adoption of new technologies and created large productivity gains, in what is coined as the “green revolution” [14]. In contrast, the situation in Africa is different owing to the complexity of the constraints specific to the region, such as small and fragmented markets, heterogeneous agro-climatic zones, lower accessibility of services (including agricultural extension and advice, credit, storage infrastructures etc), and unsustainable natural resource management practices [15]. In addition, there are extensive market and government failures in agriculture. While market failure prevents the private sector to actively engage in market activities, in contrast government failures prevent the private sector from undertaking any investment projects that yield higher returns in the future.
Agricultural sector in SSA relies heavily on small scale farming. The general consensus is that smallholder farmers’ and other small and medium enterprises in the rural non-farm economy cannot compete alone in global markets. They need to cooperate with other large agro-business enterprises so as to achieve competitiveness through cluster development [16]. Linkages through contract farming can produce positive spillovers through higher supply, better planning cycles and limited exposure to fluctuations in international markets [17].
Following the Berg report in the early 1990s, it was recognized that improving agricultural policies were critical for achieving higher agricultural growth. Key areas of reform included the following:
● reforming incentive structures to ensure better prices for smallholder farmers;
● opening up agricultural marketing systems to allow for competition;
● rehabilitating marketing infrastructure, rural roads, and irrigation equipment;
● making improvements in crop and livestock research and pest control.
The above areas of Structural Adjustment Programs (SAPs) were less focused on an agricultural strategy and more centered on short-term macro-economic stabilization. However, the second phase of SAPs (1985-1998) was more proactive with increasing attention given to agricultural market reforms. These reforms included the following:
● liberalization of agricultural input and output prices by reducing or removing subsidies on inputs such as fertilizers;
● doing away with pan-seasonal and pan-territorial prices;
● reducing overvalued exchange rates;
● removing government regulatory controls in input and output markets;
● privatization by withdrawing marketing boards from pricing and marketing activities and restructuring public enterprises [18,19].
The limitations of SAPs in terms of strategy formulation and implementation for the agricultural sector are as follows: 1) lack of emphasis on the importance of supporting market institutions and infrastructure; 2) lack of participation and ownership in the design and implementation of SAPs by governments and other stakeholders such as civil society and farmers; 3) minimal private sector response; 4) limitations with ex-ante policy conditionality; 5) limited or lack of agricultural supply response; and 6) failure of SAPs (SAP1 and SAP2) to make a meaningful impact on growth and poverty reduction.
A decade into SAPs, Africa was still lagging behind— thus, Poverty Reduction Strategy Papers (PRSPs) were initiated to lay out macroeconomic and social programs and policies to be pursued by a country over a 3 or 5 year period in order to promote growth and reduce poverty. A review of several completed PRSPs suggests that while countries acknowledge the important role of agriculture in accelerating “pro-poor” growth, agricultural policies of the SAP era have largely been maintained [20]. Despite the shortcomings of the SAP reforms, the second generation of reforms brought to the attention of policy makers the factors that undermined agricultural productivity growth and strongly emphasized the role of agriculture as an engine of growth for most African countries. The PRSP rhetoric on the importance of agriculture was, however, not matched by increased investments in the sector (by both governments and donors)—agricultural research and development, extension services, and rural infrastructure development were widely neglected.
3. NEPAD’s Vision for Agricultural Growth in Africa1
In adopting the Comprehensive Africa Agriculture Development Programme (CAADP), African governments set for their countries a collective goal of achieving a 6percent agricultural growth rate, as a key strategy toward achieving the Millennium Development Goal of halving the poverty rate by 2015 from its 1990 level. They also opted for a partnership framework to mobilize the required funding to achieve the above growth rate, including the allocation by national governments of a budget share of at least 10% to the agricultural sector. Finally, CAADP also reflects an option for evidence and outcome based planning and implementation in support of an inclusive sectoral review and dialogue process, in line with the broader NEPAD peer review and accountability principle. Figure 1 presents an overview of CAADP functions and key players.
In promoting CAADP, the NEPAD framework has developed a vision of agriculture-led development in Africa that seeks to eliminate hunger and reduces food insecurity through an expansion of agriculture-led exports. As described below, CAADP framework is built around the four main technical pillars:
1) Expanding the area under sustainable land management and reliable water control systems. Pillar 1 objectives are as follows: a) To revert fertility loss and resource degradation, and ensure broad-based and rapid adoption of sustainable land and forestry management practices in the small-holder as well as commercial sectors; and b) To improve management of water resources while expanding access to both small-scale and large-scale irrigation.
2) Improving rural infrastructure and trade-related capacities for market access. The objectives of pillar two are as follows: a) To accelerate growth in the agricultural sector by raising the capacities of private entrepreneurs, including commercial and smallholder farmers, to meet the increasingly complex quality and logistical requirements of markets (domestic, regional and international) focusing on selected agricultural commodities that offer the potential to raise rural (onand off-farm) incomes; and b) A regulatory and policy framework that would expand regional trade and cross-border investments through the creation of regional economic actors
(3) Increasing food supply and reducing hunger. The objectives of pillar three are as follows: a) A well-managed and regionally coordinated food reserves and early warning systems at the national level that would allow
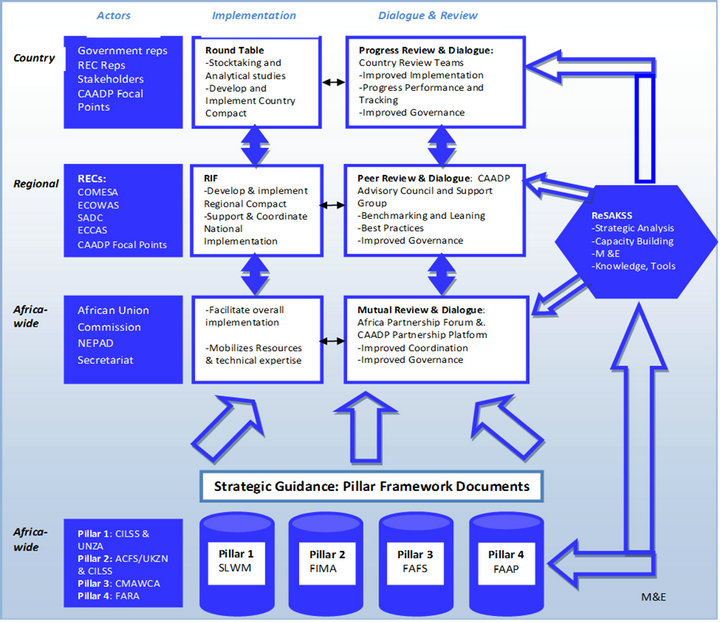
Source: [21]; Notes: CAADP: Comprehensive Africa Agriculture Development Program; NEPAD: New Partnership for Africa’s Development; RECs: Regional Economic Communities; RIF: Regional Implementation Framework; M&E: Monitoring and Evaluation; CMAWCA: Conference of Ministers of Agriculture of West and Central Africa; CILSS: Permanent Inter-State Committee for Drought Control in the Sahel; ACFS/UKZN: African Center for Food Security at the University of KwaZulu Natal; UNZA: University of Zambia; FARA: Forum for Agricultural Research in Africa; SLWM: Sustainable Land and Water Management; FIMA: Framework for the Improvement of Rural Infrastructure and Trade-Related Capacities for Market Access; FAFS: Framework for African Food Security; FAAP: Framework for African Agricultural Productivity; ECOWAS: Economic Community of West African States; COMESA: Common Market for East and Southern Africa (COMESA); SADC: Southern African Development Community; ECCAS: Economic Community of Central African States; and ReSAKSS: Regional Strategic and Knowledge Support Systems.
Figure 1. Overview of CAADP implementation functions and processes caption.
African countries to respond in a timely and cost-effective manner to food emergency crises; b) To reduce malnutrition in school-going children through diet supplementation with a complete meal that is adequate in carbohydrates, fat, protein, vitamins and minerals, and to expand local demand and stimulate production by smallholder farmers; and c) To develop an African nutrition initiative to meet countries’ broader nutritional challenges in a way that takes account of the complex and multisectoral nature of the problem and possible solutions.
4) Expand agricultural research, and technology dissemination and adoption. The objectives of pillar four are as follows: a) To achieve rapid flow of technologies suitable in the African context that are responsive to the constraints and opportunities facing farmers; b) To mobilize the large potential of cassava that can contribute to food security and income generation among African countries; c) Contribute to food security and poverty reduction, and ensure sustainable resource management, in the rice sector of ten Eastern, Central and Southern African countries through broad-based access to high-yielding New Rice for Africa (NERICA) rice lines, other improved varieties, and accompanying technologies; and d) To safeguard the future contribution of Africa’s fish sector to poverty alleviation and regional economic development, in particular through i) improved management of natural fish stocks; ii) development of aquaculture production; and iii) expansion of fish marketing and trade.
Cross-cutting Areas: The CAADP framework also addresses three clusters of critical issues that cut across the four CAADP pillars. These are: academic and professsional training to upgrade skills in the agricultural sector; information and knowledge systems to support sector strategy and policy formulation and implementation; and alignment of country Poverty Reduction Strategy Papers (PRSPs) with CAADP priorities and objectives.
At the country level, the Comprehensive Africa Agricultural Development Programme (CAADP) implementtation process aligns national agricultural sector policies, strategies, and investment programs with CAADP principles, pillars and targets. In particular, the process is focused on achieving a 6 percent national agricultural growth rate and allocating 10 percent of national budgets to the agriculture sector. The process builds on ongoing country efforts and is led by national governments and key stakeholders, with coordination by the regional economic communities (RECs)
4. Analytical Framework and Empirical Model
Following [22], we present a framework of a common agenda where a group of countries decide together on the provision of certain public goods and policies because of spillovers originating from neighboring countries.
Consider a group of N countries with the population size normalized to 1; the utility function of the representative individual of country i is given by
 (1)
(1)
where  is the per capita and total level of government spending in country i,
 ![]() is private consumption and
is private consumption and ,
, . The parameter
  captures how much a representative individual of country i values public consumption relative to private consumption.
If all N countries decide on a common agenda in the form of a union, the utility function of the representative individual in member country i is as follows:
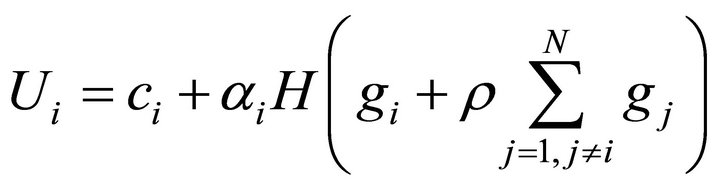 (2)
(2)
where  represents the spillover effects from other countries’ government spending on the “home” country. Furthermore, if each country has a balanced budget,
 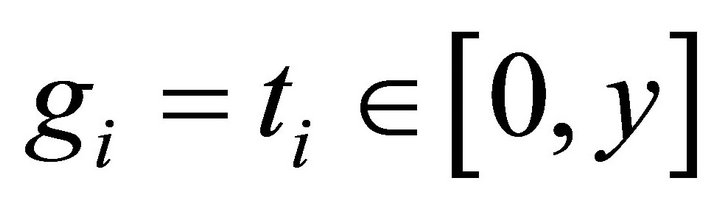 , then the utility function becomes
 (3)
(3)
where y is income,  are lump sum taxes raised in country i.
If every country acts independently, taking as given the spending of all the other countries, the first order conditions with respect to  is given by
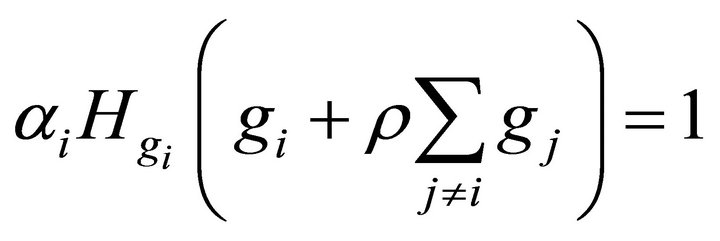 (4)
(4)
In the case of collective action, where each country takes into account other countries’ expenditures endogenously, the optimality condition for each country is given by:
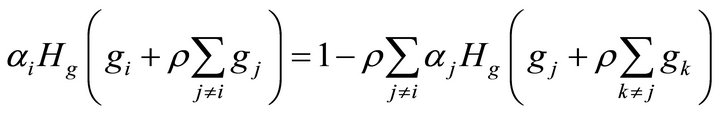 (5)
(5)
It follows that unless , the Nash equilibrium from the first order condition “Equation (4)” is inefficient because countries’ behaviors do not account for the effect of their decisions on other countries. The solution
  from the system “Equation (5)” is efficient because it incorporates spillover effects. As pointed out by [1], this first best policy requires that the union dictates a different policy for each country and that the policy preferences of every country are known and verifiable. Although these conditions seems highly unrealistic in practice, the CAADP agenda has provisions that meet these conditions: 1) CAADP is built around common goals in terms of agricultural growth, poverty reduction, and agricultural investment but the actual design of agricultural strategies is left to individual countries; 2) the CAADP peer-review mechanisms allows for regular verification of countries’ policy preferences.
If , the welfare outcomes with common agenda and without common agenda are qualitatively equivalent. In this case independent policy setting is more efficient than collective action given the cost of union participation.
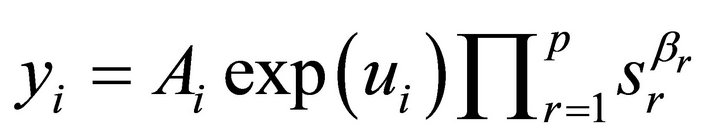
The purpose of the paper is therefore to estimate ρ. We use an unconstrained spatial Durbin model for panel data as described below. Given geographical proximity between countries, each country’s agricultural production can be expressed as a Cobb-Douglas:
 (6)
(6)
where  represents country i’s total factor productivity;
 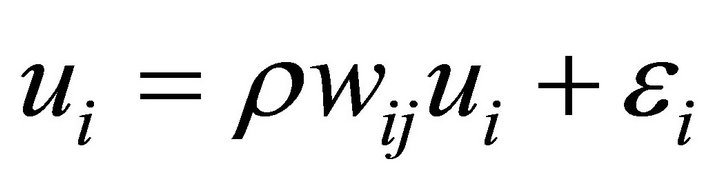 is an autoregressive (AR) spatial error term; ε is an error term with mean zero and constant variance; ρ represents substantive agricultural spatial spillover; β represent elasticity of production with respect to input s;
  are elements of the spatial weight matrix W that describes geographical proximity among countries. For convenience, matrix W is row-standardized.
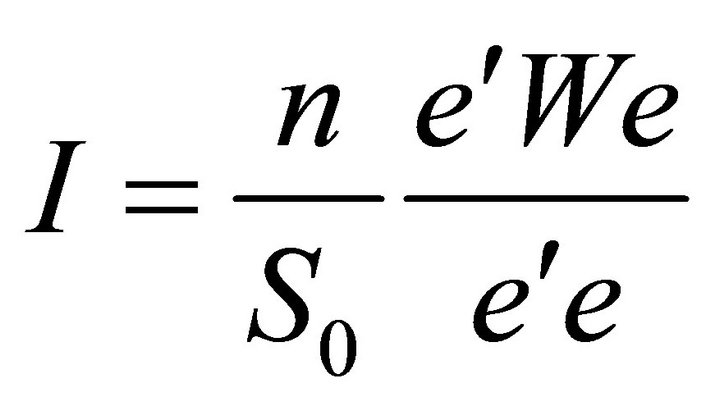
Since we do not observe policy interactions between countries, we specify the production function as a spatial error model. As a result, replacing u with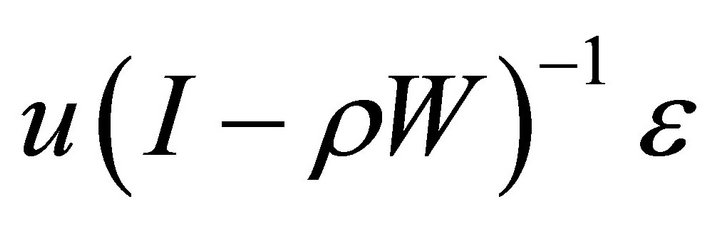 , Equation (6) yields a spatial Durbin model (SDM) in log linear form:
 2 (7)
2 (7)
where y is a n × 1 vector of observations on agricultural production for each country; S is a nxk matrix of observations on p  agricultural inputs for each of the n countries;
  is nx1 vector of ones.
As pointed out by [23], the spatial Durbin model nests most models used in applied spatial econometrics literature: 1) if , Equation (7) becomes a spatial autoregressive (SAR) model that includes a spatial lag of agricultural production from related countries, but excludes these countries' agricultural inputs; 2) if
 , it becomes a spatial error model (SEM); 3) if
  and
and , it is a non-spatial least-squares agricultural production model that assumes countries’ productions are independent. [23] shows that Equation (7) can be rewriteten as
 (8)
(8)
where 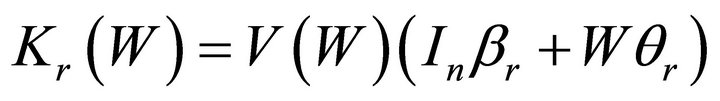
and 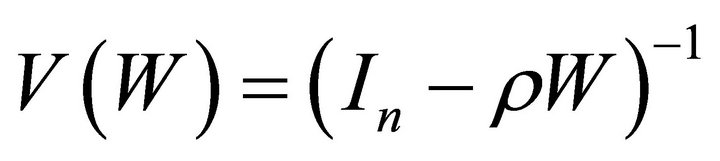 .
.
It follows that the derivative of  with respect to
  can be derived as follows:
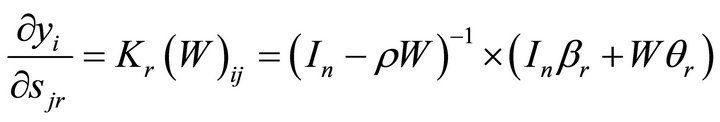 (9)
(9)
For the own derivative of the ith country, [24] shows that
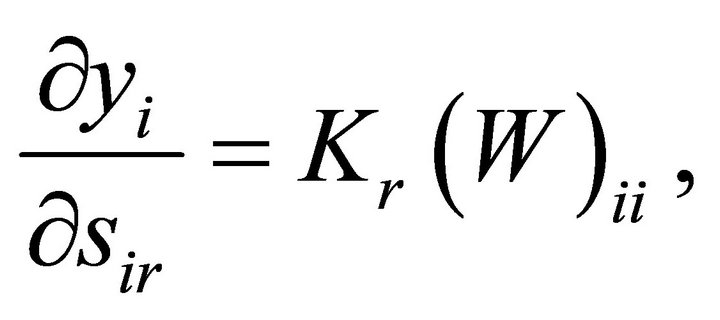 (10)
(10)
where 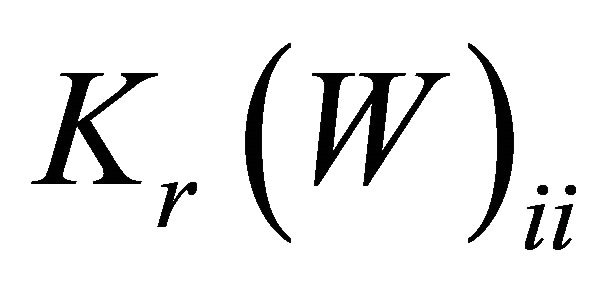 captures the impact on country i from a change in
  of country i himself.
Empirical inference of model (7) is conducted using tests presented in Appendix A. The presence of spillover has the potential to affect growth convergence. The NEPAD’s CAADP targets are for each country to achieve at least six percent agricultural growth rate every year;
this indicates that at some point African countries will achieve a convergence stage where least agricultural growing economies will catch-up with fast agricultural growing economies.
To test the potential for agricultural growth convergence, we adapt the β-convergence approach [24] which suggests that on average, poor countries grow faster than the rich ones (less-developed regions would be catchingup with more advanced regions). In other words, β-convergence implies a negative correlation between growth rates of per capita agricultural production and its initial levels. Table 1" target="_self"> Table 1 presents spatial and non-spatial specifications used to test for convergence.
4.1. Descriptive Analysis and Measurement of Variables
The Panel data were collected on 48 countries in SubSaharan Africa from 1961 to 2006.
Traditional inputs are from FAOSTAT website (http:// faostat3.fao.org/home/index.html) and Fuglie (2008). It includes agricultural output, fertilizers, livestock, tractors, labor and land quality. The summary statistics is presented in Table 2" target="_self"> Table 2 with means, standard errors, minimum, and maximum values of the variables (output, traditional inputs, land quality, and inefficiency changing variables).
Agricultural Gross Production (constant 1999-2001, US$1000, smoothed using Hodrick-Prescott filter with λ = 6.25) is used as a measure of agricultural production [25]. Fertilizer use is measured as the quantity of fertilizer plant nutrient consumed (tones of N P205 plus K20). Agricultural land is measured as the sum of pasture land and permanent crops in thousand hectares (not quality adjusted). Agricultural labor is measured as the number of persons (male and female) economically active in thousands. The livestock variable is the number of Cattle Equivalent-Aggregate using Hayami-Ruttan weights [25]. The farm machinery is the number of agricultural tractors in use.
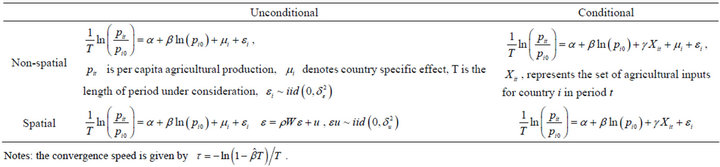
Table 1. Spatial and non-spatial model for convergence.
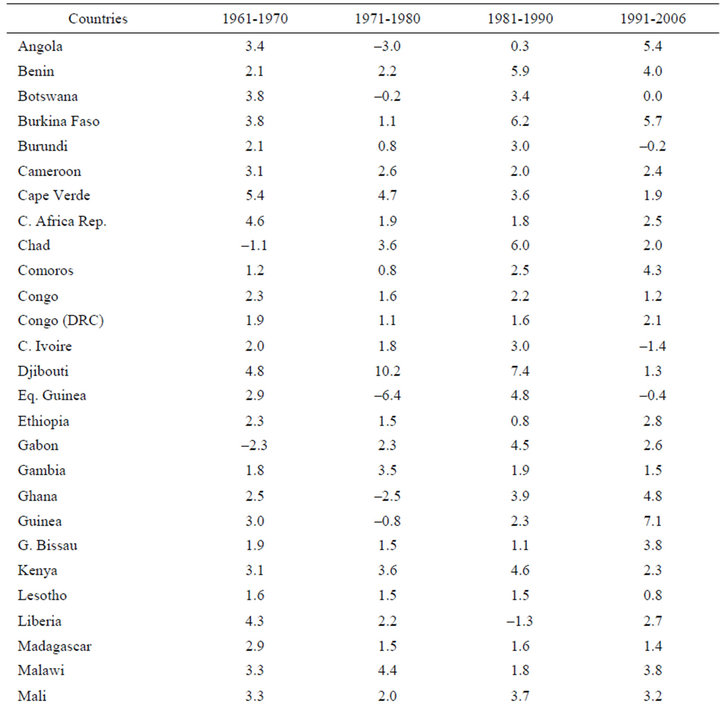
Table 3 presents the number of countries by growth range and sub-periods over 1961-2006. Across sub-periods, the majority of countries have achieved 4 percent growth rate or less. However, the results suggest different trends across both locations and time. The highest number of countries (10) with negative growth rates is observed during the 1971-1980 sub-period. This corresponds to the period where exchange rates in some countries became overvalued in order to make imports cheaper and raise the price of exports. However, the overvaluation of the exchange rate discouraged exports of primary commodities, which included the exports of agricultural crops. High population growth rates, growing urban populations, and overvalued exchange rates promoted an increase in food imports while the price of non-tradables increased relative to food imports [26]. Over the 1991-2006 subperiod, 29 out of 47 countries achieved growth rates ranging from 1 to 4 percent (see Appendix B for complete list of agricultural growth rates by countries and sub-periods). As shown in Figure 2, the West African region registered the highest growth rate during the period1999 to 2005—the growth rate of this region was 5 percent compared to the African average of 3.3 percent.
4.2. Estimation Results
Regression results are presented in Table 4. Overall, except for machinery, production elasticities with respect to countries own inputs are positive and significant: 0.689 (land), 0.034 (fertilizer), 0.379 (labor), and 0.430 (livestock). The results suggest the presence of significant externalities or neighboring country production effects on own countries’ agricultural production, with the elasticity of agricultural production with respect to neighboring countries’ being be 0.039 over the 1961-2006 period. In other words, on an average, a one percent increase (decrease) in agricultural production in neighboring countries increased (decreased) agriculture production in the home country by 0.039 percent. After a sharp decline during 1971-1980, the neighboring country’ effect increased to 0.179 during 1991-2006—the period in which the NEPAD’s CAADP agenda has been adopted by African leaders.
With respect to inputs, we found negative and significant effect of neighbors’ elasticity of labor during the period 1981-1990 (−0.019). Although negligible, this implies that an increase (decrease) in the use of agricultural labor in neighboring countries has the potential to lead to a decrease (increase) in agriculture production in the home country. This finding makes sense if one assumes fixed labor supply and spatial mobility of agricultural labor among SubSaharan African countries. Negative significant externalities are found for machine use in 1971-1980.
This finding suggest that by increasing the use of other agricultural inputs such as fertilizer, land and water, there is a risk that if left uncoordinated intensive mechanization by one country can lead to a decrease in production in neighboring countries. On an average, the pace of agricultural mechanization in Sub-Saharan Africa has been slow due to the high costs of implementation and low effectiveness of modern agricultural equipment [27]. Government-run tractor programs in the 1960s and early 1970s were largely ineffective as a result of management failures, shortfalls of government financial support and poor supporting infrastructures [28].
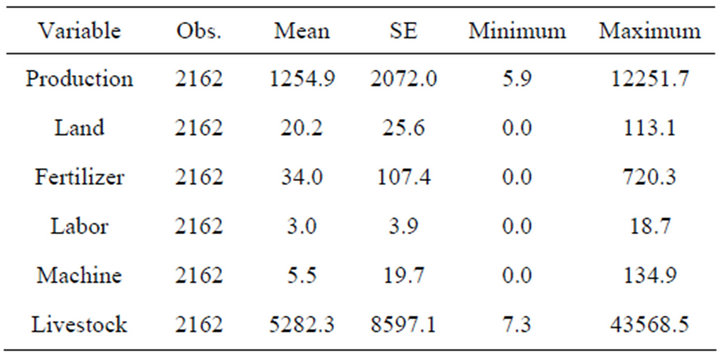
Table 2. Descriptive statistics.

Table 3. Distribution of countries by growth range and subperiods.
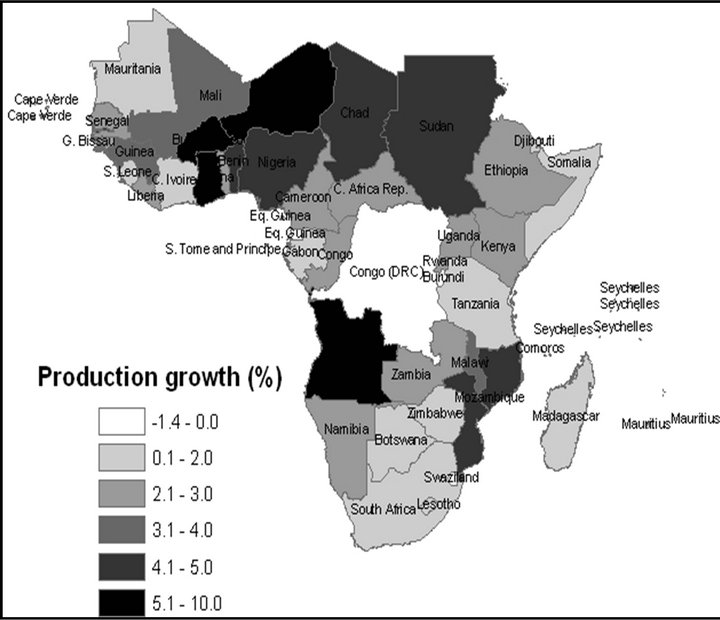
Figure 2. Agricultural production growth (1991-2006).

Table 4. Regression results.
In the literature, there are two terms that are used to characterize policy spillover effects: 1) beggar-thyneighbor policies: These are policies that attempt to remedy the economic problems in one country through mechanisms that tend to worsen the problems of other countries [29]; 2) prosper-thy-neighbor policies: These are policies that generate positive spillovers of a neighboring country’s agricultural production on own countries production [30].
Using agricultural growth rates as an outcome of agricultural policies, the results reported in Figure 3 suggest that on an average, no country witnessed negative spillovers due to its neighbors. In contrast, on an average, each country attained 2.5 percent growth rate as a results of spillover from neighbors. Even countries with negative actual agricultural growth rate such as Equatorial Guinea (–0.5 percent), Swaziland (–0.6 percent), DRC (–1.4 percent) and Burundi (–0.2 percent), benefited from positive spillover growth rates of 1.8 percent, 2.5 percent, 2.5 percent and 3.1 percent, respectively. Ethiopia (4.4 percent), Uganda (4.4 percent), Nigeria (4.4 percent), Comoros (3.7 percent), and Zambia (3.5 percent) are the top beneficiaries from the production effects of its neighbors.
4.3. Convergence Results for Per-Capita Agricultural Growth
The results confirm the potential for convergence of percapita agricultural growth among Sub-Saharan countries. Both spatial and non-spatial specifications support the hypothesis that countries lagging in terms of per capita agricultural growth are catching up with the leading countries. As shown in Figure 4, the potential for convergence is much higher when spatial spillover is accounted for. In addition, the use of agricultural inputs in the production function specification substantially improves convergence.
Figure 5 presents the speed of convergence by model specifications. It appears that incorporating spatial and conditional specifications lead to higher speed of convergence than non-spatial and unconditional specifications respectively. This confirms the important role of spatial spillover in achieving a common agenda such as the six percent growth target under CAADP agenda.
5. Conclusions and Implications
Both theory and empirical evidence clearly suggest that

Figure 3. Agricultural growth effects from neighboring countries (%).
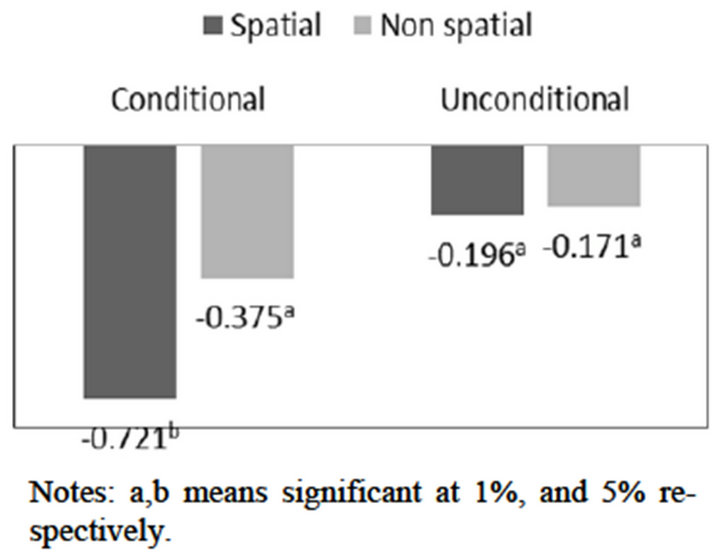
Figure 4. β-convergence.
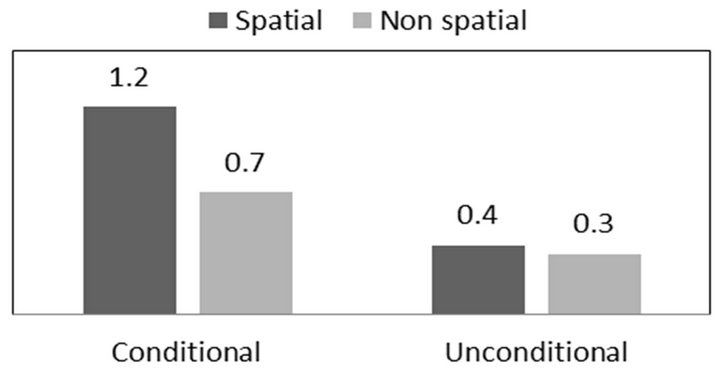
Figure 5. Speed of convergence.
geographical proximity can generate spillovers which ultimately affect agricultural growth dynamics across countries. The creation of a common union is often rationalized on grounds of moving the equilibrium toward the first best solution whenever independent policies generate spillovers. This arises as a common agenda can significantly reduce the scope of free-riding behavior among member countries. In addition, cross-border externalities arising out of higher levels of market integration requires countries to agree upon policy coordination relative to the option of breaking ranks.
Using a Spatial Durbin Model for panel data, the present study examined the extent and magnitude of agricultural production spillover that might validate the adoption of CAADP agenda among Sub-Saharan African countries. Overall, our results suggest the presence of positive agricultural production spillovers. No evidence of beggar-thy-neighbor or negative spillover policies was found. On an average, each country received 2.5 percent growth as a result of spillover. Finally, our results suggest that convergence dynamics is much stronger whenever spillover is accounted for which provides a rationale for a common agenda such as CAADP.
Our results have clear implications for policies that require coordinated interventions by donors and countries. First, bringing in countries to pursue a common agricultural policy agenda will require coordinated actions in the provision of a public good, such as international agricultural research. Second, monitoring such coordinated actions will require an institutional setting (such as the NEPAD and the RECs) for sustained consistency. Finally, the adoption of a common agricultural policy is one way of making foreign aid work better. Donors can fund a common agricultural agenda continent-wide that can move the equilibrium toward the first best solution whenever independent policies generate spillovers. Such coordination will help in guiding strategies and investments to achieve sustainable growth, poverty reduction, and food and nutrition security.
REFERENCES
- A. N. Pratt and B. Yu, “An Updated Look at the Recovery of Agricultural Productivity in Sub-Saharan Africa,” IFPRI Discussion Paper No. 787, Washington DC, 2008.
- FAO, FAOSTAT Database, 2006. http://faostat3.fao.org/home/index.html
- FAO (Food and Agriculture Organization of the United Nations), “Agriculture’s Contributions to Economic and Social Development,” The Electronic Journal of Agricultural and Development Economics, Vol. 1, No. 1, 2004, pp. 1-5.
- NEPAD Secretariat, CAADP, “CAADP Country Level Implementation Process,” Concept Note Prepared by the NEPAD Secretariat Based on the Outcome of the NEPAD Implementation Retreat, Pretoria, 24-25 October 2005. http://fsg.afre.msu.edu/mgt/caadp/country_implementation_process_concept_notev21.pdf
- H. P. Binswanger-Mkhize and A. F. McCalla, “The Changing Context and Prospects for Agricultural and Rural Development in Africa,” International Fund for Agricultural Development and African Development Bank, Rome and Tunis, 2009.
- R. Stringer and P. Pingali, “Agriculture’s Contributions to Economic and Social Development,” Journal of Agricultural and Development Economics, Vol. 1, No. 1, 2004, pp. 1-5.
- DFID, “Agriculture and Poverty Reduction: Unlocking the Potential,” DFID Policy Paper, London, 2003.
- F. Ellis, “A Livelihoods Approach to Migration and Poverty Reduction,” Paper commissioned by DFID, London, 2003.
- M. Fafchamps, F. Teal and J. Toye, “Towards a Growth Strategy for Africa,” Centre for the Study of African Economies, University of Oxford, Oxford, 2001.
- T. Reardon, J. Bergegué and Escobar, G., “Rural Nonfarm Employment and Incomes in Latin America: Overview and Policy Implications,” World Development, Vol. 29, No. 3, 2001, pp. 395-409. doi:10.1016/S0305-750X(00)00112-1
- UNECA (United Nations Economic Commission for Africa) Economic Report on Africa, “Accelerating Africa’s Development through Diversification,” Addis Ababa, Ethiopia, 2007.
- A. Wambo, “Regional Integration in Africa and Its Implications for Rural Development,” UN Economic Commission for Africa Report No. 2, Addis Ababa, 2006.
- F. Etro, “International Policy Coordination with Economic Unions,” Harvard University Manuscript, Boston, 2001.
- A. D. Janvry and E. Sadoulet, “Agriculture for Development in Africa: Business-as-Usual or New Departures,” Journal of African Economies, Vol. 19, Suppl. 2, 2010, pp. ii7-ii39
- A. Dorward, S. Fan, J. Kydd, H. Lofgren, J. Morrison, C. Poulton, N. Rao, L. Smith, H. Tchale, S. Thorat, I. Urey and P. Wobst, “Institutions and Economic Policies for Pro-Poor Agricultural Growth,” DSGD Discussion Paper No. 15, IFPRI and Centre for Development and Poverty Reduction, Washington DC and London, 2004.
- J. A. Berdegué, “Cooperating to Compete. Peasant Associative Business Firms in Chile,” Published Doctoral Dissertation, Wageningen University and Research Centre, Department ofSocial Sciences, Communication and Innovation Group, Wageningen, 2001.
- K. Felgenhauer and P. Labella, “Global Agro-Food Supply Chain: Is there space for Africa?” In: Turning African Agriculture into a Business: A Reader, OECD Development Center, Paris, 2008.
- M. Kherallah, C. Delgado, E. Gabre-Madhin, N. Minot and M. Johnson, “Reforming Agricultural Markets in Africa: Achievements and Challenges,” Johns Hopkins University Press, Baltimore, 2002.
- T. S. Jayne, J. Govereh, A. Mwanaumo, J. K. Nyoro and A. Chapoto, “False Promise or False Premise? The Experience of Food and Input Market Reform in Eastern and Southern Africa,” World Development Vol. 30, No. 11, 2002, pp. 1967-1985. doi:10.1016/S0305-750X(02)00115-8
- X. Diao, P. Hazell, D. Resnick and J. Thurlow, “The Role of Agriculture in Development: Implications for SubSaharan Africa,” Research Report 153, International Food Policy Research Institute, Washington DC, 2007.
- O. Badiane, S. Odjo and J. Ulimwengu, “Emerging Policies and Partnerships under CAADP: Implications for Long-Term Growth, Food Security, and Poverty Reduction,” IFPRI Discussion Paper No. 1145, 2011. http://www.ifpri.org/sites/default/files/publications/ifpridp01145.pdf
- A. Alesina, I. Angeloni and F. Etro, “The Political Economy of International Unions,” NBER Working Paper No. 8645, Cambridge, 2001. http://cdi.mecon.gov.ar/biblio/docelec/harvard/hier/1939.pdf
- J. P. Lesage and M. M. Fisher, “Spatial Growth Regressions: Model Specification, Estimation and Interpretation,” Spatial Economic Analysis, Vol. 3, No. 3, 2008, pp. 275-304. doi:10.1080/17421770802353758
- R. J. Barro and X. Sala-i-Martin, “Economic Growth Theory,” MIT Press, Cambridge, 1995.
- K. O. Fuglie, “Is a Slowdown in Agricultural Productivity Growth Contributing to the Rise in Commodity Prices?” Agricultural Economics, Vol. 39, No. s1, 2008, pp. 431- 441. doi:10.1111/j.1574-0862.2008.00349.x
- C. L. Delgado, “Agricultural Diversification and Export Promotion in Sub-Saharan Africa,” Food Policy, Vol. 20, No. 3, 1995, pp. 225-243. doi:10.1016/0306-9192(95)00015-7
- P. L. Pingali, Y. Bigot and H. P. Binswanger, “Agricultural Mechanization and the Evolution of Farming in SubSaharan Africa,” Johns Hopkins University Press, Baltimore, 1987.
- G. C. Mrema, D. Baker and D. Kahan, “Agricultural Mechanization in Sub-Saharan Africa: Time for a New Look,” Agricultural Management, Marketing and Finance Occasional Paper 22, Rome, 2008.
- J. Robinson, “Essays on the Theory of Employment,” Blackwell, Oxford, 1937.
- G. Corsetti and P. Pesenti, “Welfare and Macroeconomic Interdependence,” Quarterly Journal of Economics, Vol. 116, No. 2, 2001, pp. 421-46. doi:10.1162/00335530151144069
Appendix A: Spatial Regression Model Tests
Tests of spatial correlation:
The Moran’s I for regression residuals is given
where e is the  vector of OLS residuals.
There are several tests with well-designed alternative hypotheses:
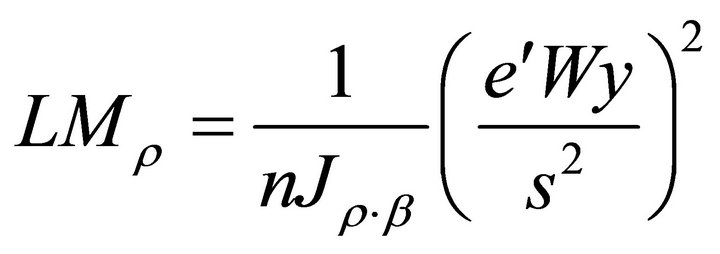
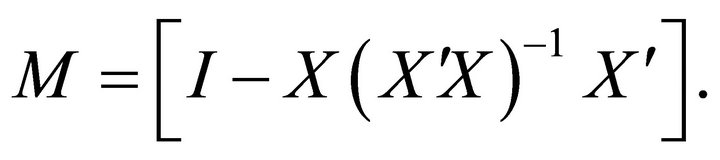
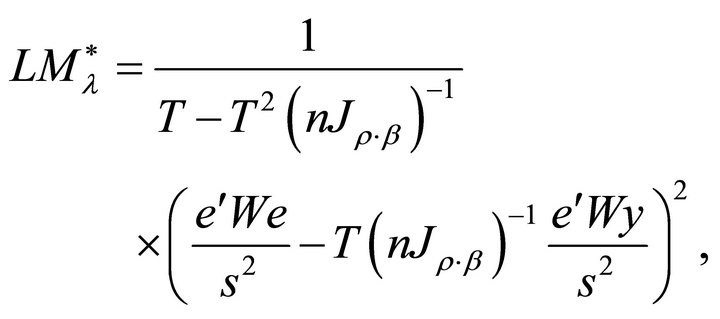
1) Lagrange Multiplier test for spatial error;
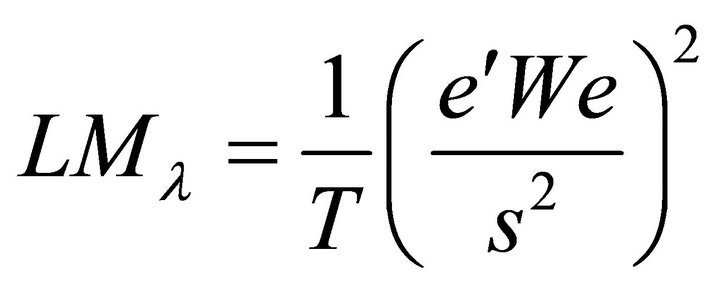
where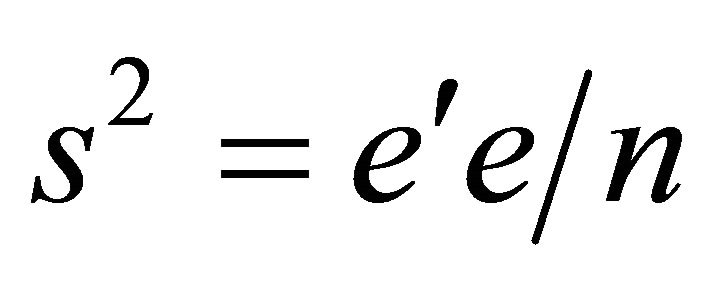 , is the maximum likelihood variance and
 , with tr being the matrix trace operator.
2) Lagrange Multiplier test for spatial lag;
where 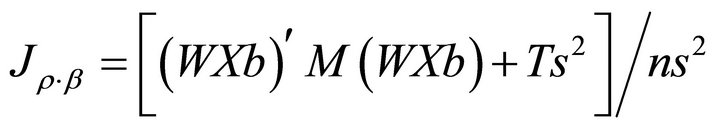 is part of the ML estimated information matrix, b is the vector of OLS estimated parameters, and
We also use robust tests developed by Anselin et al. (1996):
3) Robust Lagrange Multiplier test for spatial error;
where , is the maximum likelihood variance and
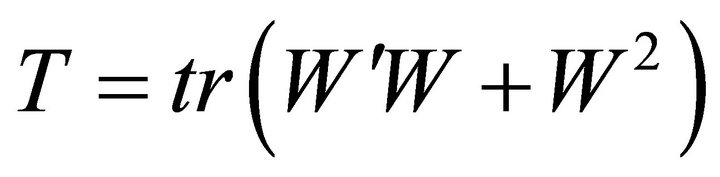 , with tr being the matrix trace operator.
4) Robust Lagrange Multiplier test for spatial lag;
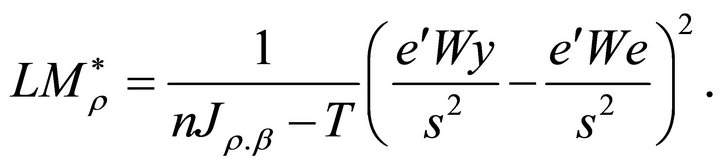
These tests asymptotically follow a 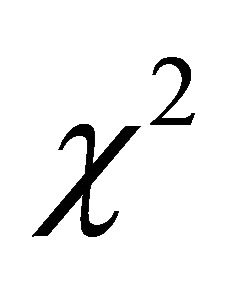 distribution with one degree of freedom.
Appendix B: Agricultural Growth Rates by Countries and Sub-Periods

NOTES
1See for example [21].
2The complete form of the model with time and country subscripts is: .
.