Modern Economy
Vol. 3 No. 3 (2012) , Article ID: 19161 , 8 pages DOI:10.4236/me.2012.3340
State Based Determinants of Inward FDI Flow in the US Economy
1Department of Economics, Finance, and Information Systems, Embry-Riddle Aeronautical University, College of Business Daytona Beach, Daytona Beach, USA
2Department of Business Administration, Bethune-Cookman University, School of Business Daytona Beach, Daytona Beach, USA
Email: korneckl@erau.edu, ekanayakee@cookman.edu
Received October 22, 2011; revised February 15, 2012; accepted February 25, 2012
Keywords: Inward FDI Flow; State Based Determinants; US Economy
ABSTRACT
Inward foreign direct investment (FDI) represents an integral part of the US economy. The flow of international capital has been a key factor expanding economy. The inward US FDI constitutes important factor contributing to output growth in the US economy. This paper investigates factors affecting the inward FDI flow among fifty states of the United States. The analysis uses annual data for the period from 1997 to 2007. The study identifies several state-specific determinants of FDI and investigates the changes in their importance during the study period. Our results show that among the major determinants, the real per capita income, real per capita expenditure on education, FDI related employment, research and development expenditure, and capital expenditure are found to have a significant positive impact on FDI inflows. There is also evidence that the share of scientists and engineers in the workforce exerts a small positive impact on inward FDI flow. In addition, per capita state taxes, unit labor cost, manufacturing density, unionizetion, and unemployment rate exert a negative impact on FDI inflows.
1. Introduction
The financial crisis, which began in summer 2007 has led to a progressive deterioration of the investment situation. Various indicators during the first half of 2008 already suggested a decline in world growth prospects as well as in investors’ confidence. This deteriorating climate began to leave its first negative marks in investment programs, including FDI, in early 2008. According to UNCTAD’s 2008-2010 World Investment Prospects Survey, conducted April-June 2008, 40 per cent of the respondent companies already mentioned at that time that the financial instability had a “negative” or “very negative” impact on their investment. Data available during summer 2008 already showed a downward trend for 2008, both for crossborder mergers and acquisitions (M&As) and greenfield investments, as compared to the same period of the previous year [1]. The setback in FDI has particularly affected cross-border mergers and acquisitions (M&As), the value of which was in sharp decline in 2008 as compared to the previous year’s historic high. It has also taken the form of a rising wave of divestments and restructurings. International greenfield investments have been less impacted to this point, but a large number of projects have been cancelled or postponed.
Inward foreign direct investment (FDI) is an essential component of the US economy, contributing to productivity growth, exports and high-paying jobs for American workers. Advanced and developing economies have recognized the value of foreign investment, resulting in an increasingly competitive international environment for FDI. Each member of the Organization for Economic Cooperation and Development (OECD) now maintains an investment promotion agency to attract foreign investment. United States welcomes foreign investment and provides international investors a stable and open economy. The United States remains an attractive location for foreign investment. Investing in the United States has many advantages. The United States has more than 307 million people, a landmass of 3.7 million square miles, an economy larger than any other single country, and s the most important market for a global business.
Inward FDI represents an integral part of the US economy. Foreign companies and their US subsidiaries generate enormous economic benefits for the American economy and bring billions of investment dollars into the United States, create thousands of in-sourced American jobs, and highlight the importance of the US market for foreign companies as a location for their business operations. The United States continues to be the leading destination for foreign direct investment (FDI) and the leading investor in other economies. The United States has been a very attractive investment destination due to its low-risk profile as compared to other leading global economies. However, the recent economic downturn and resulting public policies decreased US FDI inflows significantly [2]. Kearney’s index ranks World inward FDI and reveals FDI flows and the factors that drive corporate decisions to invest abroad. The major finding in A.T. Kearney’s 2010 FDI report indicates that China and United States are the first and second most attractive FDI locations in the world and have achieved unprecedented levels of investtor confidence [3]. The United States remains a strong FDI magnet in the World economy.
The paper is structured as follows: The next section presents a survey of literature and inward US FDI flow vs. inward US FDI stock. The following section presents the specification of the econometric model while section three discusses the variables and data sources. The empirical results are presented in section four and finally, section five summarizes the main results and concludes with some policy implications.
1.1. Literature Review
A number of empirical studies on the role of FDI in host countries suggest that FDI is an important source of capital, complements domestic private investment, and is usually associated with new job opportunities and enhancement of technology transfer, and boosts overall economic growth in host countries [4]. The research analyzes confirm a positive and significant relationship between FDI and the economic growth in the United States. Salehizadeh regression estimates confirm the existence of a positive and significant relationship between FDI and US economic growth rates [5].
According to the US Bureau of Labor Statistics a rapid inflow of foreign investment in the US economy paralleled the brisk productivity growth, suggesting a positive link between the growth of productivity and foreign capital. Applying a Cobb-Douglas production function to data from 1988 to 1999, it is found that foreign capital accounted for almost 16% of overall US productivity growth [6]. The regression analyses based on data from 1981 to 2007 indicate that the FDI stock in the US economy contributes 23.28% to the output growth in comparison with domestic capital contributing 19.68% [7].
The current research on new foreign investment location in the US explain at the state or county level found that economic size, labor force quality, agglomeration and urbanization economies, and transportation infrastructure affect positively the location of foreign-owned plants, while unit labor costs and taxes are found to deter new plants. In this section we present a brief overview of some related work presenting only findings of studies that analyze the locational determinants of foreign investment in the US.
Literature review indicates that there was an absence of empirical work on the location determinants of FDI across all states. The following analysis focus on the importance of FDI for economic development at the state level: Cletus, Terza and Arromdee developed a Conditional Logit Model (CLM) of the foreign firm’s US investment location decision [8]. The conditional logit model of the location decision of foreign firms investing in manufacturing facilities in the United States used annual data for the 1981-1983 periods. The study found evidence that states with higher per capita incomes, higher densities of manufacturing activity, higher unemployment rates, higher unionization rates, more extensive transportation infrastructures, larger promotional expenditures attracted relatively more foreign direct investment. In addition, higher wages and higher taxes deterred foreign direct investment.
Axarloglou and Pournarakis investigate the impact of FDI inflows on the local economies of the US states that receive most of the FDI inflows in the country [9]. It appears that FDI inflows in manufacturing have rather weak effects on local employment and wages in most of the states in the sample. However, these results are primarily due to the industry composition of the FDI. FDI inflows in Printing and Publishing, Transportation Equipment and Instruments have positive effects on local employment and wages, while FDI inflows in Leather and Stone/Clay/Glass have detrimental effects on local labor markets in most of the states in the sample. These findings indicate the importance of industry characteristics in evaluating the effects of FDI inflows on local communities. Also, they emphasize the need for US states to selectively target and attract FDI inflows in specific industries.
A study by Wijeweera, Dollery, and Clark analyzes the relationship between the corporate tax rates and foreign direct investment in the United States [10]. Chung and Alcacer examine whether and when state technical capabilities attract foreign investment in manufacturing from 1987-1993 [11]. Head, Ries, Swenson show that there do exist agglomeration effects of Japanese manufacturing firms in the United States [12].
A study by Axarloglou evaluates the relative impact of industry and state specific economic factors on inward FDI in several US states that compete for the same inward FDI [13]. The study find evidence that relative labor productivity, relative spending on education, and relative crime rate are important in inter-state competition for the same inward FDI. The findings of the study also suggest that relative tax incentives also become important in attracting FDI inflows when the contest in attracting inward FDI comes down to two states.
In another study Axarloglou evaluates the impact of industry and state specific economic conditions on inward FDI in several US states [14]. The study uses annual data for the 1974-1991 period. The results of the study suggest that FDI inflows in the US are strongly influenced by both industry and state-specific labor productivity and state spending on education. The findings of the study also suggest that the quality of the local labor force, along with the efforts to improve this quality, is pivotal in attracting FDI inflows.
Chung and Alcácer examine whether and when state technical capabilities attract foreign investment in manufacturing from 1987-1993 [15]. The study finds that on average state R&D intensity does not attract foreign direct investment. Most investing firms are in lower-tech industries and locate in low R&D intensity states, suggesting little interest in state technical capabilities. In contrast, the study finds that firms in research-intensive industries are more likely to locate in states with high R&D intensity. Foreign firms in the pharmaceutical industry value state R&D intensity the most, at a level twice that of firms in the semiconductor industry, and four times that of electronics firms. Interestingly, not only firms from technically lagging nations, but also some firms from technically leading nations are attracted to R&D intensive states.
A study by Keller and Levinson estimates the effect of changing environmental standards on patterns of international investment [16]. The study employs an 18-year panel of relative abatement costs covering the period from 1977 to 1994 and controls for unobserved state characteristics. The study finds robust evidence that abatement costs have had moderate deterrent effects on foreign direct investment.
Hines compares the distribution between US states of investment from countries that grant foreign tax credits with investment from all other countries [17]. The ability to apply foreign tax credits against home-country tax liabilities reduces an investor's incentive to avoid high-tax foreign locations. The study uses data for 1987 and finds evidence to suggest that state taxes significantly influence the pattern of foreign direct investment in the United States.
A study by Friedman, et al. examines the aggregation bias in Coughlin, Terza, and Arromdee’s study. The study finds evidence to show that marked differences exist between the locational preferences of those investing in new manufacturing plants and those investing in mergers and acquisitions [18].
A study by Hennart and Park examines the impact of location and governance factors, and of four types of strategic interactions, on a Japanese firm’s propensity to manufacture in the US [19]. The results support the view that foreign direct investment is explained by location, governance, and strategic variables. Economies of scale and trade barriers encourage Japanese FDI in the US The larger a Japanese firm’s R&D expenditures, the greater the probability it will manufacture in the US, but this is not the case for advertising expenditures. Some strategic factors are also important: Japanese firms with medium domestic market shares have the highest propensity to invest in the US There is evidence of follow-the-leader behavior between firms of rival enterprise groups, but none of “exchange-of-threat” between American and Japanese firms. Japanese investors are also attracted by concentrated and high-growth US industries.
Coughlin, Terza, and Arromdee use a conditional logit model of the location decision of foreign firms investing in manufacturing facilities in the United States using annual data for the 1981-1983 periods [20].
This study found evidence that states with higher per capita incomes, higher densities of manufacturing activity, higher unemployment rates, higher unionization rates, more extensive transportation infrastructures, larger promotional expenditures attracted relatively more foreign direct investment. In addition, higher wages and higher taxes deterred foreign direct investment.
The current study uses annual data on state-level foreign direct investment covering all 50 states over the 11-year period from 1997 to 2007. It tests the importance of several state-specific determinants of foreign direct investment.
1.2. Inward US FDI Flow vs. Inward US FDI Stock
The inward FDI flow measures the amount of FDI entering a country during a one year period, while the FDI stock is the total amount of productive capacity owned by foreigners in the host country. FDI stock grows over time and includes all retained earnings of foreign-owned firms held in cash and investments. Figure 1 examines the inward FDI flow and inward FDI stock as a percentage of GDP in the US economy. Inward FDI flow as a percentage of GDP increased sharply from 1% in 1996 to 3.25% in 2000 decreasing to 2% in 2008. The FDI flow as a percentage of GDP bottomed out in 1992 and 2002, the years following the recessionary economy. The inward US FDI stock as a percentage of GDP climbed from 2% to 6% during 1980’s and from 6% to 10% during 1990’s reaching a peak of almost 15% in 2008. The relatively high percentage of the FDI stock in GDP indicates important role of the FDI in the US economy.
Over the last two decades, the US has attracted more inflows of FDI than any other country. The economic expansion in the United States has been sustained by the willingness of foreign investors to provide capital. General indications have pointed to FDI inflows as being a positive contributing factor to the US output growth. The key factor that sustained the economic expansion

Figure 1. Inward US FDI flow vs. inward US FDI stock as a % of GDP.
during the 1980’s was the ability of the US to attract capital inflows from abroad. During the second part of the 1990s, the US experienced extraordinary inflow of FDI corresponding with exceptionally high output growth suggesting a positive link between the productivity and foreign capital inflow [21].
While the US FDI inflows has grown significantly over the past two decades, the largest part of these flows went to five states, namely, California, Texas, New York, Illinois and Ohio. These four states have been the top recipient states of FDI.
A significant research effort has been directed at establishing the determinants of foreign direct investment. However, only a very limited of studies have focused on state-specific locational determinants. The empirical literature has been limited in several respects, with most work focused exclusively on host country tax regimes.
This paper investigates locational determinants of the inward foreign direct investment among fifty states of the United States. The analysis uses annual data for the period from 1997 to 2007.
2. Model Specification
Drawing on the existing empirical literature in this area, we specify the following model:
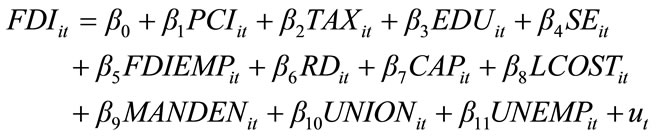 (1)
(1)
whereFDIit is the real foreign direct investment (FDI) inflows in state i in year t ( i = 1, 2, ···, 50 and t = 1, 2, ···, 11); PCIit is the per capita real disposable income of state i in year t; TAXit is the per capita state taxes of state i in year t; EDUit is the real per capita expenditure on education in state i in year t; SEit is an indicator of labor quality as measured by the share of scientists and engineers in the workforce in state i in year t; FDIEMPit is the FDI related employment in state i in year t; RDit is the real research and development (R&D) expenditure in state i in year t; CAPit is the real capital expenditure in state i in year t; LCOSTit is the unit labor cost in state i in year t; MANDENit is the manufacturing density in state i in year t; UNIONit is the share of the workforce that is unionized state i in year t; and UNEMPit is the unemployment rate in state i in year t.
The first variable, real state per capita income is a measure of market demand in a state and is expected to be related to foreign direct investment. Therefore, a priori, we would expect that b1 > 0. The real per capita state taxes usually deter FDI flows and, therefore, are expected to be negatively related to foreign direct investment; thus, we would expect that b2 < 0. Our third variable, the real per capita expenditure on education is expected to have a positive effect on foreign direct investment. Therefore, we would expect that b3 > 0.
The next variable, the share of scientists and engineers in the workforce is expected to have a positive effect on foreign direct investment. Therefore, we would expect that b4 > 0. Our fifth variable, the FDI related employment as a share of state total employment is expected to have a positive effect on foreign direct investment. Therefore, we would expect that b5 > 0. Our sixth variable, the real research and development expenditure is expected to have a positive effect on foreign direct investment. Therefore, we would expect that b6 > 0.
Our seventh variable, the real capital expenditure is expected to have a positive effect on foreign direct investment. Therefore, we would expect that b7 > 0. Our eighth variable, the unit labor cost is expected to have a negative effect on foreign direct investment. Therefore, we would expect that b8 < 0. States with higher densities of manufacturing activity is expected to attract more foreign direct investment because the foreign investors might be serving existing manufacturers. The manufacturing density could also be used as a proxy for agglomeration economies and is expected to be related positively to foreign direct investment. Therefore, we would expect that b9 > 0. The next variable, unionization of the workforce is considered to be a deterrent and therefore expected to be related negatively to foreign direct investment. Thus we would expect that b10 < 0.
The effect of unemployment on foreign direct investment could either be positive or negative. On one hand, unemployment rate reflects a pool of potential workers, thus higher unemployment rates across states will likely be related positively to foreign direct investment. On the other hand, higher unemployment rates could increase the amount that a firm must pay in unemployment insurance premiums. Thus the expected sign of b11 could either be positive or negative.
3. Data Sources and Variables
In order to test the implications of our models, we collected a panel of aggregate data on foreign direct investment on all US states, excluding the District of Columbia. The entire data set includes 50 states for which foreign direct investment and all other relevant variables are reported over the 1997-2007 period.
The data on FDI flows came from the US Department of Commerce, Bureau of Economic Analysis [21]. The real per capita disposable income is measured as the nominal per capita disposable income deflated by the GDP deflator in constant (2000) US dollars.
The real per capita taxes is measured by dividing the real state tax revenue by the state population. The nominal tax revenue for states are from various issues of the Annual Survey of State Government Finances published by the US Department of Commerce [22]. The nominal tax revenue was deflated by the GDP deflator to derive the real state tax revenue. The data on state population are from the US Census Bureau [23]. The real per capita expenditure on education is measured by dividing the real state education expenditure by the state population. The nominal education expenditure for states are from various issues of the Annual Survey of State Government Finances published by the US Department of Commerce. The nominal education expenditure was deflated by the GDP deflator to derive the real state education expenditure.
The share of scientists and engineers in the workforce, a proxy for labor quality, is collected from the National Science Foundation, Division of Science Resources Statistics, Science and Engineering Indicators 2010 [24]. The FDI related employment variable is measured as the ratio of FDI related employment to total state employment. The data on FDI related employment are collected from the Bureau of Economic Analysis while the data on state employment are collected from the US Department of Labor, Bureau of Labor Statistics [25].
The information on real research and development expenditure is collected from the National Science Foundation, Division of Science Resources Statistics, Science and Engineering Indicators 2010. Data on real capital expenditure at the state level is not readily available. Therefore, the capital expenditure on manufacturing is used as a proxy. The information on capital expenditure on manufacturing is collected from the US Census Bureau, Annual Survey of Manufactures: Geographic Area Statistics series [26].
The unit cost variable is measured following the procedure used by Axarloglou [27]. The unit labor cost is defined as:
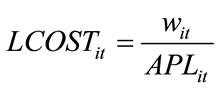 (2)
(2)
where wit is the average wage rate in state i in year t and APLit is the average product of labor in state i in year t. The average product of labor is calculated as:
 (3)
(3)
where RGSPit is the real gross state product of state i in year t and EMPit is the total employment in state i in year t. The data on the average wage and total state employment are collected from the US Department of Labor, Bureau of Labor Statistics. The manufacturing density variable is measured as the manufacturing employment per square mile of state land excluding federal land. The data on manufacturing employment are collected from the US Department of Labor, Bureau of Labor Statistics. The information on union membership is collected from http://www.unionstats. com/ maintained by Barry Hirsch and David Macpherson [28]. The data on state unemployment rate are collected from the US Department of Labor, Bureau of Labor Statistics.
4. Empirical Results
The results of our empirical analysis are presented in Table 1. In addition to the eleven independent variables included in Equation (1), we experimented with several other variables including the growth rate of real GSP, highway mileage, land area, number of airports, railway mileage, labor productivity, average hourly wage rate, real per capita exports, and right-to-work regulation. However, they were dropped from the model to minimize the problems of multicolinearity and incorrect signs. All the variables presented in Table 1 are expressed in logarithm and the coefficient of each variable can be interpreted as elasticities.
Real per capita disposable income variable has the expected positive sign but it is not statistically significant. This result is similar to the findings of studies by Coughlin,
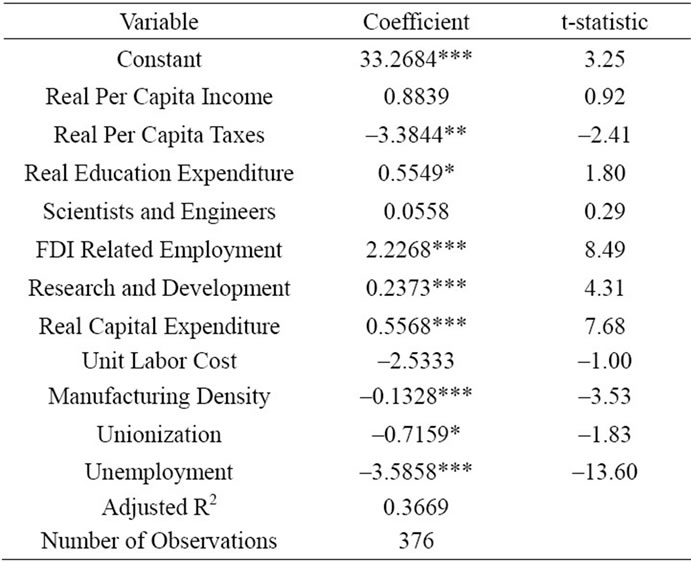
Table 1. Determinants of inward FDI flow in the United States (panel least squares estimates. Dependent variable: real FDI inflows).
Terza, and Arromdee [20] and Axarloglou [14]. The real per capita taxes also has the expected negative and it is statistically significant at the 5% level of significance. This finding is also consistent with the findings of previous studies.
The results of the study suggest that the real inflow of FDI in the US is influenced by the state spending on education. The coefficient of this variable is positive and statistically significant at the 10% level of significance. This result is consistent with the findings of the study by Axarloglou [14]. The share of scientists and engineers in the workforce has the expected positive sign but it is not statistically significant.
The FDI related employment variable has a positive and highly statistically significant effect on the real inflow of FDI. This variable is statistically significant at the 1% level of significance. This could be due to the fact that the states with high level of FDI inflows also have larger FDI related employment. The state’s expenditure on research and development is also found to have a positive effect on the real stock of FDI. This variable is statistically significant at the 1% level of significance. The real capital expenditure variable also has the expected positive sign and it is statistically significant at the 1% level of significance. This could be due to the fact that capital expenditure on manufacturing larger part of FDI flows are in the manufacturing sector.
The unit labor cost variable has the expected negative sign. However, this variable is not statistically significant. Manufacturing density variable has an unexpected negative sign but it is statistically significant at the 1% level of significance. This variable is also expected to capture the agglomeration economies.
Unionization variable has the expected negative sign and it is statistically significant at the 10% level of significance. This result is not consistent with the findings of Coughlin, Terza, and Arromdee [20], Beeson and Husted [29] and Bartik [30]. Finally, the results show that the unemployment rate is a negative, statistically significant determinant of foreign direct investment. This result is not consistent with our prior expectations. Generally, the unemployment rate is a signal of the availability of labor that affects investors.
5. Summary and Conclusions
The last economic crises negatively impacted FDI flows in 2008 and 2009 and opened a period of major uncertainty. The effectiveness of government policy responses at both the national and international levels in addressing the financial crisis and its economic aftermath will play a crucial role for creating favorable conditions for a new pickup in FDI. Public policies will obviously play a major role in the implementation of favorable conditions for a quick recovery in FDI flows. Structural reforms aimed at ensuring more stability in the world financial system, renewed commitment to an open environment for FDI, the implementation of policies aimed at favoring investment and innovation are key issues in this respect [31].
For effectively dealing with the crisis and its economic aftermath, it is important that policymakers maintain an overall favorable business and investment climate. Investment promotion agencies (IPAs) could also play a key role in fostering policies aimed at retaining existing activities by foreign companies and in implementing targeted investment promotion programs on promising activities. Investment promotion agencies play an important role in attracting FDI. In 2004, according to the United Nations Conference on Trade and Development, 160 countries had national-level IPAs. A sound rationale is driving this global trend; economists have established that investment promotion is linked with greater FDI fowls. A empirical study by the World Bank showed that greater investment promotion is associated with higher cross-border FDI flows.
This paper investigated locational determinants of the inward foreign direct investment (FDI) flows among fifty states of the United States. In order to test the implications of our models, we collected a panel of aggregate data on foreign direct investment on all US states, excluding the District of Columbia. The entire data set includes 50 states for which foreign direct investment and all other relevant variables are reported over the 1997-2007 period.
Findings of our results show that real per capita disposable income variable has the expected positive sign but it is not statistically significant. The real per capita taxes also has the expected negative sign it is statistically significant at the 5% level of significance. These findings are consistent with the findings of previous studies.
The study found, that the coefficient of the state spending on education is positive and statistically significant at the 10% level of significance. As expected, the share of scientists and engineers in the workforce has the expected positive sign. However, it is not statistically significant.
The FDI related employment variable has a positive and highly statistically significant effect on the real inflow of FDI. This could be due to the fact that the states with high level of FDI inflows also have larger FDI related employment. The state’s expenditure on research and development is also found to have a positive and significant effect on the FDI flows. This variable is statistically significant at the 1% level of significance. The real capital expenditure variable also has the expected positive sign and it is statistically significant at the 1% level of significance. This could be due to the fact that capital expenditure on manufacturing larger part of FDI flows are in the manufacturing sector.
Among other findings, the unit labor cost variable has the expected negative sign; manufacturing density variable has an unexpected negative sign but it is statistically significant at the 1% level of significance; unionization variable also has the expected negative sign and it is statistically significant at the 10% level of significance; and the unemployment rate is a negative, statistically significant determinant of foreign direct investment. Some of these findings are consistent with findings of previous studies.
Given that the current results suggest that state government taxation negatively affect foreign direct investment inflows, state governments may consider providing more fiscal incentives to foreign investors in order to attract more foreign direct invest to their states. Another way for states to attract more investment is to spend more on educations, improvements in labor quality, research and development activities and capital expenditure. This could, however, be a long term goal. While the present study used the aggregate data, another avenue of future research could be to investigate the possibility that the location determinants vary across both countries and industries.
The World Investment Report 2011 forecasts that, FDI will recover to pre-crisis levels over the next two years. Unlocking the full potential of the new developments will depend on wise policymaking and institution building by governments and international organizations. Global foreign direct investment has not yet bounced back to pre-crisis levels, though some regions show better recovery than others. The reason is risk factor, in post-crisis business environment, such as the unpredictability of global economic governance, a possible widespread debt crisis and fiscal and financial sector imbalances in the global economy.
REFERENCES
- UNCTAD, “Global Investment Trends Monitor,” Global and Regional FDI Trends in 2010, 17 January 2011, No. 5.
- G. de Prez, “The Foreign Investors,” United States Location Strategy Perspective. www.locationusa.com/UnitedStatesGovernmentAssistance/jul08/state-agenciesbusiness-investment-USA
- A. T. Kearney Foreign Direct Investment (FDI) Confidence Index, “Cautious Investors Feed a Tentative Recovery— The 2012 A. T. Kearney FDI Confidence Index,” 2012. http://www.atkearney.com/index.php/Publications/foreign-direct-investment-confidence-index.html
- A. Chowdhury and G. Mavrotas, “FDI and Growth: What Causes What?” The World Economy, Vol. 29, No. 1, 2006, pp. 9-19. doi:10.1111/j.1467-9701.2006.00755.x
- P. Asheghian, “Determinants of Economic Growth in the United States: The Role of Foreign Direct Investment,” The International Trade Journal, Vol. 18, No. 1, 2004, pp. 63- 83.
- E. Goss, J. R. Wingender Jr. and M. Torau, “The Contribution of Foreign Capital to US Productivity Growth,” Quarterly Review of Economics and Finance, Vol. 47, No. 3, July 2007. doi:10.1016/j.qref.2006.09.001
- L. Kornecki and V. Borodulin, “A Study on FDI Contribution to Output Growth in the US Economy,” Journal of US-China Public Administration, 2010, pp. 104-110. http://www.davidpublishing.com/journals_info.asp?jId=403 s
- C. C. Coughlin, J. V. Terza and V. Arromdee, “State Characteristics and the Location of Foreign Direct Investment within the United States: Minimum Chi-Square Conditional Logit Estimation. Working papers Series,” Working Paper 1987-006B/, Research Division, Federal Reserve Bank of St. Louis, 1989. http://research.stlouisfed.org/wp/1987/1987-006.pdf
- K. Axarloglou and M. Pournarakis, “Do All Foreign Direct Investment Inflows Benefit the Local Economy?” The World Economy, Vol. 30, No. 3, 2007, pp. 424-432. doi:10.1111/j.1467-9701.2006.00824.x
- A. Wijeweera, B. Dollery and D. Clark, “Corporate Tax Rates and Foreign Direct Investment in the United States,” Applied Economics, Vol. 39, No. 1, 2007, pp. 109-117. doi:10.1080/00036840500447872
- W. Chung and J. Alcácer, “Knowledge Seeking and Location Choice of Foreign Direct Investment in the United States,” Management Science, Vol. 48, No. 12, 2002, pp. 1534-1554. doi:10.1287/mnsc.48.12.1534.440
- C. K. Head, J. C. Ries and D. L. Swenson, “Agglomeration Benefits and Location Choice: Evidence from Japanese Manufacturing Investments in the United States,” Journal of International Economics, Vol. 38, No. 3-4, 1995, pp. 223-247. doi:10.1016/0022-1996(94)01351-R
- K. Axarloglou, “What Attracts Foreign Direct Investment Inflows in the United States,” The International Trade Journal, Vol. 19, No. 3, 2005, pp. 285-308. doi:10.1080/08853900591007438
- K. Axarloglou, “Local Labor Market Conditions and Foreign Direct Investment Flows in the US,” Atlantic Economic Journal, Vol. 32, No. l, 2004, pp. 62-66.
- W. Chung and J. Alcácer, “Knowledge Seeking and Location Choice of Foreign Direct Investment in the United States,” Management Science, Vol. 48, No. 12, 2002, pp. 1534-1554. doi:10.1287/mnsc.48.12.1534.440
- W. Keller and A. Levinson, “Pollution Abatement Costs and Foreign Direct Investment Inflows to US States,” The Review of Economics and Statistics, Vol. 84, No. 4, 2002, pp. 691-703. doi:10.1162/003465302760556503
- J. R. Hines Jr., “Altered States: Taxes and the Location of Foreign Direct Investment in America,” The American Economic Review, Vol. 86, No. 5, 1996, pp. 1076-1094.
- J. Friedman, H. G. Fung D. A. Gerlowski and J. Silberman, “A Note on State Characteristics and the Location of Foreign Direct Investment within the United States,” Review of Economics and Statistics, Vol. 78, No. 2, 1996, pp. 367-368. doi:10.2307/2109943
- J.-F. Hennart and Y.-R. Park, “Location, Governance, and Strategic Determinants of Japanese Manufacturing Investment in the United States,” Strategic Management Journal, Vol. 15, No. 6, 1994, pp. 419-436. doi:10.1002/smj.4250150602
- C. C. Coughlin, J. V. Terza and V. Arromdee, “States Characteristics and the Location of Foreign Direct Investment within the United States,” Review of Economics and Statistics, Vol. 73, No. 4, 1991, pp. 675-683. doi:10.2307/2109406
- The US Department of Commerce, “Bureau of Economic Analysis (BEA)”. http://www.bea.gov/
- The US Department of Commerce, “Annual Survey of State Government Finances”. https://explore.data.gov/State...Government-Finances.../Annual-Surve
- The US Census Bureau. www.census.gov/
- National Science Foundation, “Division of Science Resources Statistics, Science and Engineering Indicators,” 2010.
- The US Department of Labor, “Bureau of Labor Statistics”. www.bls.gov/
- The US Census Bureau, “Annual Survey of Manufactures: Geographic Area Statistics Series,”
- K. Axarloglou, “Local Labor Market Conditions and Foreign Direct Investment Flows in the US,” Atlantic Economic Journal, Vol. 32, No. l, 2004, pp. 62-66.
- B. T. Hirsch and D. A. Macpherson, “Union Membership and Coverage Database from the Current Population Survey: Note,” Industrial and Labor Relations Review, Vol. 56, No. 2, 2003, pp. 349-354. http://www.unionstats.com
- P. E. Beeson and S. Husted, “Patterns and Determinants of Productive Efficiency in State Manufacturing,” Journal of Regional Science, Vol. 29, No. 1, 1989, pp. 15-28. doi:10.1111/j.1467-9787.1989.tb01219.x
- T. J. Bartik, “Business Location Decisions in the United States: Estimates of the Effects of Unionization, Taxes, and Other Characteristics of States,” Journal of Business and Economics Statistics, Vol. 3, No. 1, 1985, pp. 14-22. doi:10.2307/1391685
- “Assessing Trends and Policies of Foreign Direct Investment in the United States,” US Department of Commerce, International Trade Administration, 2008. www.trade.gov/publications/pdfs/fdi2008.pdf