Int'l J. of Communications, Network and System Sciences
Vol.2 No.4(2009), Article ID:541,7 pages DOI:10.4236/ijcns.2009.24032
The Study on the Hierarchy of Internet Router-Level Topology
College of Information Science and Engineering, Northeastern University, Shenyang, China
Email: zhangjun1@ise.neu.edu.cn; zhangjun1967@sina.com
Received April 9, 2009; revised November 5, 2008; accepted February 2, 2009
Keywords: Complex Network, Hierarchy, Coreness, Power Law, Regionally, Internet
ABSTRACT
Being a huge system, Internet topology structure is very complex. It can’t be treated as a plane simply, and its hierarchy must be analyzed. We used the k-core decomposition to disentangle the hierarchical structure of Internet Router-level topology. By analyzing the router-lever Internet topology measuring data from CAIDA (The Cooperative Association for Internet Data Analysis) ,we studied the characteristics of the nodes in the inner hierarchy and outer hierarchy respectively. The frequency-degree power law of the nodes which coreness is lower and the regionally distribution of the nodes which coreness is higher were concluded. At last, the topology of every hierarchy was described by giving their figures. These descriptions can provide a valuable reference for modeling on the Internet topology.
1. Introduction
Being a classical instance of complex network, the research and modeling on Internet topology has become a hot topic at present [1–10]. It is significant for network application, development and the building of the next generation.
Although Internet is constructed by people, no one can describe what Internet looks like and how it works. The study on Internet topology is to find out some laws that exist in it but have not been known by us [11]. The research on the evolvement of the Internet macroscopic topology and its inherent mechanism is the foundation for developing and utilizing Internet.
The complexity of Internet results directly the complexity of its topology, especially for the router-level topology. Facing the millions of Internet routers, the first difficulty faced by us is how to measure them from Internet.
The Embed Laboratory of Northeastern University was authorized by CAIDA in 2005, and has been taking part in the research on the characteristics of Internet topology actively after the first node of CAIDA in China (neu node) was founded [12]. The Embed Laboratory of Northeastern University can not only get the topology measuring data from CAIDA in the world, but can also analyze the first topology information of neu node timely and dynamically. It can provide us abundant data resources and convenient conditions for researching the characteristics of Internet router-level topology. Under such background, the study on hierarchy of Internet router-level topology is carried out.
Internet has not only got LAN/WAN or AS/Router level hierarchy in traditional meaning, but also exhibits a spontaneous and multi hierarchical characteristics [13]. Based on coreness, analyzing the hierarchy of Internet, and then finding the laws among the hierarchies can not only describe the characteristics of Internet topology in detail, but can also provide a feasible thought for modeling on Internet topology.
2. The Hierarchical Measurement of Node Coreness
The node coreness that is an important measurement factor for analyzing the Internet topology is defined as follows:
Let us consider a graph G = (V, E) of |V| = n vertices and |E| = e edges; a k-core is defined as follows[14]:
Definition1 A subgraph H = (C, E|C) induced by the set  is a k-core or a core of order k iff
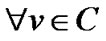 : degree H(v) ≥ k, and H is the maximum subgraph with this property [14].
A k-core of G can therefore be obtained by recursively removing all the vertices of degree less than k, until all vertices in the remaining graph have at least degree k.
Definition2 A vertex i has coreness c if it belongs to the c-core but not to (c+1)-core. We denote by ci the coreness of vertex i [14].
It is worth remarking that the coreness of a node is not equivalent to the degree of it. Indeed, a star-like subgraph formed by a vertex with a high degree that connects many vertices with degree one, and connected only with a single edge to the rest of the graph, has only got coreness one no matter how high is the degree of the vertex.
The k-core of the network and the characteristics related with it can therefore describe the network topology hierarchy. It decomposes the networks layer by layer, revealing the structure of the different hierarchies from the outmost one to the most internal one.
3. Data Access
The data used in the paper is from the router-lever Internet topology measuring data of CAIDA in May 2007. We have got the Internet topology measuring results from 15 CAIDA monitors around the world, and resolved IP aliases of them by using CAIDA iffinder IP Alias Resolution. The results show in Table 1.
In order to resolve the sampling bias, we combined the measurement results from 15 monitors in Table 1. At lastwe got a graph with 360652 nodes and 925769 edges. The biggest degree of it is 1206 and the highest coreness of it is 25.
4. The Study on the Characteristics of the Nodes’ Distribution in Every Hierarchy
According to the definition of coreness, Internet topology can be divided into different hierarchies. From higher coreness to lower coreness, the corresponding hierarchy is from inner to outer. We analyzed the routerlevel Internet topology measuring data from CAIDA in May 2007. The results showed that the distribution of node coreness was similar to that of node degree. That is the coreness of most nodes is lower, and only a few nodes have got higher coreness. The distribution on coreness of the router-level nodes satisfies power law [15]. In the following section, we will study on the distribution of the nodes’ degree and network addresses in every hierarchy respectively.
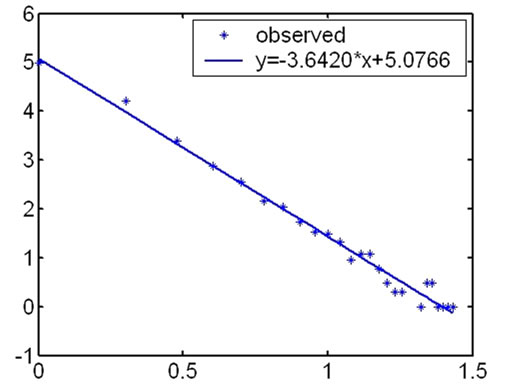
4.1. The Power Law Distribution on Degree of the Nodes in Outer Hierarchies
During our research, we first computed the degree of the nodes in every hierarchy and analyzed their distribution according to the topology measuring data from CAIDA. We found that the distribution on degree of the nodes satisfied power law in outer hierarchies. The fitness
 (a)
(a) 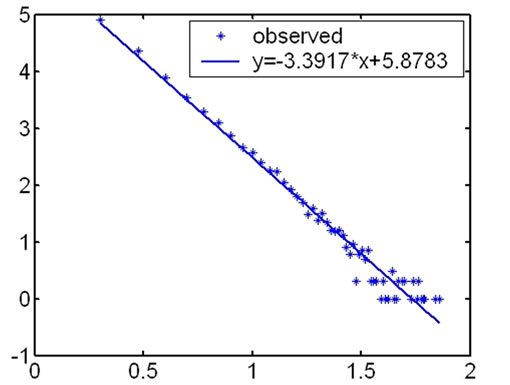 (b)
(b)  (c)
(c)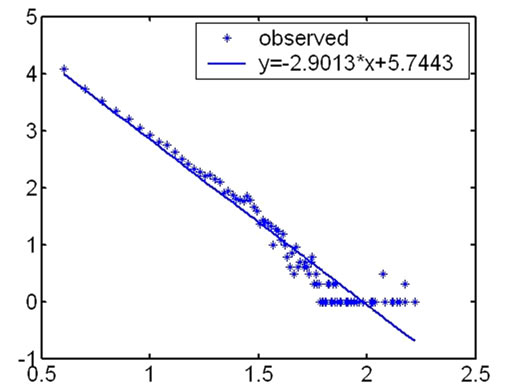 (d)
(d) 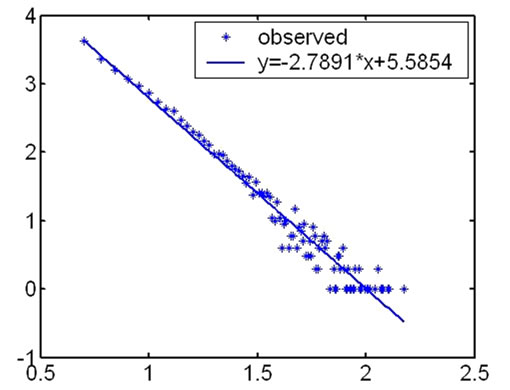 (e)
(e) 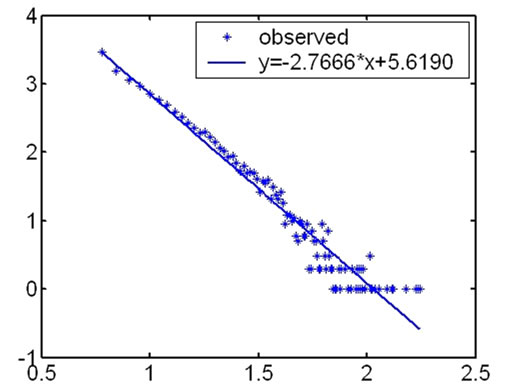 (f)
(f)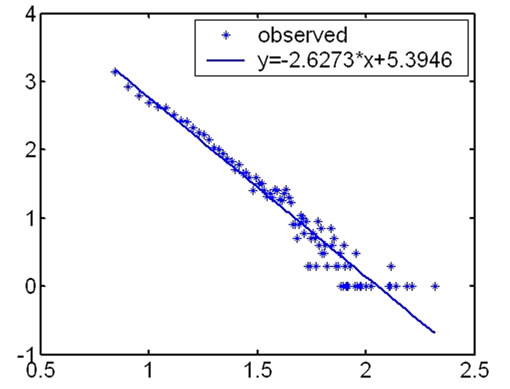 (g)
(g) 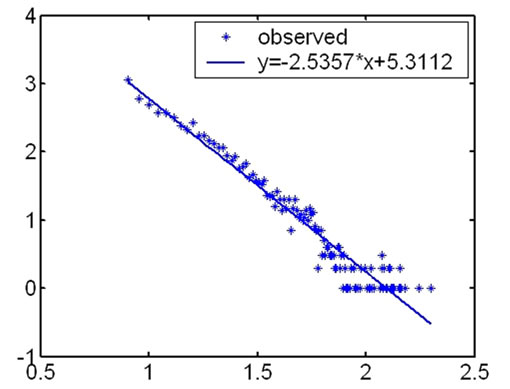 (h)
(h) 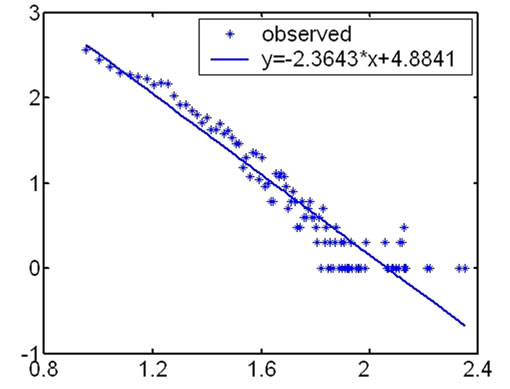 (i)
(i)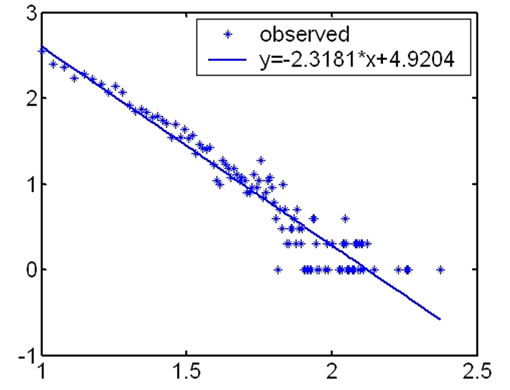 (j)
(j) 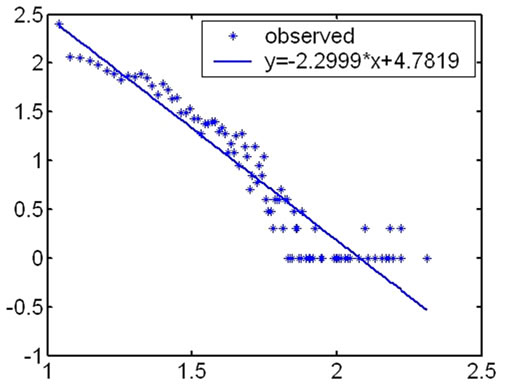 (k)
(k) 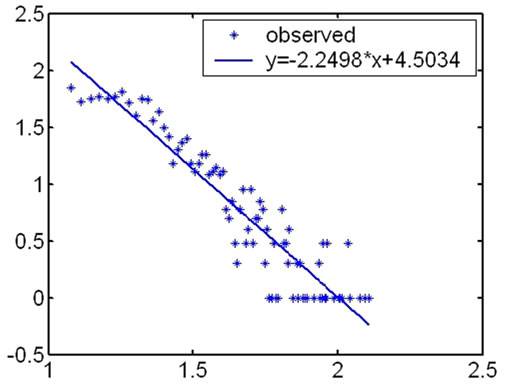 (l)
(l)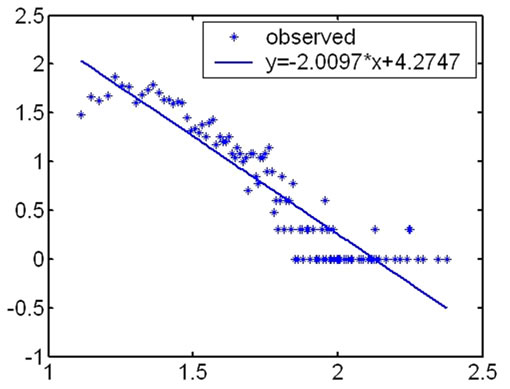 (m)
(m) 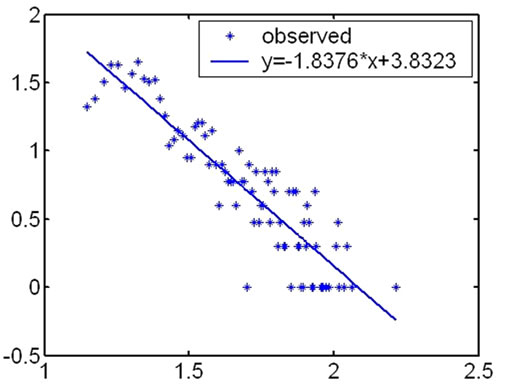 (n)
(n)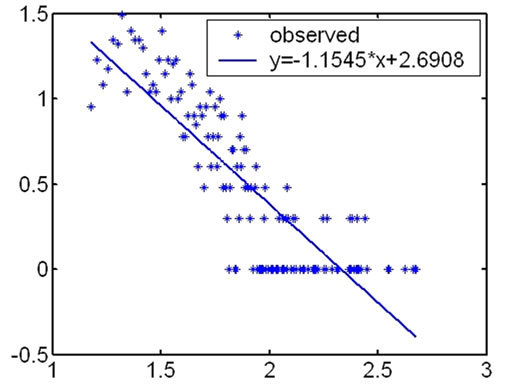 (o)
(o)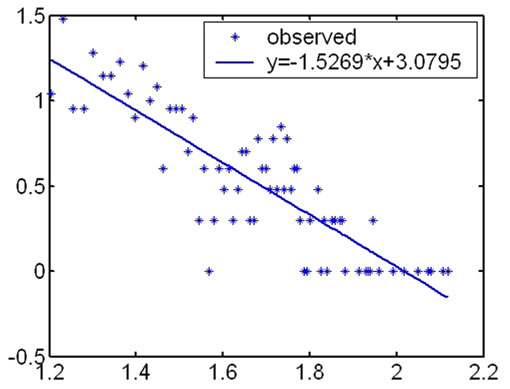 (p)
(p)
Figure 1. The fitness figures of the degree distribution in different hierarchies.
results under the logarithm coordinate are showed as Figure 1.
The highest coreness of the measurement results in May 2007 is 25, so Internet topology is divided into 25 hierarchies. The distribution on degree of the nodes satisfies power law in outer hierarchies. From outer to inner, the fitness results of the degree distribution become fainter and fainter. And for inner hierarchies, this characteristic is no more satisfied.
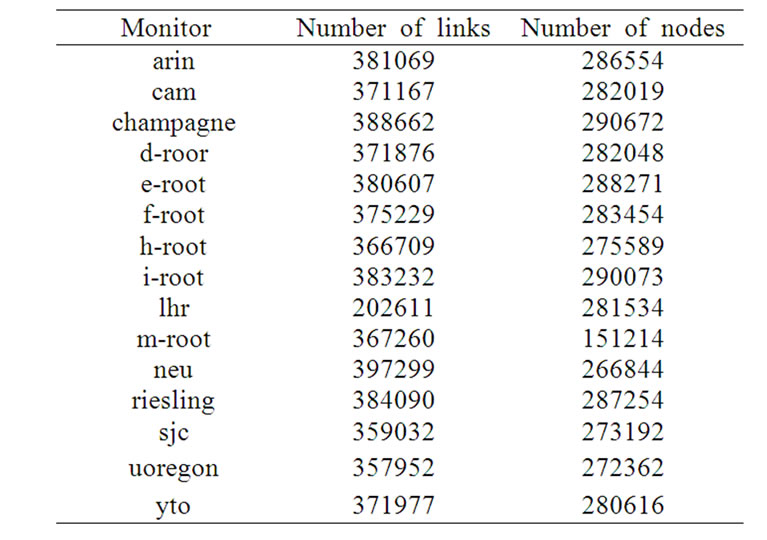
Table 1. The monitors and their measurement results in May 2007.
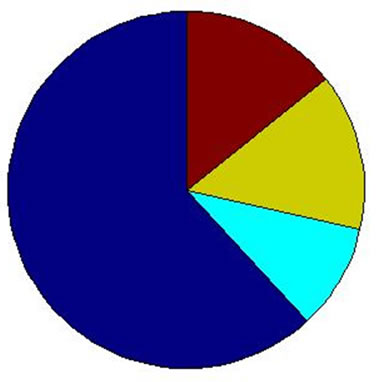
4.2. The Regionally Distribution of the Nodes inInner Hierarchies
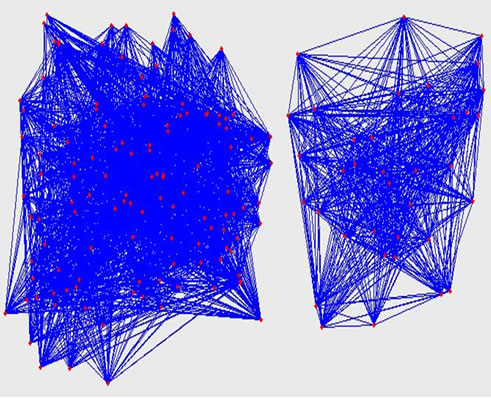
Now we study the characteristics of the nodes in inner hierarchies. By analyzing the distribution of the network addresses in every hierarchy, we find that the nodes in the innermost hierarchy distribute on only a few network addresses. From inner hierarchy to outer hierarchy, the network addresses of the nodes spread more and more expanded (see Figure 2). We can see from Figure 2 that the network addresses of the nodes in outer hierarchies spread expanded, but for the nodes that are in inner hierarchies, their distribution is concentrated.
We can see that the distribution of the network addresses of the nodes in inner hierarchies is concentrated. The higher is the node coreness, the more evident is the concentration. At last they concentrate on only a few
 (a)
(a)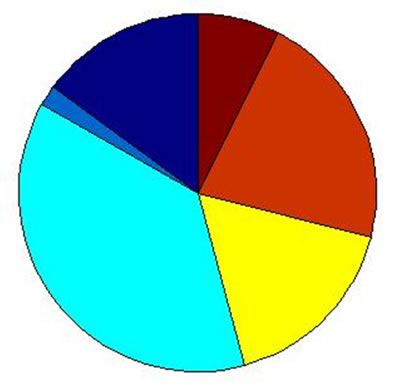 (b)
(b)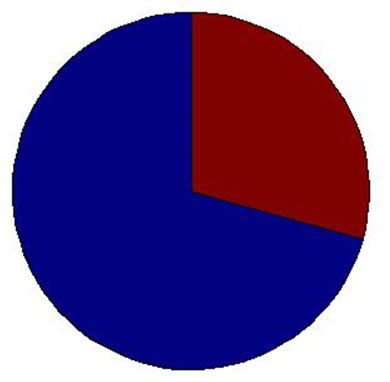 (c)
(c)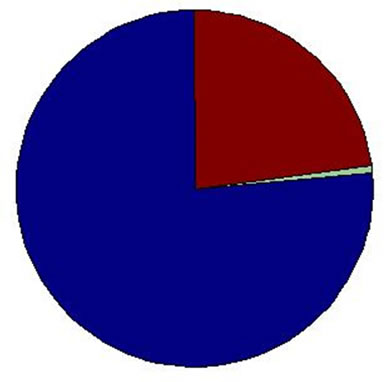 (d)
(d)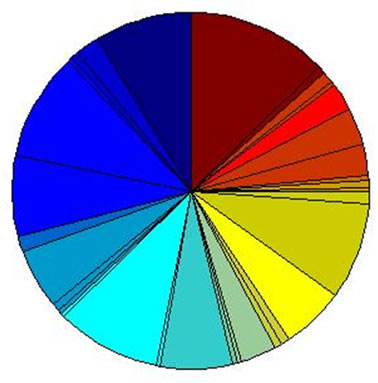 (e)
(e)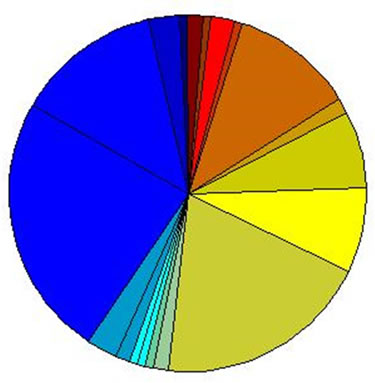 (f)
(f)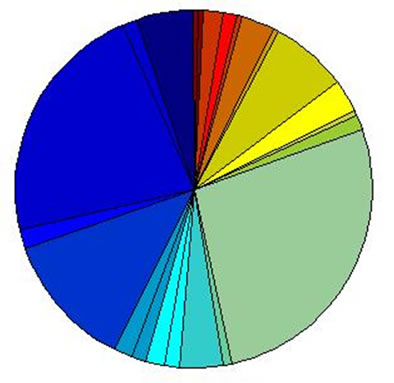 (g)
(g)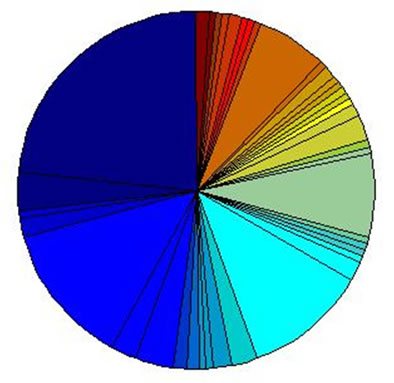 (h)
(h)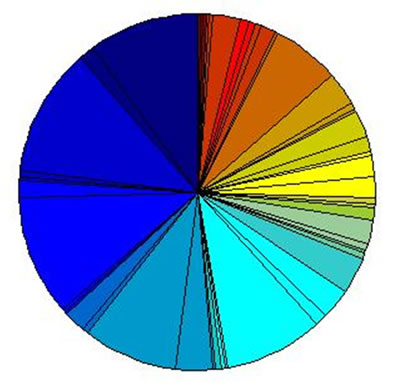 (i)
(i)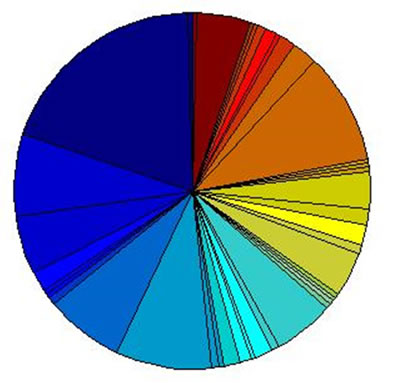 (j)
(j)
Figure 2. The network addresses of the nodes in hierarchy 25~16.
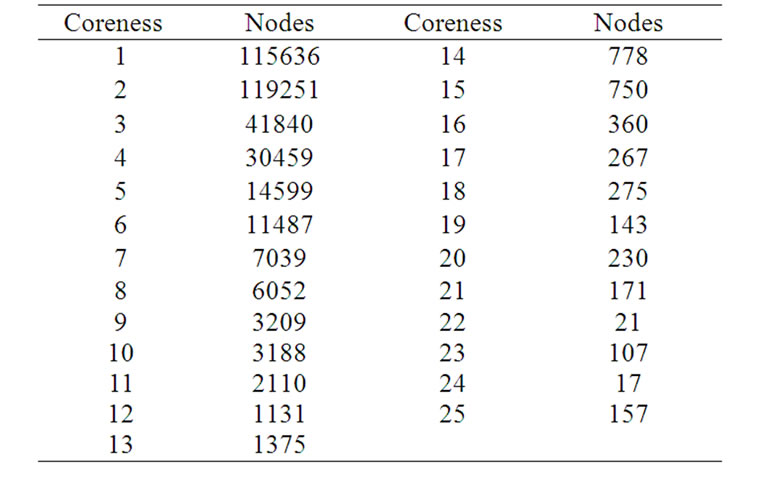
Table 2. The number of the nodes in every hierarchy.
addresses in the innermost hierarchy. Is the phenomenon related to the number of the nodes in every hierarchy? So we compute the number of nodes in every hierarchy, see Table 2. We found that the number of the nodes decreased with the increment of the coreness in the whole. From lower coreness to higher coreness, the number of the nodes becomes fewer and fewer. But when it reaches the highest coreness, the number of the nodes appears a rebound, remains a certain amount. So we can find that the distribution of the network addresses of the nodes is related with the number of the nodes, but they are not increased with direct proportion. For example, the number of the nodes in hierarchy 25 is more than that in hierarchy 23 and 22, but the distribution of the network addresses in hierarchy 25 is more concentrated than that in hierarchy 23 and 22.
Summarily, from inner hierarchy to outer hierarchy, the nodes distribute from the highest coreness to the lowest. In the innermost hierarchy, the nodes distribute on a few network addresses. From inner to outer, the distribution of the network addresses becomes more and more expanded, and the frequency-degree power law is increasingly finer. To the outmost hierarchy, the distribution of the network addresses is the widest and the power law is the finest.
5. The Visual Description of Internet Topology in Every Hierarchy
The visual description of Internet topology has been being the hot problem for studying on Internet for a long time [16]. How to construct a better topology figure is difficult because of the numerousness of the router-level nodes. In this section, we will describe it in every hierarchy (see Figure 3).
We can see from Figure 3 that the relationship among the nodes is closer in the innermost hierarchy, that is the highest coreness. All the nodes construct two connected figures. From inner to outer, the relationship becomes looser. In hierarchy 24, although the number of the nodes is fewer, the relationship among them is looser. There are two connected figures and several isolated nodes. These isolated nodes have 24 connections with the nodes in the innermost hierarchy. In hierarchy 23, all the nodes are divided into several irrelative figures and some isolated
 (a)
(a)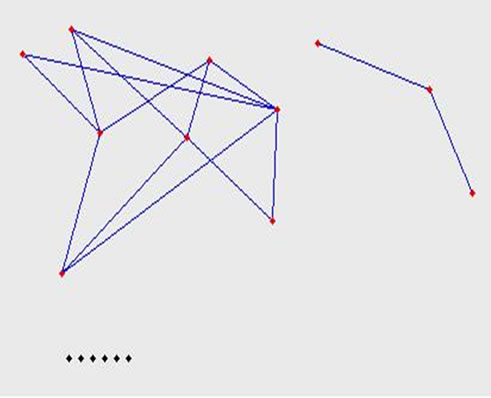 (b)
(b)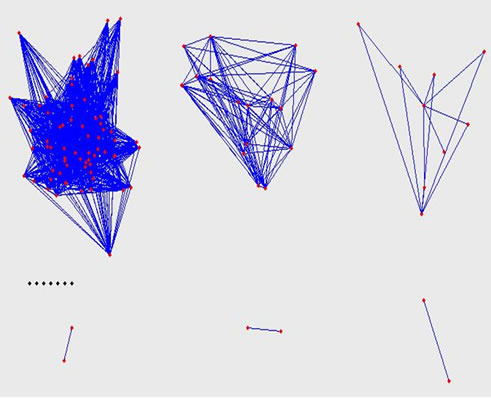 (c)
(c)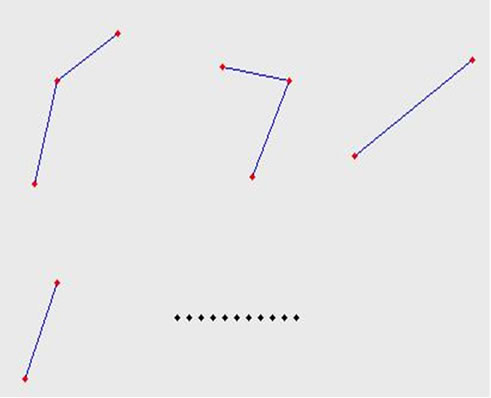 (d)
(d)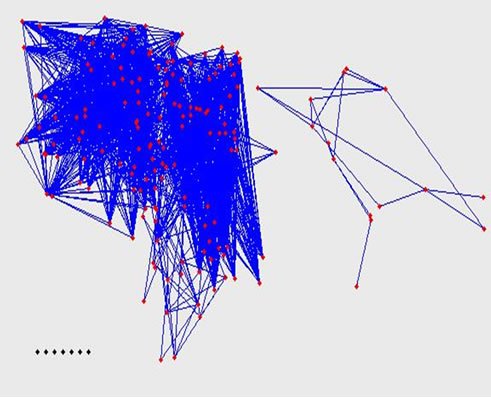 (e)
(e)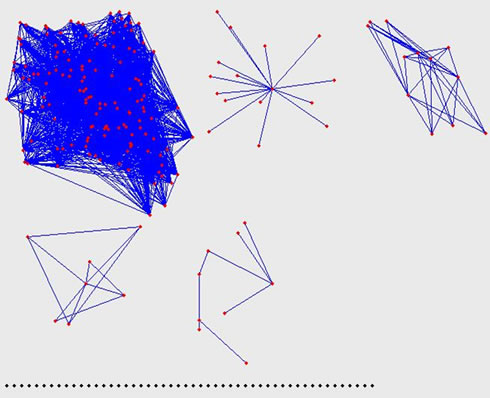 (f)
(f)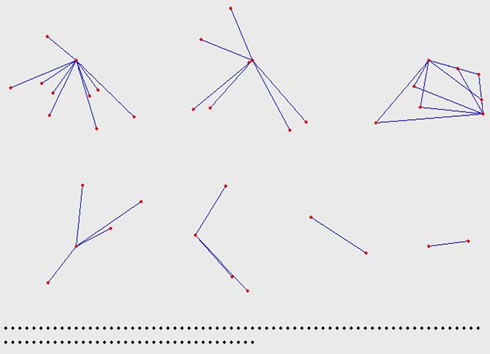 (g)
(g)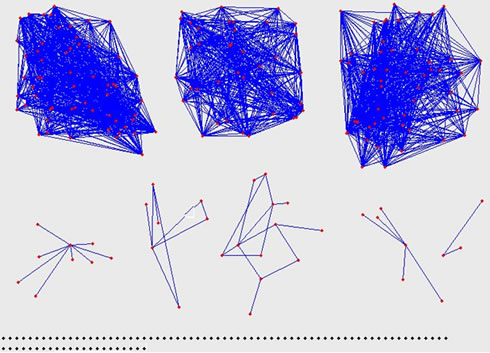 (h)
(h) 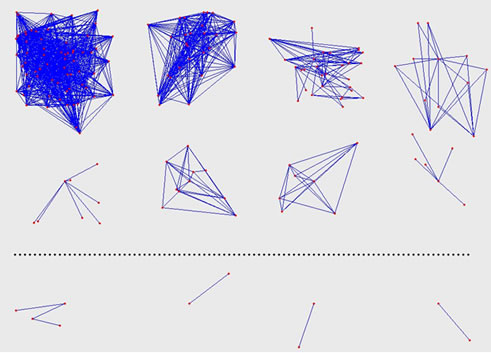 (i)
(i)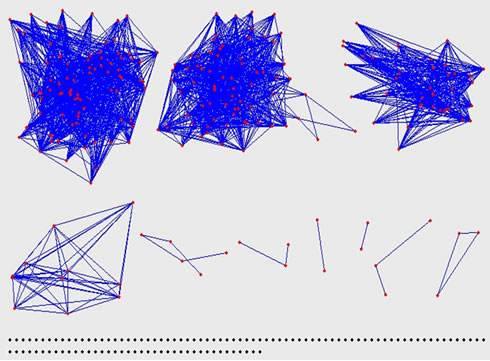 (j)
(j)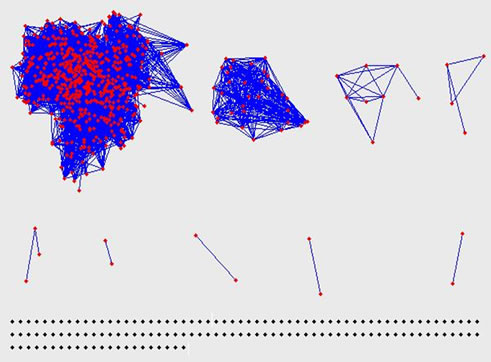 (k)
(k)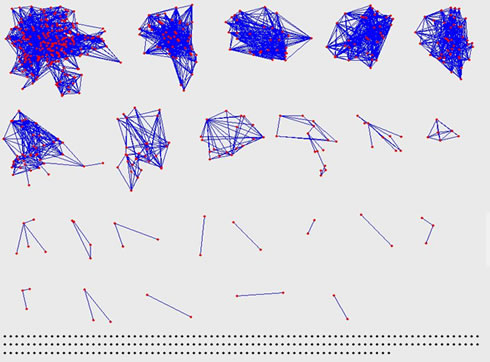 (l)
(l)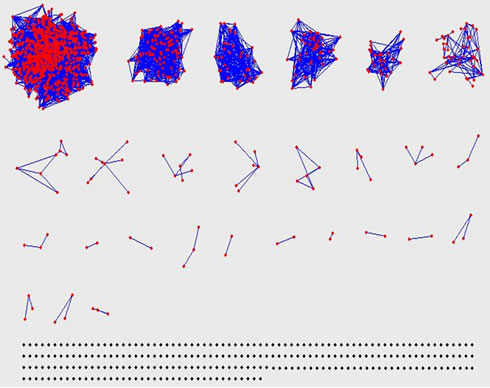 (m)
(m)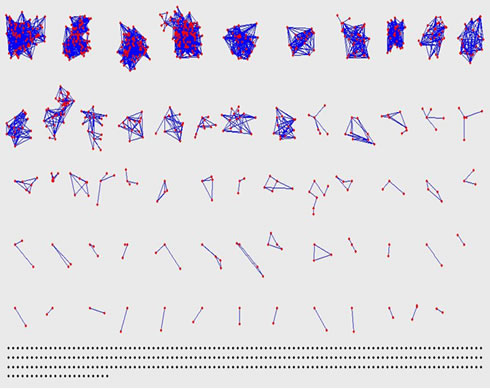 (n)
(n)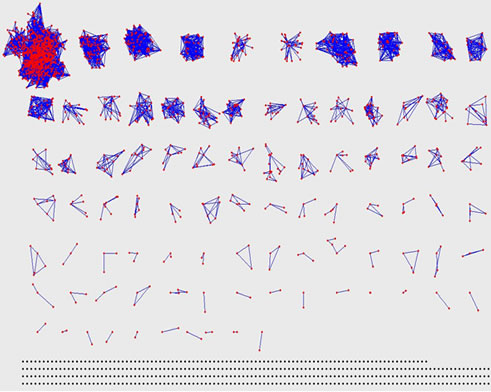 (o)
(o) (p)
(p)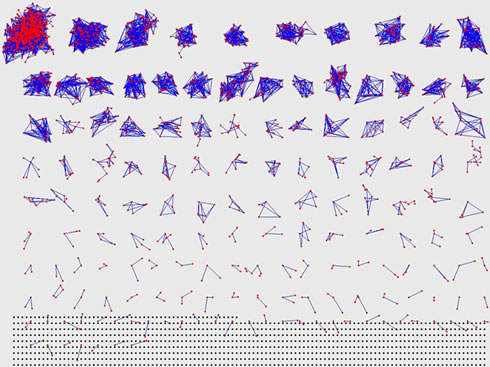 (q)
(q)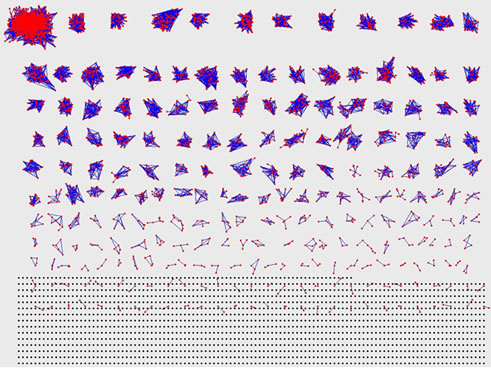 (r)
(r)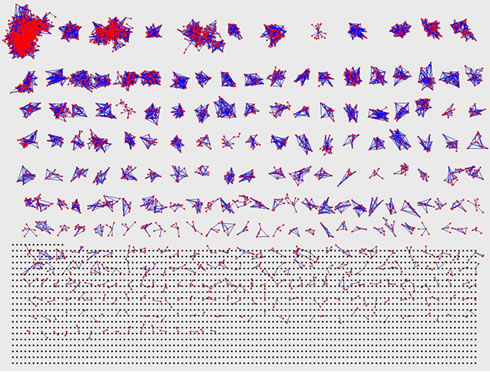 (s)
(s) 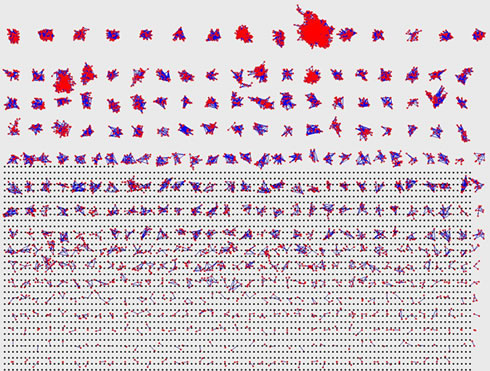 (t)
(t)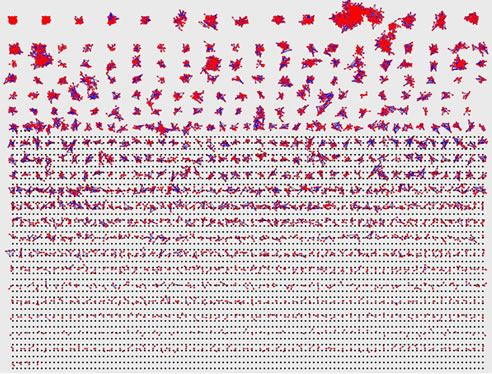 (u)
(u)
Figure 3. The topology figures of hierarchy 25~5.
nodes that have 23 connections with the nodes in the inner hierarchies. From that to outer, the irrelative connected figures become more and more, and the isolated nodes which have k connections with the nodes in the inner hierarchies are also more and more. This illustrates that the connections among the nodes in the same hierarchy is smaller, and most connections appear between the hierarchies. Combined with the conclusion that we have got in section 4.2, we find that the nodes in the same network area are prone to connect with each other.
6. Conclusions
The hierarchy of Internet router-level topology is analyzed in the paper. Combining with the actual topology measuring data, we described the characteristics of the hierarchy of Internet router-level topology. We first used the concept of coreness to decompose Internet topology into different hierarchies. Then studied the characteristics of the nodes in inner hierarchies and outer hierarchies respectively. We found that the distribution on degree of the nodes in outer hierarchies satisfied power law. The lower the node coreness is, the better the fitness is. On the other hand, although the number of the nodes in the innermost hierarchy is over hundred, they do not distribute in different areas. On the contrary, they concentrate on only a few network addresses. At last, we described the topology of every hierarchy by giving their figures, and we found that the nodes in the same network area were prone to connect with each other. These descriptions can provide a valuable reference for modeling on Internet topology.
7. References
[1] X. F. Wang, X. Li, and G. R. Chen, “The theory and application of complex network,” TsingHua University Press, Beijing, 2006.
[2] D. Magoni and J. J. Pansiot, “Internet topology modeler based on map sampling,” Proceedings of the ISCC 2002, Taormina, IEEE, pp. 1021-1027, 2002.
[3] J. Winick and S. Jamin., “Inet-3.0: Internet topology generator,” Technical Report, CSE-TR-456-02, Ann Arbor: University of Michigan, 2002.
[4] D. Magoni, “A software for network topology analysis and modeling,” Proceedings of the MASCOTS 2002. IEEE Computer Society, pp. 364-371, 2002.
[5] S. Zhouu and R. J. Mondragon, “Accurately modeling the Internet topology,” Physical Review Letters, Vol. 70, pp. 106-108, 2004.
[6] S. Zhouu and R J. Mondragon, “Towards modeling the Internet topology-the interactive growth model,” Teletraffic science and engineering, Vol. 5, pp. 121-130, 2003.
[7] S. Zhouu and R J. Mondragon, “The rich-club phenomenon in the Internet topology,” IEEE Communication Letters, Vol.8, No.3, pp. 180-182, 2004.
[8] S. T. Park, D. M. Pennock, and C. L. Giles, “Comparing static and dynamic measurements and models of the Internet’s topology,” Proceedings of the 23rd Annual Joint Conference of the IEEE Computer and Communications Societies, pp. 1616-1627, March 2004.
[9] G. Chen, Z. P. Fan, and X. Li, “Modeling the complex Internet topology,” Complex Dynamics in Communication Networks, G. Vattay, L. Kocarev (Eds), Berlin, Springer-Verlag, 2005.
[10] D. Vukadinovic, P. Huang, and T. Erlebach, “On the spectrum and structure of Internet topology graphs,” Proceedings of the Innovative Internet Computing Systems (I2CS), LNCS 2346, Berlin, Springer-Verlag, pp. 83-95, 2002.
[11] Y. Zhang, H. L. Zhang, and B. X. Fang, “A survey on internet topology modeling”, Journal of Software, Vol. 15, pp. 1220-1226, 2004.
[12] Macroscopic Topology Measurements, CAIDA. http:// www.caida.org/analysis/topology/macroscopic/
[13] K. Calvert, M. Doar, and E. Zegura, “Modeling Internet topology”, IEEE Communication Magazine, Vol. 35, pp. 160-163, 1997.
[14] J. I. Alvarez-Hamelin, et al., “k-core decomposition: A tool for the visualization of large scale networks,” Arxiv preprint cs. NI/0504107, 2005
[15] J. Zhang, H. Zhao, and Y. Zhou, “Relationship between degree and core number of Internet nodes at router level,” Journal of Northeastern University (Natural Science), Vol. 29, No.5, pp. 653-656, 2008.
[16] B. Cheswick, H. Burch, and S. Branigan, “Mapping and visualizing the Internet,” in Proceedings of the 2000 USENIX Ann Technical Conference, San Diego, California, USA, June 2000.