Journal of Environmental Protection
Vol.5 No.10(2014), Article ID:48128,10 pages
DOI:10.4236/jep.2014.510086
Numerical Experiments on Indoor Air Quality Considering Infiltration of Mould from Crawl Space
Motoya Hayashi1, Haruki Osawa2, Kenichi Hasegawa3, Yoshinori Honma4
1Miyagigakuin Wemen’s University, Sendai, Japan
2National Institute of Public Health, Wako, Japan
3Akita Prefectural University, Yurihonjo, Japan
4Iwate Prefectural University, Morioka, Japan
Email: mhns01234@aol.com
Copyright © 2014 by authors and Scientific Research Publishing Inc.
This work is licensed under the Creative Commons Attribution International License (CC BY).
http://creativecommons.org/licenses/by/4.0/


Received 18 May 2014; revised 13 June 2014; accepted 5 July 2014
Abstract
How the air quality of crawl space influences the indoor air quality is investigated using a simulation program “Fresh 2010”, air leakage network models, and the measurement results on the mould concentrations in crawl spaces of detached houses. The annual changes of indoor mould concentrations were calculated using building models (a common wooden post-and-beam structure, improved wooden post-and-beam structure, wooden stud structure). In every structure, the concentrations in the case of exhaust ventilation system are higher than those of exhaust and supply ventilation system. The results show that it is necessary to control the air quality of crawl spaces and the infiltration from crawl spaces in order to keep indoor air quality good.
Keywords:Biological Pollutant, Filtration, Mould, Ventilation, Air Leakage

1. Introduction
Influences of infiltration from concealed spaces, crawl spaces, ceiling spaces and wall cavities upon indoor chemical concentrations have been investigated [1] -[4] . Some countermeasures against infiltration of chemical compounds were proposed in the investigation and they were adopted in the Japanese Building Law in 2003. The investigation has been continued after 2003 with experiments of test structures, measurements in real houses and simulations. These results showed that an airtight method at the bottom and the top of walls has some effect, but that the main factor of the indoor concentrations of chemical compounds from these concealed spaces is the steady pressure difference between indoor space and outdoor space. The steady pressure difference is made by mechanical ventilation systems [5] .
The ambient concentration of mould is high from spring to autumn in Japan. And the indoor concentration basically changes with ambient concentration. Mould exists not only outside but also in indoor space. The indoor mould exists on interior surface and in concealed spaces as shown in Figure 1. The authors have focused on the influence of mould in crawl spaces. Temperatures are lower in crawl spaces from spring to summer than those of the ambient air and the room air. Therefore the humidity is high in crawl spaces and a good environment for mould growth is kept in these seasons. In order to keep dry, the crawl spaces have to be open to outside. Therefore mould concentrations in crawl spaces depend not only on the mould in crawl spaces but also on an ambient concentration.
In the former studies, the authors investigated the mould infiltration from crawl spaces. The results of experiments using test houses showed that the spore of mould infiltrates from crawl spaces to indoor spaces through an airflow route around a bath unit and other many leakages [6] -[8] .
In this study, influences of infiltration from crawl spaces upon indoor concentrations were investigated using measured concentrations in crawl spaces [9] , air leakage network models [10] and a simulation program “Fresh 2010” [11] .
2. Methods
The mould concentrations were measured in crawl spaces of houses (Table 1) in Akita Prefecture through the year. The houses (A-F) were built with an improved wooden post-and-beam structure or wooden stud structure from 1999 to 2003. The houses were insulated and airtight according to the latest building code for energy saving in Japan. Therefore the total equivalent leakage areas per its floor area are less than 5.0 cm2/m2. The mechanical ventilation systems were used in these houses, and insulation materials were installed under the floor. Crawl spaces were ventilated through openings around the crawl spaces.
Figure 2 shows the measured mould concentrations in crawl spaces. Moulds were sampled from the air at the center of the space, using an air sampler (Merck MAS-100). The moulds were cultivated on the medium and the numbers of moulds were counted. These results showed that the concentrations increased in summer with the ambient concentration. The annual change was shown in many researches in Japan. In most houses in Japan, the indoor temperature and humidity change with the ambient temperature and humidity. Therefore, the indoor
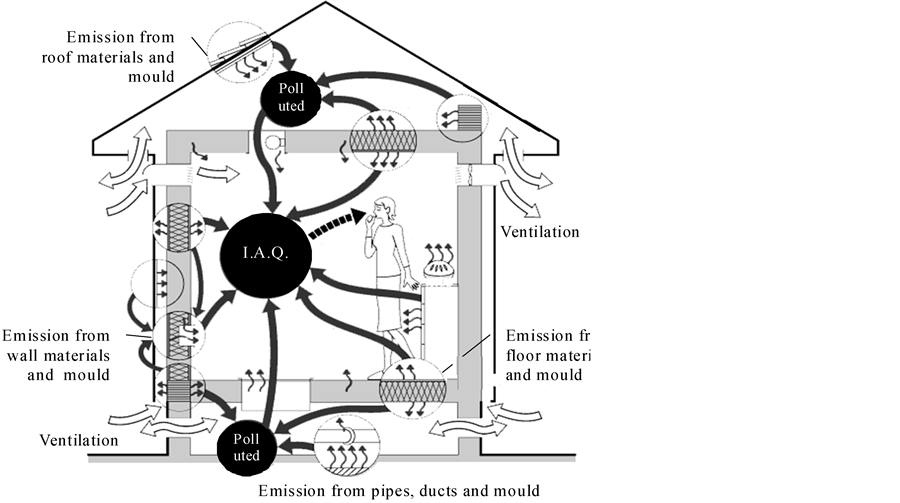
Figure 1. Influence of concealed pollution source upon I.A.Q.
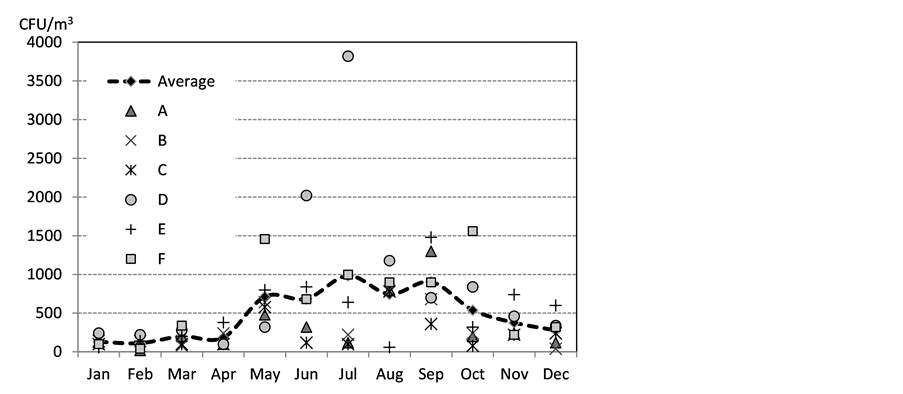
Figure 2. Measured mould concentrations in crawl spaces.

Table 1. Houses where the mould concentrations were measured in the crawl spaces.
mould concentrations in general depend on ambient temperature and humidity. But in some cases, the concentration of crawl space was the highest of all the indoor and outdoor concentrations. The temperature in crawl space is lower than the ambient temperature from spring to summer. The humidity became very high in these seasons. Therefore mould concentration became very high.
Figure 3 shows annual change of measured concentrations and a model approximated to a sine wave using a least-square method. An equation of the annual change of mould concentrations in crawl space is as follows.
 (1)
(1)
where Cm_CS(T) is the concentration of mould in crawl space, Cav is the average of mould concentration in crawl space in a year (=487), Camp is the amplitude of mould concentration in crawl space in a year (=400), T: time (a year = 1.0), and φ: phase of time (=0.125).
Air leakage network models were used in simulations. The network models were made using building cut models in the former investigations. Figure 4 shows the cut model of common wooden post-and-beam structure.
Figure 5-7 show the equivalent leakage areas per depth of 1m in three structures: a common wooden postand-beam structure, an improved wooden post-and-beam structure built according to the latest building insula-
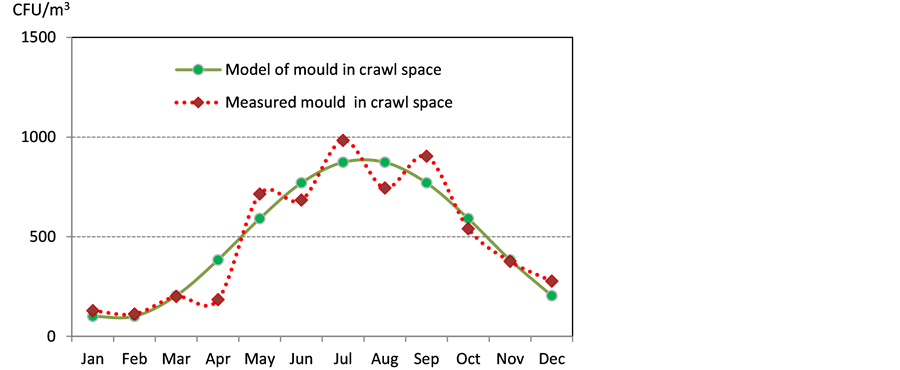
Figure 3. Model of annual change of mould concentration in a crawl space.
Figure 4. A cut model of improved wooden post-and-beam structure.
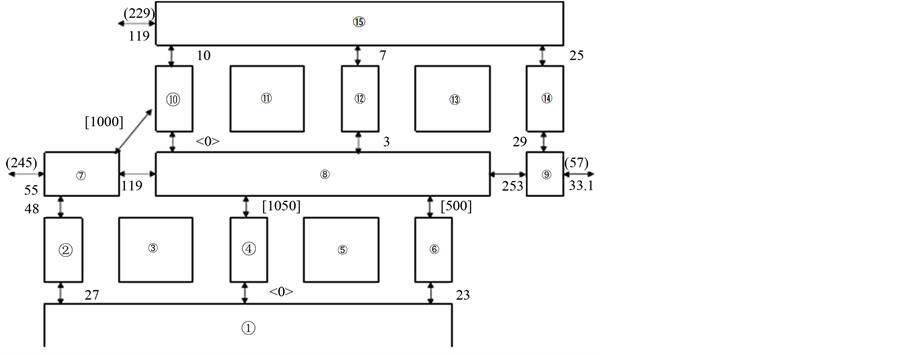
Figure 5. Leakage network of a common wooden post-and beam structure (cm2/m).

Figure 6. Leakage network of an improved.

Figure 7. Leakage network of a wooden (2 × 4) wooden post-and-beam structure (cm2/m) stud structure (cm2/m).
tion code and a wooden (2 inch × 4 inch) stud structure built according to the latest building insulation code. This code was established in 1999. Leakage areas in concealed spaces and the leakage areas between concealed spaces and indoor spaces were measured using mass-flow controllers and pressure analyzers.
Next, the movements of pollutants were calculated using a simulation program. The program simulates the temperatures, the air flow rates, the concentrations using the NHK standard living schedule model [12] and the HASP weather data on Tokyo.
The thermal loads by human behaviors such as cooking, watching television and cleaning rooms, are calculated from the daily schedule model of a family. The air-conditioner and the windows are operated to make indoor climate comfortable considering the daily schedule of a family. The air-conditioning systems and the windows are controlled as follows: the room temperatures are controlled to be 22˚C using heaters. If the room temperature becomes higher than 26˚C, the dwellers try to make the room temperature at 26˚C by opening or closing windows. These operations are done by dwellers in a room where they are, and when they are not sleeping.
Figure 8 shows the model of a house for simulation. The house is a two storied house and the same type of houses are connected on the east and west side. The width of the house is 8 m. It is easy to show air flow vectors in the house as shown in Figure 9.
The total equivalent leakage areas of the three structures were measured using this simulation program. A large fan was set and the inside air was exhausted. The airflow rates are controlled to be five ranks of airflow rate and the pressure difference of each rank was calculated. The equivalent leakage areas were calculated. The

Figure 8. Section of building model for simulations.
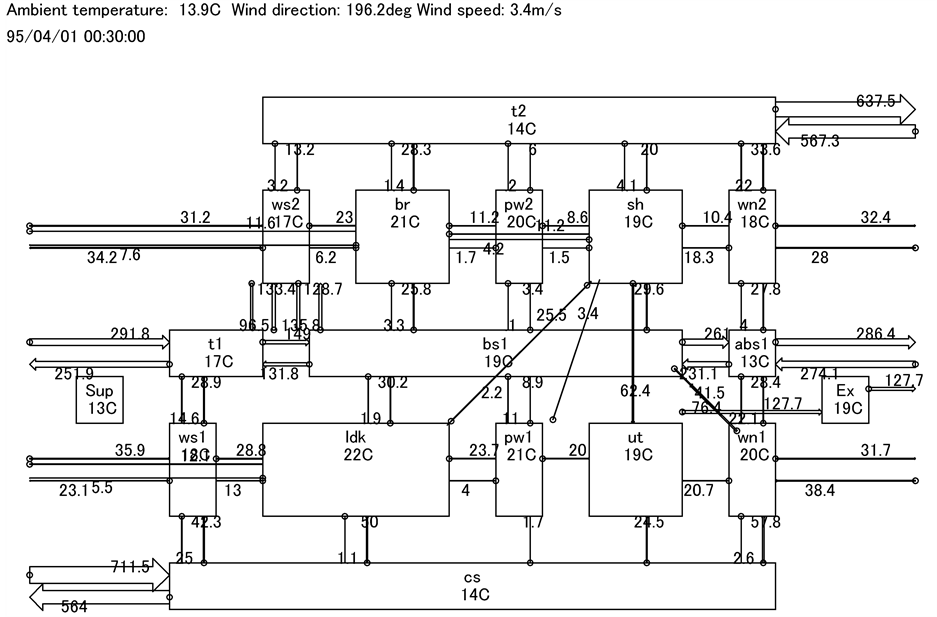
Figure 9. Airflow rates and temperatures in a common wooden post-and-beam structure with an exhaust ventilation system.
equivalent leakage area per its floor area of the model with a common wooden structure was 5.0 cm2/m2, that of an improved post-and-beam structure was 2.8 cm2/m2 and that of a wooden (2 inch × 4 inch) stud structure was 0.3 cm2/m2.
3. Results
Figure 9 shows the airflow rates and temperatures at 0:30 a.m. on April 1, in a common wooden structure with an exhaust ventilation system. The air infiltrates from crawl space to indoor spaces on the first floor. The air infiltrates also to indoor space on the second floor through walls (ws1, pw1, wn1, ws2, pw2, wn), beam spaces (bs1, abs1) and truss spaces (t1, t2). The basic airflow from crawl space to indoor spaces is caused by an effect of decompression with an exhaust ventilation system. Another basic airflow from low spaces to high spaces is caused by a stack effect. The stack effect depends on the temperature difference between indoor air and outdoor air. Under these influences of two effects, several routes from crawl spaces to indoor spaces are shown in this figure.
Figure 10 shows the case of an exhaust and supply ventilation system. Several routes routs from crawl space to indoor space are also recognized in this case. However the air flow rate from truss space (t2) to the indoor space on the second floor is not large. In the case of a bedroom on the second floor, the rate is zero because the air is compressed by air supply. Also in the case of a living dining kitchen (ldk) on the first floor, the effect of air supply is thought to be expected. However the pressure difference caused by the temperature difference between outdoor air and indoor air weakens this effect. That reduction of effect is remarkable particularly in the case of low airtight structures.
The airflow rates through the above routes became lower in the airtight structures: an improved wooden postand-beam structure and a wooden (2 inch × 4 inch) stud structure. The effect of air supply is more remarkable in the case of these high airtight structures.
Figure 11 shows the calculated monthly average concentrations in a common wooden post-and-beam structure with an exhaust ventilation system. In winter, spring and autumn, the concentration of ldk is very close to that of crawl space because the air infiltrates from crawl spaces to indoor spaces with the influence of decompression by an exhaust ventilation system and the pressure difference by a stuck effect. The concentration in ldk increased from winter to early summer. The concentration decreased in summer because the windows were opened. The concentration increased in autumn again and decreased in winter. The same change is recognized in the case of concentrations of a utility (ut) and that of a bedroom (br). These results show that mould infiltrates from crawl spaces to rooms not only on the first floor but also on the second floor through concealed spaces and indoor spaces through the year.
Figure 12 shows the change of mould concentrations in a common wooden post-and-beam structure with an exhaust and supply ventilation system. The annual change similar to the case of an exhaust ventilation system,
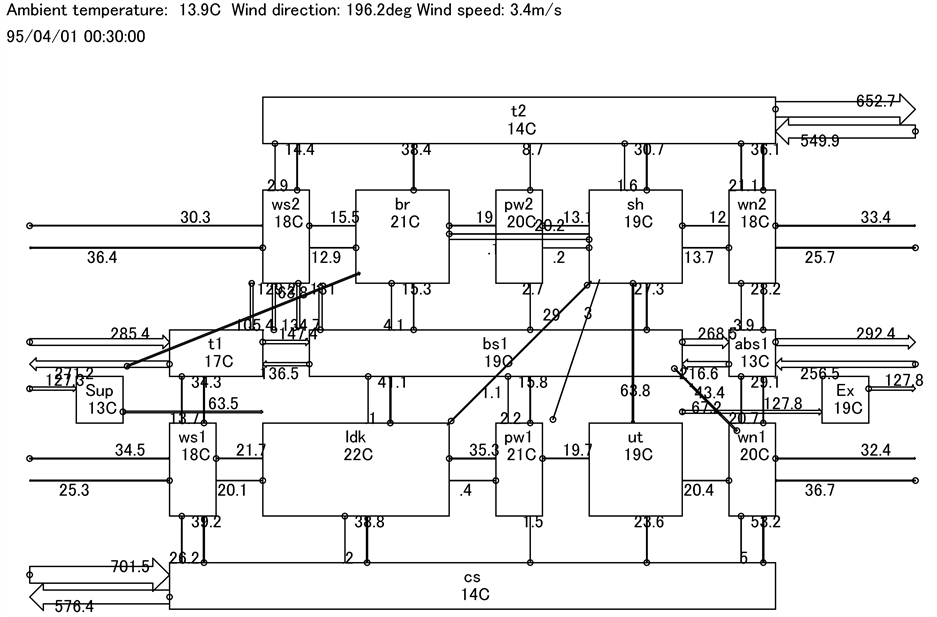
Figure 10. Airflow rates and temperatures in a common wooden post-and-beam structure with an exhaust and supply ventilation system.
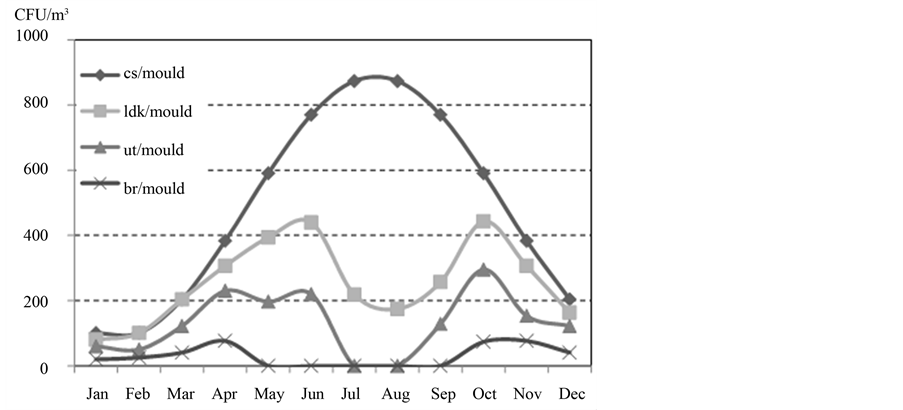
Figure 11. Concentrations in a common wooden post-and-beam structure with an exhaust ventilation system.
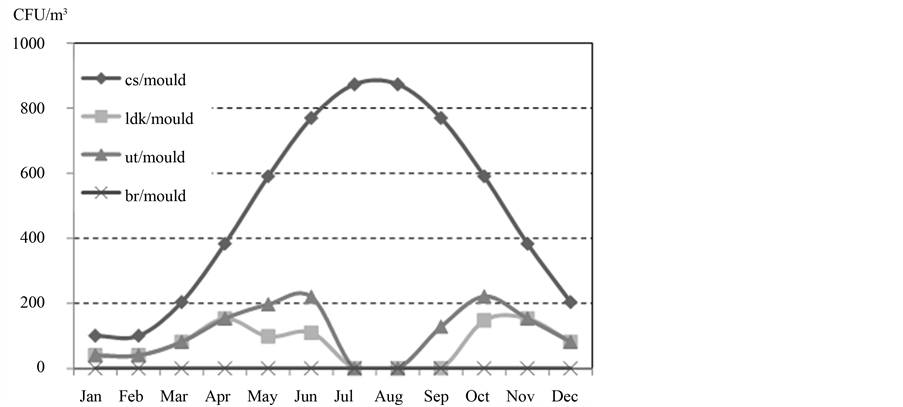
Figure 12. Concentrations in a common wooden post-and-beam structure with an exhaust and supply ventilation system.
was recognized in the case of ut and ldk on the first floor. However the concentration of br (bedroom on the second floor) was continuously zero and not similar to the case of exhaust only ventilation system. The mould does not infiltrate to the bedroom (br) on the second floor from the crawl space, because the room is compressed by air supply.
Figure 13 shows annual average concentrations. In every structure, the concentrations with an exhaust ventilation system are higher than those of an exhaust and supply ventilation system. In the case of airtight structures (an improved wooden post-and-beam structure and a wooden (2 inch × 4 inch) stud structure), the concentration with an exhaust and supply ventilation system are very low. These differences between the exhaust only and the exhaust and supply, are remarkable in the case of airtight structures. Although the equivalent leakages of a wooden (2 × 4) stud structure are smaller than those of an improved wooden post-and-beam structure, the concentrations of a wooden (2 × 4) stud structure are higher than those of an improved wooden post-and-beam structure. This tendency is recognized in both of ventilation types. Basically the higher an airtight performance is, the lower an indoor concentration becomes. On the other hand, the concentration is higher in some cases in airtight structure because the indoor space is more decompressed. In these cases, air and mould infiltrate from
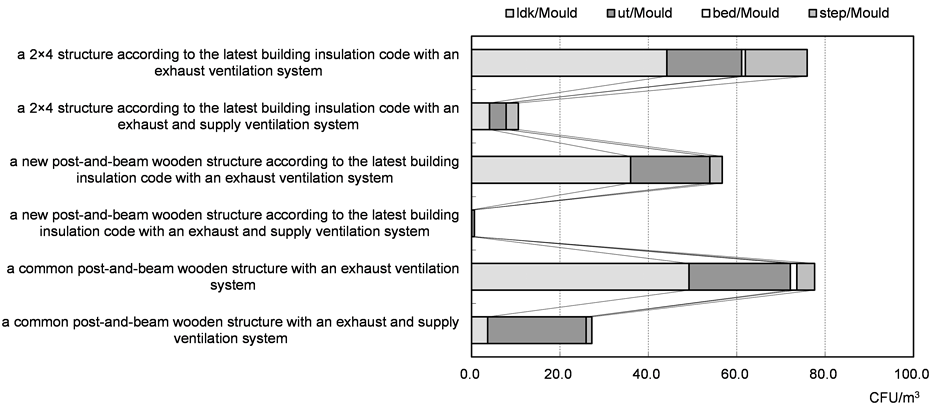
Figure 13. Annual averages of indoor mould concentrations.
concealed spaces to indoor space by large pressure differences.
4. Conclusions
Simulation results showed that mould infiltrates from crawl space to indoor space. This infiltration is caused by the stack effect with temperature difference and the steady pressure difference with mechanical ventilation systems. This infiltration is recognized in three common structures in Japan. The influence of mould infiltration from crawl space can be reduced by compression of indoor space with air supply. However this effect is smaller in the case of low airtight structures.
The results showed important factors to keep indoor mould concentration low. Even if the mould concentration of supply air could be low by some filters, the infiltration from crawl space might make indoor mould concentrations high. Therefore the air quality of crawl space has to be kept better. Some chemical compounds are used to prevent mites, bacterium and mould in the crawl spaces in Japan. But these chemical compounds infiltrate to the indoor space and may influence the dwellers’ health. Therefore, passive technologies are needed to keep crawl space dry and to keep mould concentrations lower. The outside insulation around basement might be one of the solutions.
Acknowledgements
The study was a part of a national project “Development of Countermeasure Technology on Residential Indoor Air Quality” by National Institute for Land and Infrastructure Management under the Japanese government. The study was carried out by Grant-in-Aid Scientific Research of Japan Society for the Promotion of Science. The investigations were made with the cooperation of the Center for Housing Renovation and Dispute Settlement Support, the Center for Better Living. The authors express their gratitude to Dr. Noboru Aratani, Dr. Masamichi Enai, Dr. Hiroshi Yoshino, Dr. Takao Sawachi and Prof. Atsuo Nozaki.
References
- Airaksinen, M., Pasanen, P., Kurnitski, J. and Seppanen, O. (2004) Microbial Contamination of Indoor Air Due to Leakages from Crawl Space: A Field Study. Indoor Air, 14, 55-64. http://dx.doi.org/10.1046/j.1600-0668.2003.00210.x
- Airaksinen, M., Kurnitski, J., Pasanen, P. and Seppanen, O. (2004) Fungal Spore Transport through a Building Structure. Indoor Air, 14, 92-104. http://dx.doi.org/10.1046/j.1600-0668.2003.00215.x
- Fazio, P., Bartlett, K., Yang, D.-Q., Rao, J.W. and Miao, G. (2005) Development of Experimental Procedure to Evaluate Potential Movement of Mould Spores from Wall Cavity to Indoor Environment. 10th Canadian Conference on Building Science and Technology, Ottawa, May 2005, 215-224.
- Hayashi, M. and Osawa, H. (2005) The Influence of the Concealed Pollution Sources upon the Indoor Air Quality in Houses. Proceedings of Indoor Air’05, Article ID: 2.7-30.
- Hayashi, M. and Osawa, H. (2008) The Influence of the Concealed Pollution Sources upon the Indoor Air Quality in Houses. The International Journal of Building Science and Its Applications, Building and Environment, 43, 329-336.http://dx.doi.org/10.1016/j.buildenv.2006.03.022
- Hayashi, M., Osawa, H., Hasagewa, K., Honma, Y. and Yamada, H. (2013) Experiments on Infiltration of Mold From Crawl Space under the Prefabricated Bathroom. Proceedings of CLIMA 2013, Prague, Article ID: 296.
- Yamada, H., Hayashi, M., Osawa, H., Hasegawa, K. and Honma, Y. (2013) Experiments on a Method to Measure Mold Concentration in a Wall Cavity Using a Teflon Tube. Proceedings of CLIMA 2013, Prague, Article ID: 711.
- Honma, Y., Hayashi, M., Hasegawa, K., Osawa, H. and Yamada, H. (2013) The Relationships between the Indoor Air Pollution and the Air Quality in the Crawl Space Using Full-Scale Experimental House. Proceedings of CLIMA 2013, Prague, Article ID: 428.
- Hasegawa, K., Hayashi, M., Honma, Y. and Osawa, H. (2012) Influence of the Crawl Space upon the Indoor Air Quality—The Measurements of the Pollution by Mould in the Crawl Spaces and the Indoor Spaces in Japanese Houses. Proceedings of “Healthy Buildings”, 1-8.
- Hayashi, M., Osawa, H., Honma, Y. and Matsui, M. (2007) Prediction of Air Quality Considering the Concealed Air Leaks of Houses. Proceedings: Building Simulation 2007, 870-877.http://www.ibpsa.org/proceedings/BS2007/p208_final.pdf
- Hayashi, M., Enai, M. and Hirokawa, Y. (2001) Annual Characteristics of Ventilation and Indoor Air Quality in Detached Houses Using a Simulation Method with Japanese Daily Schedule Model. Building and Environment, 36, 721-731. http://dx.doi.org/10.1016/S0360-1323(00)00060-3
- NHK (1990) The Survey on the Japanese Daily Schedule 1990. NHK, Tokyo.