Journal of Environmental Protection
Vol.5 No.4(2014), Article ID:44122,15 pages DOI:10.4236/jep.2014.54031
Responses of Aquatic Vegetation to Pollution: Preliminary Results on Ecotoxicological Effects and Bioenrichment Factors
Monia Renzi1, Andrea Giovani2, Silvano E. Focardi2
1Department of Biological and Environmental Sciences and Technologies, University of the Salento, SP Lecce-Monteroni, Lecce, Italy
2Department of Physical, Hearth and Environmental Sciences, University of Siena, Via P.A. Mattioli 4, Siena, Italy
Email: monia.renzi@unisalento.it
Copyright © 2014 by authors and Scientific Research Publishing Inc.
This work is licensed under the Creative Commons Attribution International License (CC BY).
http://creativecommons.org/licenses/by/4.0/


Received 4 February 2014; revised 1 March 2014; accepted 18 March 2014
ABSTRACT
This study evaluates, on a preliminary basis, the principal morpho-physiological effects induced by pollution stress in four aquatic vegetation species of great ecological relevance in transitional water ecosystems. Three macroalgae (Chaetomorpha linum, Valonia aegagrophyla, Graciliariopsis longissima) and one phanerogams species (Ruppia cirrhosa) were exposed to different doses of trace elements (Cu, Hg, Zn) and surfactants (dodecylbenzenesulfonic acid sodium salt) in laboratory controlled microcosm conditions and morpho-physiological responses (photosynthetic complex alteration, percentage of died cells, morphological changes) were measured before and after 7 and 14 days of exposure. Levels of pollutants in tissues and BioConcentration Factors (BCF) for each species were calculated after 14 days of exposure. Results suggest that photosynthetic complex alteration can be a useful tool to evaluate early and sub-lethal significant changes due to exposure to pollution stress in all of the considered species. A clear species-specificity was observed concerning trace element levels in tissues after 14 days of exposure, while dose-dependent behavior was observed for BCFs.
Keywords:Morpho-Physiological Endpoints; Trace Elements; Surfactants; BCFs; Macrophytes; Macroalgae

1. Introduction
Ecotoxicological tests play a key role in the evaluation of water quality and pollution in freshwater and coastal ecosystems [1] . The possibility of using vegetation for the evaluation of water toxicity or hormesis effects is well noted in the literature [2] . Nevertheless, ecotoxicological tests for ecosystem quality evaluation in marine and brackish water are based predominantly on unicellular algal species such as Dunaliella tertiolecta, Pheodactylum tricornutum, Skeletonema costatum. These tests are theoretically similar [3] , notably standardized and developed using an analogous methodological approach [4] ; the endpoint measured is growth inhibition after 72 hours of exposure to toxicant. Nevertheless, in transitional water ecosystems, aquatic vegetation and, in particular, macroalgae and phanerogams, are of great ecological relevance. Phanerogam species are known to develop important habitats for biodiversity conservation in aquatic ecosystems, and furthermore, macroalgae are often freely-moving, so hydrodynamic and meteorological features such as water currents and winds could strongly affect their distribution [5] , producing important contributions to pollutant redistribution within a semienclosed lagoon basin and to pollutant uptakes among herbivores along the aquatic trophic web [6] . In Europe, the implementation of the Water Framework Directive CE 2000/60 [7] encourages the development of numerous research programmes focused on the development of aquatic vegetation-based water quality assessment indices. In spite of the great ecological importance of aquatic vegetation, little focus is placed on examination of macroalgae and phanerogam species in phytotoxicity tests. Much more attention should be given to the analysis of biological responses consequent to stress due to water pollution, particularly with regard to transitional water ecosystems and bioconcentration studies [8] . The development of more rapid and effective methods for assessing early exposure to stress that are able to highlight morphological and physiological alterations in macroalgae and phanerogams is thus a priority objective for current research. Results obtained from ecotoxicological tests performed on aquatic vegetation (macroalgae and phanerogams) could be useful to evaluate direct toxicity of pollutant sources on a key component of the aquatic ecosystem. Furthermore, the development of early and sub-lethal biomarkers in these species could provide a useful tool to improve knowledge on the health of this component, contributing to a better understanding of the results of water quality evaluations that apply the biodiversity indices suggested by the Water Framework Directive [7] . The selection of the biomarker to be detected is certainly an important aspect. In aquatic vegetation species, possible indicators of early physiological stress are the alteration of both photosynthetic complex [9] and pheophytin ratio [10] . Although encouraging results from application of the alteration of photosynthetic complex as biomarkers useful to detect early and sub-lethal stress responses have been reported for unicellular algal cells [11] , recent studies considered the alteration of chlorophyll-a as toxicological endpoint for the in situ evaluation of water toxicity [12] [13] both in green macroalgae as well as Ulva sp. [14] and phanerogam leaves [15] . Significant alterations of photosynthetic pigments were observed in Posidonia australis, Amphibolis antarctica, Halophila ovalis [16] , Thalassia testudinum [17] through direct fluorimetry measurements, suggesting the presence of stress-induced responses. In spite of these reported experiments, ecotoxicological research aimed at evaluating early and sub-lethal responses induced by trace elements and surfactant pollution has not yet been well explored in the literature. Among the great number of chemicals that can have significant impacts in aquatic environments, this research focuses on three trace elements of particular environmental concern (Cu, Hg, Zn) and a surfactant widely used in human activities (dodecylbenzenesulfonic acid sodium salt, MBAS). The decision to study these chemicals is due mainly to their relevance in transitional coastal ecosystems as well as harbours and lagoons. Previous research has evidenced that some of these chemicals could severely interfere with unicellular aquatic vegetation, producing significant alterations in cellular metabolic pathways, cellular biovolumes and bioluminescence [11] . Furthermore, surfactants [18] and trace elements are highly concentrated in transitional water ecosystems [19] [20] , as both accumulate in sediments [21] . Sediment re-suspension occurring during dredging operations (i.e. harbours) and fishery exploitation (i.e. lagoons) could bring about an increase in the redox-potential of sediment, inducing important trace element releases into the water column that may severely affect aquatic vegetation [22] . The efficiency of macroalgae and phanerogam uptake of trace elements from water could be evaluated and expressed as BioConcentration Factors (BCFs).
The aim of this paper is to evaluate, on a preliminary basis, morphological and physiological changes induced after 7 and 14 days of exposure to different doses of trace elements (Cu, Hg, Zn) and surfactants (MBAS) in four different aquatic vegetation species of particular ecological concern in transitional water ecosystems (Chaetomorpha linum, Valonia aegagrophyla, Graciliariopsis longissima, Ruppia cirrhosa). Species-specific responses related to morphological and physiological endpoints considered are also evidenced. Furthermore, this research aims to measure BCFs in considered species, evaluating possible dose-dependent and species-specific levels. The absence of ecotoxicological data is largely due to the lack of standardized protocols on macroalgae and phanerogams. The results obtained could be useful to: 1) better understand ecotoxicological responses of considered species; 2) develop new acute, sub-lethal and earlier endpoints with regard to aquatic vegetation; 3) allow test standardization; 4) define species-specific differences concerning trace element accumulation in tissues; 5) enhance knowledge useful for the application of water quality evaluations with biodiversity indices based on aquatic vegetation.
2. Materials and Methods
2.1. Experimental Design
Four different aquatic vegetation species (C. linum, V. aegagrophyla, G. longissima, R. cirrhosa) were collected in the Orbetello lagoon in spring 2013. The Orbetello lagoon was selected due to our extensive knowledge on macroalgae and phanerogam distribution and fluctuations within this ecosystem, and the documented geo-referenced position of local human-generated pollution sources [11] [18] , which made it possible to avoid the most heavily polluted sites. Before the experiments, sampled species were stored in natural marine water collected from a local unpolluted site (Due Pini, Argentario Mountain), physical-chemical water descriptors from which were also monitored (Table 1).
A preliminary storage in marine water was performed for 48 hours. Macrophytes were exposed to varying concentrations of Cu, Hg, Zn and MBAS (dodecylbenzenesulfonic acid sodium salt C18H29NaO3S). Trace elements were selected on the basis of their environmental impact, while dodecylbenzenesulfonic acid sodium salt is a linear alkylbenzenesulfonates (LAS) and constitutes the main component of laundry detergent. It is considered representative of methylene-blue active substances (MBAS), a family of chemicals directly related to domestic uses that generate toxicity [23] . Ecotoxicological effects induced after 7 and 14 days of exposure compared to controls were evaluated. Toxicants were tested at two different dilutions: 25 mg∙L−1, 100 mg∙L−1 for Cu and Zn; 1 mg∙L−1, 50 mg∙L−1 for Hg; 0.5 mg∙L−1, 10 mg∙L−1 for MBAS. Tested concentrations for Cu and Zn were selected due to their ecotoxicological effect on cell fluorescence, evidenced by previous research involving unicellular algal species [11] . Mercury concentrations ranged within values measured in highly polluted sites within the Orbetello lagoon. Concerning surfactants, exposure concentrations selected in this paper are respectively lower and higher than average levels measured in water of the Orbetello lagoon [18] . Prior to exposure, the tissue integrity of collected species was verified by means of light microscopy.
2.2. Structure of the Exposure Chamber
Exposure chambers were prepared separately for the experimental control and for each tested dilution of toxicants in three experimental replicates (n = 3). Exposure chambers were two-litre HDPE vessels, previously decontaminated. Oxygenation was ensured through continuous atmospheric air insufflation by oxygenators. Photocycles were set on 12 h dark-light cycles using a lateral 10,000-lux white light emission source (Figure 1). Acidified concentrated solutions of Cu (lot n. 4D750284E), Hg (lot. n. T109318G), and Zn (lot n. 3L763193N) were purchased from Carlo Herba, and dodecylbenzenesulfonic acid sodium salt (lot n. 455609/1) was purchased from Fluka. An opportune volume of the concentrated toxicant solution was diluted in 1 litre of pretreated natural seawater. Large volumes of seawater were filtered through cellulose fiber filter disks (0.45 µm pore diameter) to avoid possible total organic carbon interference [24] and sterilized. Before biomass exposure, mesocosm water containing toxicants was checked for pH (Bioclass, mod. pH-meter) and eventually corrected to 8.0 ± 0.1

Table 1. Physical-chemical water descriptor from the reference unpolluted site (Due Pini, Argentario Mountain).
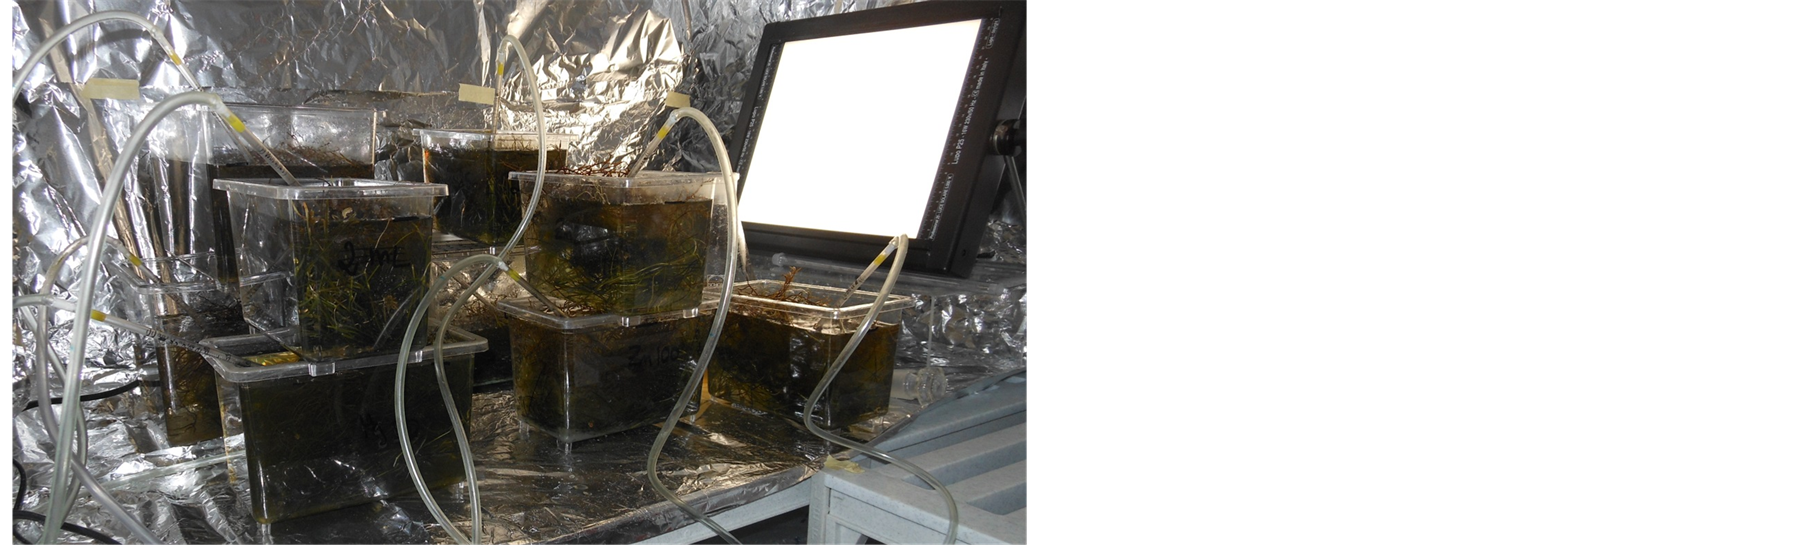
Figure 1. Exposure chambers. An example of experimental chambers used for ecotoxicological tests is represented.
with the addition of NaOH (1 M) to avoid pH-based stress. Collected and stabulated macroalgae and phanerogam tissues were thoroughly cleaned of sediments and ephyfites and wet weighed. A suitable amount of tissue was sampled prior to experimental exposure to determine the natural values of selected endpoints. Another portion of tissue was sampled and used to determine humidity. An equal weight of each species (100 g w.w.) was placed inside the experimental chamber into 1 L of the toxicant dilution for the exposure test. Temperature was tested twice a day throughout the experiment and maintained at 20˚C ± 0.5˚C, while pH was checked daily to avoid deviations from its starting value by more than one unit, as per [24] guidelines. On a daily basis, salinitycorrected pre-treated natural seawater was added in order to maintain constant water volume and initial toxicant concentrations. After said additions, salinity was also tested and was maintained between 3.80% ± 0.05%.
2.3. Morphological and Physiological Endpoints
A qualitative description of morphological alterations (tissue colour, tissue structure, tissue texture, cellular osmosis, chloroplast alterations) of exposed macrophytes concerning tissue texture and structure as provided through light microscopy observation (Optika). The quantitative weight variation of tissues was calculated comparing wet weight before and after the treatment and expressed as a percentage. Humidity (%) was determined by double-weighing tissue before and after tissue as it dried throughout the lyophilisation procedure.
The alteration of the photosynthetic complex is considered a useful physiological endpoint to assess the occurrence of early effects on cells exposed to sub-lethal doses of toxicants, and was measure in macrophyte tissues by means of spectroscopy [9] -[11] . Samples were treated in the dark using a weak green light to avoid pigment deterioration. Tissues were extracted with a solution of 3 mL of dimethylsulfoxide and 3 mg of polyvinyl-poly-pyrrolidone. Extracts were stored in darkness for 18 hours and centrifuged (4000 RPM for 10 min.) to collect the supernatant. Precipitates were extracted for a second time after 6 hours of incubation in darkness with 3 mL of dimethylsulfoxide to maximize recovery. Unified extracts were analysed by means of spectrophotometry (Jenway, mod. 6505 UV/Vis) at λ = 415, 435, 480, 649 and 665 nm, after checking for turbidity interference (λ = 750 nm). Equations used for the determination of chlorophyll-a (Chl-a), chlorophyll-b (Chl-b) and its allomers (β-carotene and xanthophyll, Chl-cx) concentrations were those reported by the literature [11] [25] . Chl-a degradation is expressed, in accordance with [10] , as Phe = ABS435/ABS415 normalized to the control.
Cell viability was determined as according to the literature [26] [27] using Trypan blue dye. After 30 minutes of exposure to the dye solution at the concentration of 4% (w/v), dead cells show as a distinctive blue colour under a microscope, while living ones are not pigmented. In fact, since cells are very selective in the compounds that pass through the membrane, in a viable cell, Trypan blue is not absorbed, but it passes through the membrane in a dead cell. Quantification of the average dead cell percentage for each toxicant dose was based on a count of coloured cells among 200 randomly selected ones.
2.4. Physical-Chemical Analyses
Trace elements were measured both in water (test media and seawater) and tissue samples. Water samples were analysed to determine levels of the trace element of interest by means of acidification of the water sample and direct ICP-OES quantification.
Concerning trace elements in tissues, about 0.5 g of homogenized tissues collected after 14 days of exposure were weighed into PTFE tubes and mineralized with a mixture of HNO3-H2O2-HF (3:1:0.2 v/v) in a microwave oven (Milestone, mod. ETHOS D Microwave Lab station) according to [28] for the determination of Cu, Hg and Zn. Extracts were opportunely diluted with ultrapure water and filtered using pre-cleaned cellulose fibre filter disks (Millipore). Quantifications were performed by inductively coupled plasma-atomic emission spectrometry (ICP-OES) using an Optima 2000 Dual View, Perkin-Elmer instrument [29] for Cu and Zn while Hg was determined by atomic absorption via cold vapour generation (CV-AAS) according to the US-EPA [30] method.
Quality assurance and quality control were performed using GBW 07604 (poplar leaves) certified standard material. Chemicals and reagents were analytical grade and glassware was carefully washed to avoid sample cross-over contamination. Precision was evaluated by extracting five replicates with a CV% inferior to 7.0%. Accuracy was determined by comparing measured values (mean ± standard deviation) with certified ones, which were: 9.558 ± 0.139 vs 9.3 ± 0.5 mg∙kg−1 for Cu; 0.025 ± 0.007 mg∙kg−1 vs 0.026 ± 0.003 mg∙kg−1 for Hg; 36.232 ± 0.496 mg∙kg−1 vs 37 ± 1 mg∙kg−1 for Zn. Analytical blanks were prepared using the same procedure. Due to high percentages of recovery (<90%), analytical concentrations were not recovery corrected to avoid mathematical errors. A solvent/matrices blank was checked every 15 samples to evaluate instrument detection response. Limit of detection (LOD) was defined as the average blank (n = 10) plus three standard deviations (SD). Limit of Quantification was 0.001 mg∙kg−1 for Cu, Hg, and Zn.
2.5. BioConcentration Factors
BioConcentration Factors (BCF) were determined at the steady state after 14 days of exposure for each tested dose as the ratio of the chemical concentration in tissue and the toxicant concentration measured in test media [24] [31] . Results are expressed as L∙kg−1.
2.6. Statistical Analysis
GraphPad Prism (GraphPad Software, San Diego California USA, www.graphpad.com) software was used for data analyses. Graphics and statistics (ANOVA with a Dunnett’s test) were generated with the aim of evaluating significant differences among treatments and controls. H0 hypothesis was rejected with p < 0.01 level of significance, but p < 0.05 were also indicated.
3. Results
3.1. Morphological Changes
Macroalgae tissues exposed to trace elements show significant effects in terms of water content changes, tissue structure and colour alterations, reduction of chloroplast volume (C. linum) and osmoregulation deficiency with cytolysis (V. aegagrophyla, G. longissima). Principal morphological alterations of tissue structure due to toxicant exposure observed by means of light microscopy compared to controls are reported in Figure 2. Cellular damage observed by means of light microscopy in species exposed to toxicants are reported in Figure 3. In Table 2, morphological and physiological qualitative effects observed after the exposure are reported, while Table 3 reports morphological and physiological quantitative data (percentages of weight variation and dead cells) observed in tissues exposed to lowest and highest toxicant doses. Macroalgae tissues prior to exposure to toxicants are characterized by similar water content: 63.32% (C. linum), 65.60% (V. aegagrophyla), and 64.25% (G. longissima). After toxicant exposure, the water content in treated tissues changes significantly, evidencing an increase of humidity in some species (C. linum, G. longissima) and a decrease in others (V. aegagrophyla, G. longissima). The occurrence of cell lysis determines the formation of a less-defined tissue structure in macroalgae, with an increase in water content and viscosity of tissues (C. linum). Exposure to MBAS determines tissue depigmentation in treated algae species. A clear osmotic alteration is observed in exposed tissues of the V. aegagrophyla species, which determines reduced cell turgor, decreased water content and the wilting of the entire algal biomass. In this species, colour changes in treated tissues from dark green to dark brown or light green. The same behaviour is observed for G. longissima when exposed to 50 mg∙L−1 of Hg and 100 mg∙L−1 of Zn.
Concentrations of 25 mg∙L−1 and 100 mg∙L−1 of Cu induce changes in tissue colour from red to a dark brown pigmentation, while MBAS exposure induces depigmentation. R. cirrhosa has a lower natural water content (4.43%) than macroalgae. In this species, any water content alterations observed are due to toxicant exposure. A
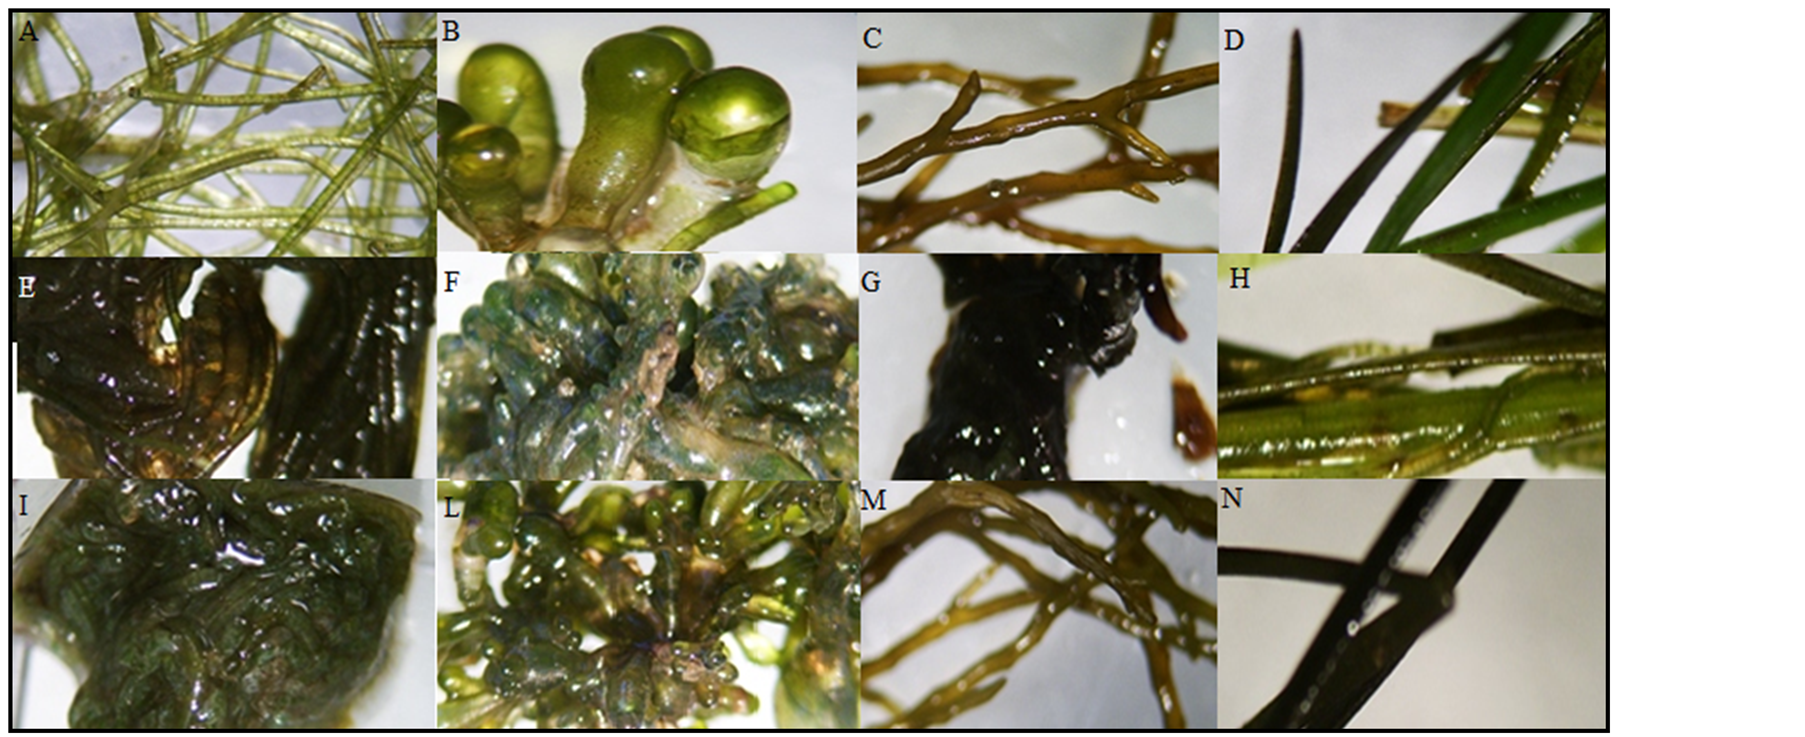
Figure 2. Principal morphologic alterations of tissue structure due to the toxicant exposure observable by light microscopy. Natural tissue structure observed in controls are reported in figures A-D, whereas alterations observed are reported in figure E-N. Natural structure, tissue details: A = C. linum; B = V. aegagrophyla; C = G. longissima; D = R. cirrhosa. Alterations: E = Lack of tissue and cellular consistence, water content increase and colour alteration (dark brown) in C. linum; F = Lack of cell turgor, natural osmotic alteration, water content loss, change of natural colour (light green) in V. aegagrophyla, G = Lack of tissue and cellular consistence, water content increase, colour change (dark-brown) in G. longissima; H = Leaves structure and consistence alteration in R. cirrhosa; I = Cellular turgor and tissue consistence alteration with conservation of natural tissue colour in C. linum; L = Cell natural structure, alteration in V. aegagrophyla; M = Change of colour in G. longissima; N = Tissue colour alteration in R. cirrhosa.
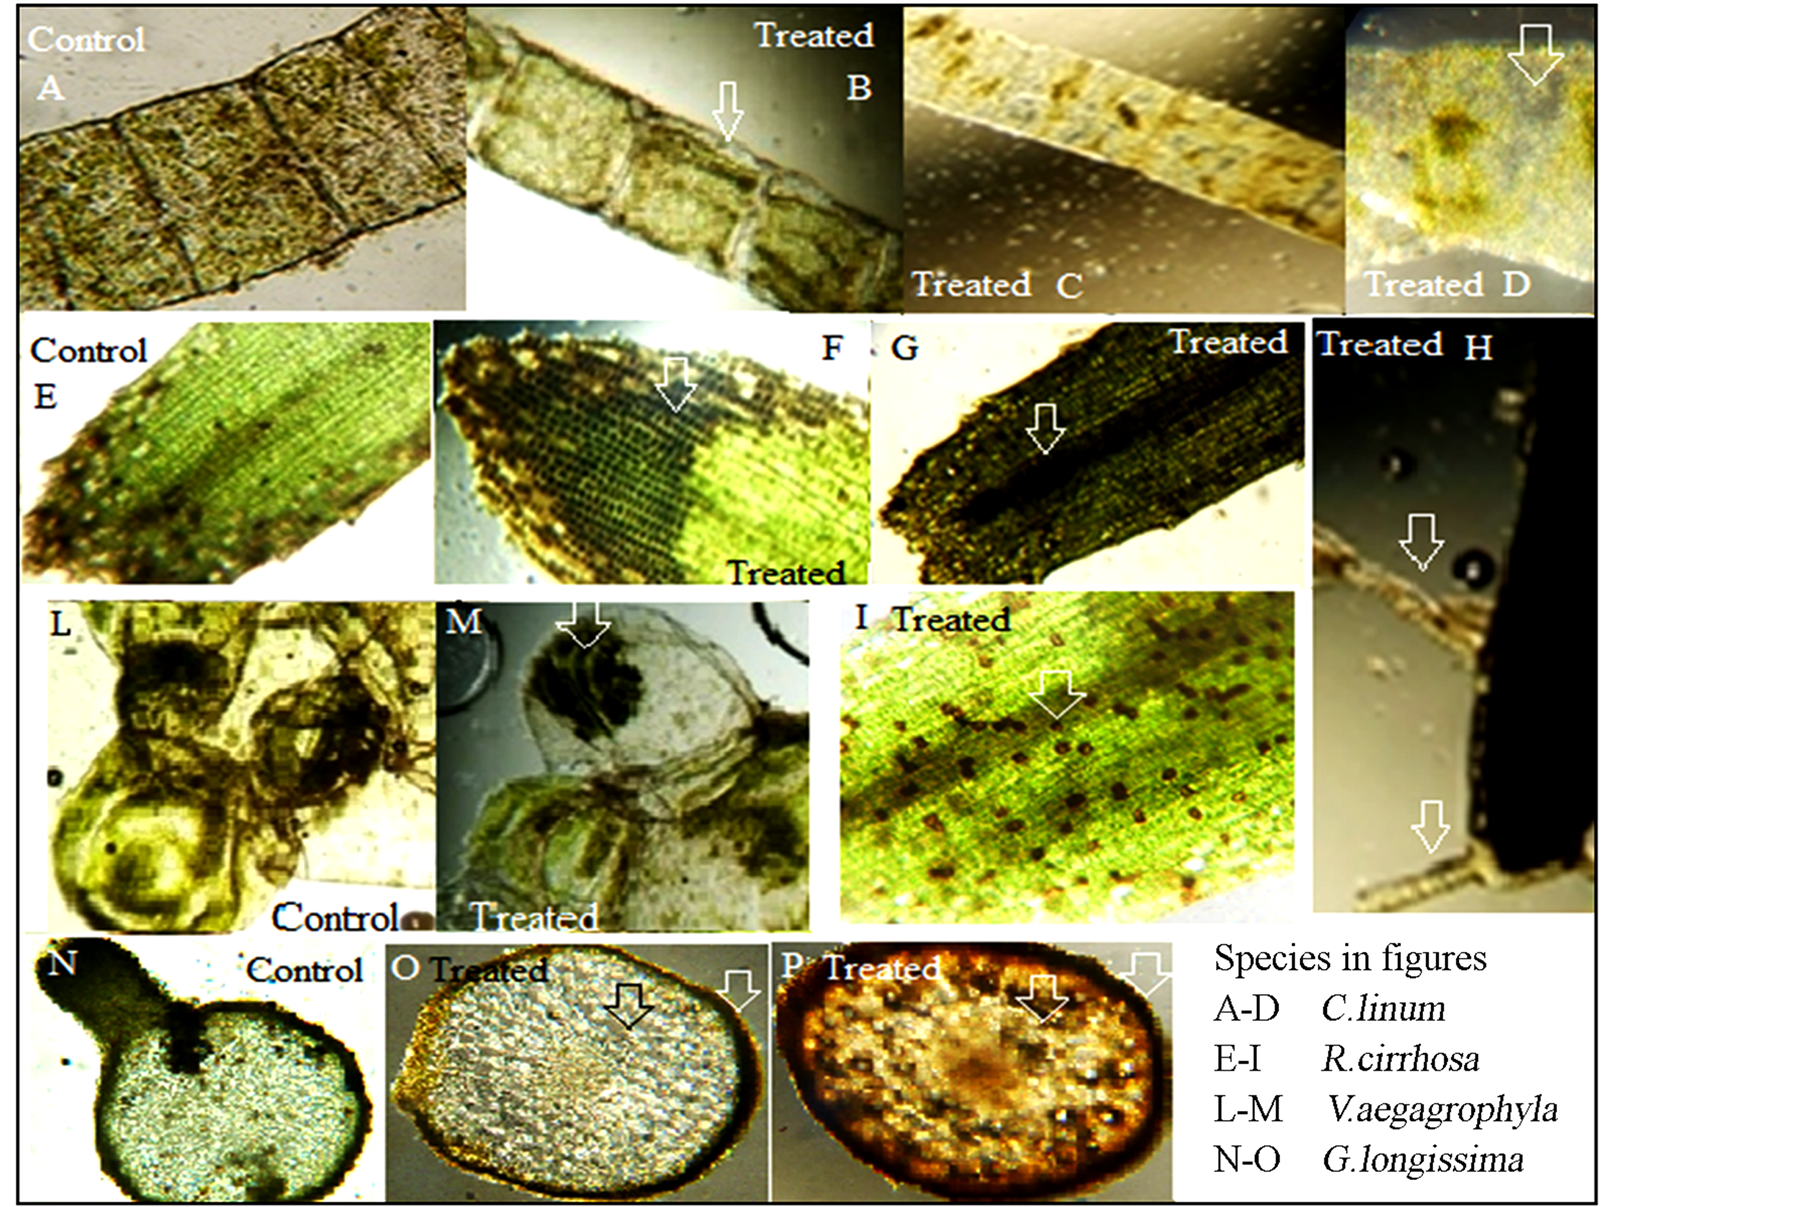
Figure 3. Cellular damages observed by light microscopy in species exposed to toxicant. Natural tissue structure observed in controls are reported in figures A, E, L, N. Alterations observed: Osmotic alterations (B, M), chloroplasts alterations (C, D), cellular death (F, G, I, P), colour alteration (absence of pigments, change to dark brown, M, O, P), proliferations on leaves (H).
Table 2. Morphological and physiological qualitative effects related to different toxicant doses after 14 days of exposure.
Notes: LD = Lowest exposure dose; HD = Highest exposure dose. Exposure doses were: 25 mg∙L−1 (LD) and 100 mg∙L−1 (HD) for Cu, Zn; 1.0 mg∙L−1 (LD) and 50 mg∙L−1 (HD) for Hg; 0.5 mg∙L−1 (LD) and 10 mg∙L−1 (HD) for MBAS. Qualitative scale of traits of considered morphological and physiological descriptors: -means that considered treat do not evidenced changes; *means that some changes are observed; **means that evident changes are observed; ***means that very marked changes are observed.
Table 3. Morphological and physiological quantitative data related to different toxicant doses after 14 days of exposure.
Notes: LD = Lowest exposure dose; HD = Highest exposure dose; WV = Weight variation percentage; DC = Dead cells percentage; ND = Not Detected; NS = Not Significant differences (p > 0.05). Exposure doses were: 25 mgL−1 (LD) and 100 mg∙L−1 (HD) for Cu, Zn; 1.0 mg∙L−1 (LD) and 50 mg∙L−1 (HD) for Hg; 0.5 mg∙L−1 (LD) and 10 mg∙L−1 (HD) for MBAS. Before treatments, average (SD) water content in macroalgae were: 63.32 ± 3.94% (C. linum), 65.60 ± 7.20% (V. aegagrophyla), and 64.25 ± 3.74% (G. longissima) while in phanerogam was: 4.43 ± 1.56% (R. cirrhosa).
clear and significant depigmentation of tissues, which change from light green to dark brown after exposure to the highest doses of Cu, Hg and Zn, is observed. In R. cirrhosa species, exposure to MBAS does not produce any significant effects on tissue morphological traits.
3.2. Quantification of Cell Death
Trypan blue dye is used as a cell vitality indicator [32] ; the average percentage of dead cells is reported in Table 3 for the species R. cirrhosa after 14 days of exposure to toxicants. C. linum and G. longissima species were excluded from this analysis due to the high tissue decomposition observed in these species after 14 days of exposure, and V. aegagrophyla was excluded due to its siphono-cladal organization (presence of great cells containing numerous nucleus), which does not allow for this type of analysis. Tissues exposed to trace elements appear less coloured by the dye compared to MBAS-exposed ones, which appear coloured. In fact, trace element exposure damages both the cell wall and the photosynthetic complex, inducing either cell death and tissue colour change from green to dark brown, which covers the blue pigmentation due to the dye.
3.3. Physiological Endpoints
Figure 4 shows results related to the alteration of the photosynthetic complex which is expressed for each spe-
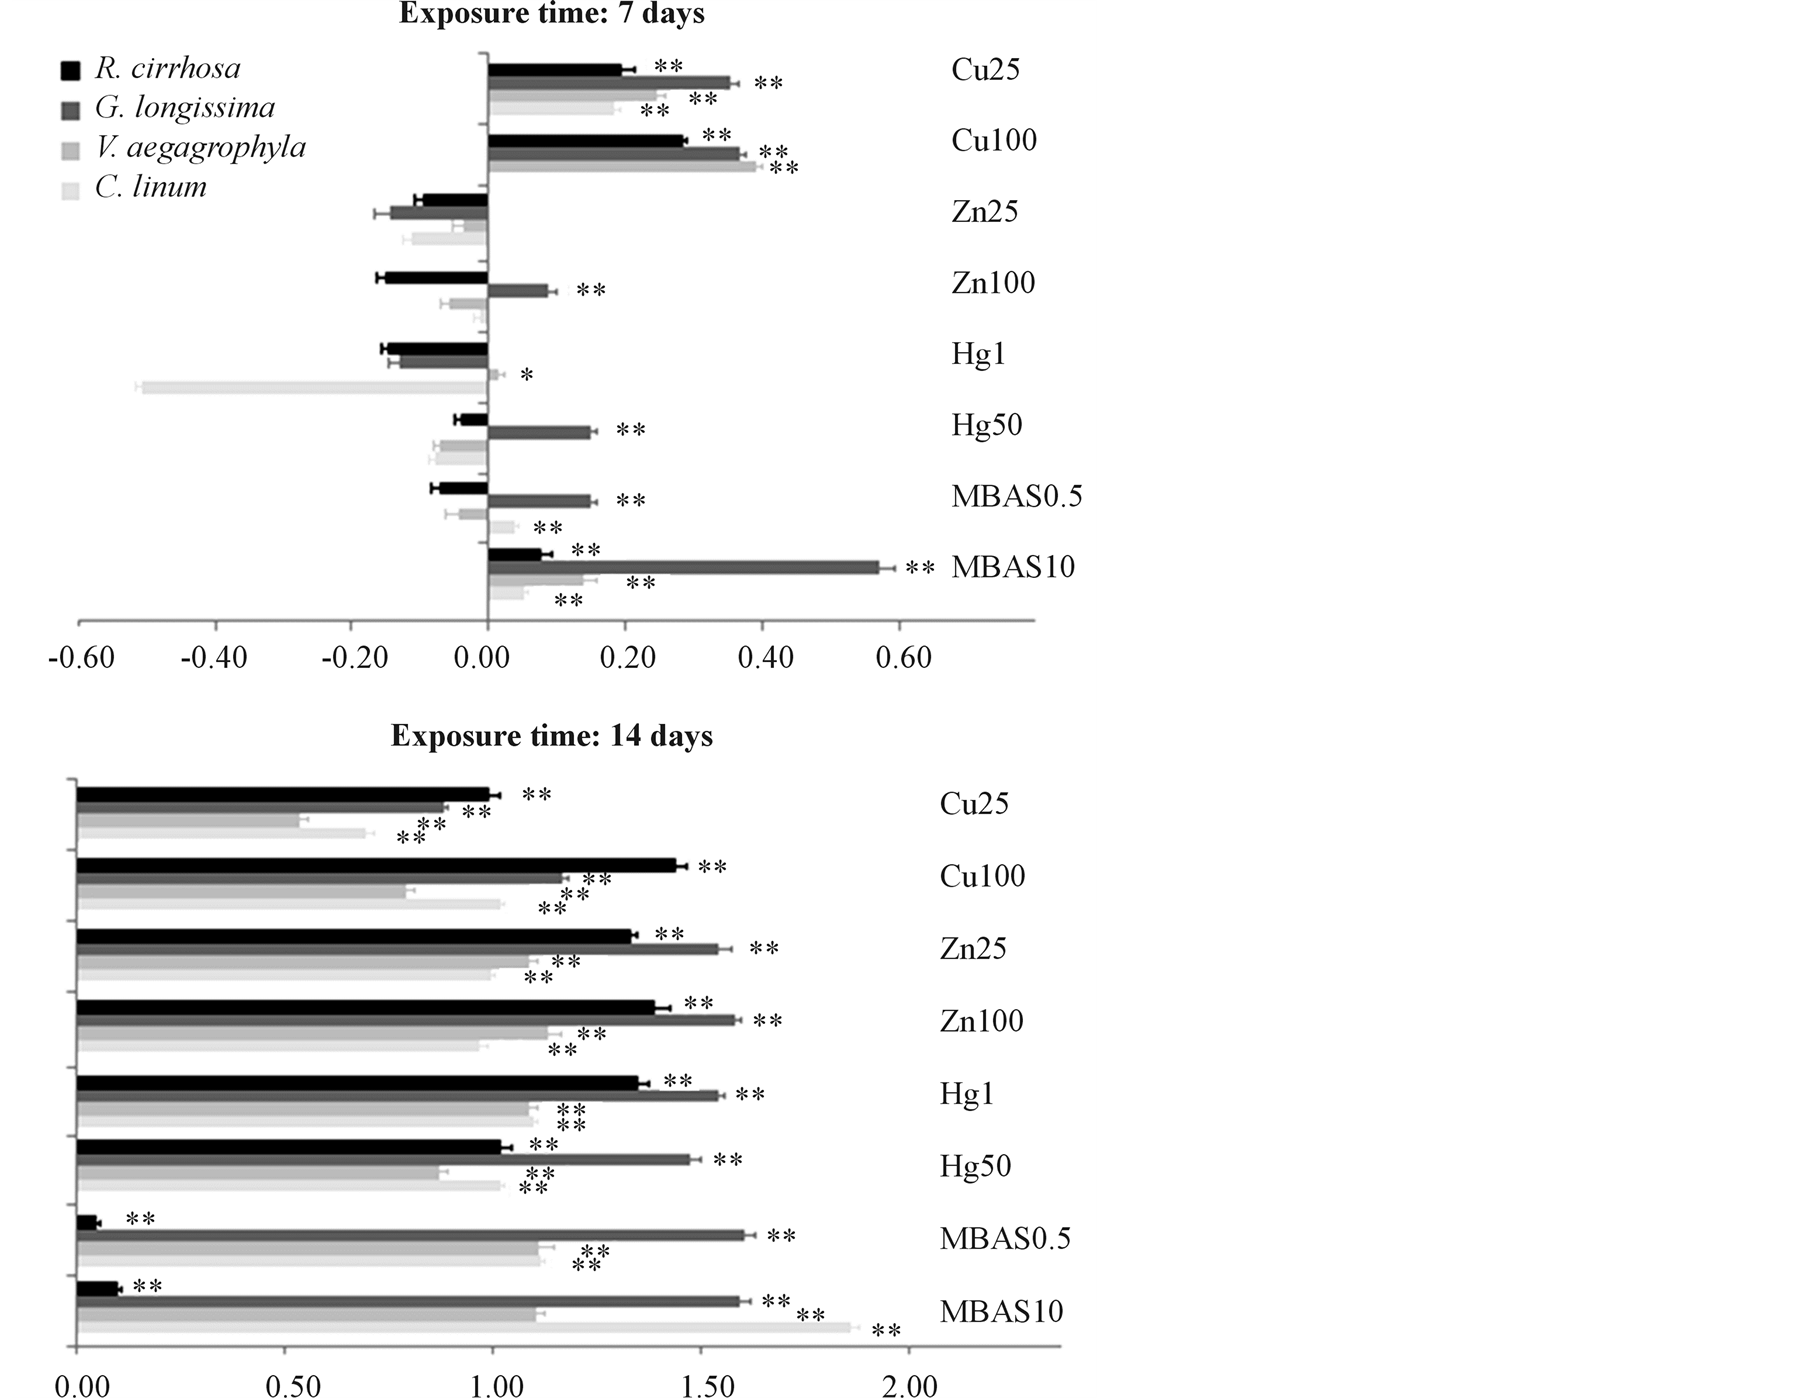
Figure 4. Alteration of the photosynthetic complex. Alteration of the photosynthetic complex is expressed for each species on a logarithmic scale as percentage ratio between Chlorophyll-a and its allomers in treated tissue sampled normalized for the controls (Chl-a/(Chl-a + allomers)). Toxicants are indicated with their exposure dose (mgL−1). Significance of differences between treatments and controls are evidenced in figure (* = p < 0.05; ** = p < 0.01).
cies on a logarithmic scale as percentage ratio between Chlorophyll-a and its allomers in treated tissue sampled, normalized for the controls. Positive values indicate a lower ratio in treated tissues compared to controls due to stress induced by toxicant exposure, which reduces Chl-a levels amount and increases, in proportion, the concentration of allomers. On the contrary, negative values indicate an increase in Chl-a production in treated tissues compared to controls due to the occurrence of a biostimulating effect. After 7 days of exposure, responses of the photosynthetic complex are different in considered species depending on the typology of toxicant. In particular, Cu exposure induces significant effects (p < 0.01) on photosynthesis for every considered species and at every toxicant dilution. Hg and Zn show significant effects (p < 0.01) only concerning the species G. longissima for 50 mg∙L−1 and 100 mg∙L−1 exposure doses. Exposure to MBAS induces significant effects in G. longissima and C. linum at the concentration of 0.5 mg∙L−1, while, 10 mg∙L−1 of MBAS determines effects on every tested species, with particular significance for G. longissima. After 14 days of exposure, every tested species shows significant (p < 0.01) stress with regard to the photosynthetic complex, with the exception of R. cirrhosa, which evidences a significant (p < 0.01) but lower alteration of the photosynthetic complex for each tested dose.
In Figure 5, Phe index is reported as a ratio between the pheophitin concentrations in treated tissues and controls. In this case, in accordance to the literature, the occurrence of stress is evidenced by Phe levels higher than 1.1 (0.1 is three times the standard deviation of controls). Phe levels measured show a significant alteration only in the case of Zn and MBAS after 14 days of exposure with none relation with the toxicant doses.
3.4. BioConcentration Factors
Average levels of trace elements (Cu, Hg, Zn) accumulated in macroalgae and phanerogam tissues after 14 days of exposure are reported in Table 4 for each toxicant dose. For each species, results consistently show lower le-
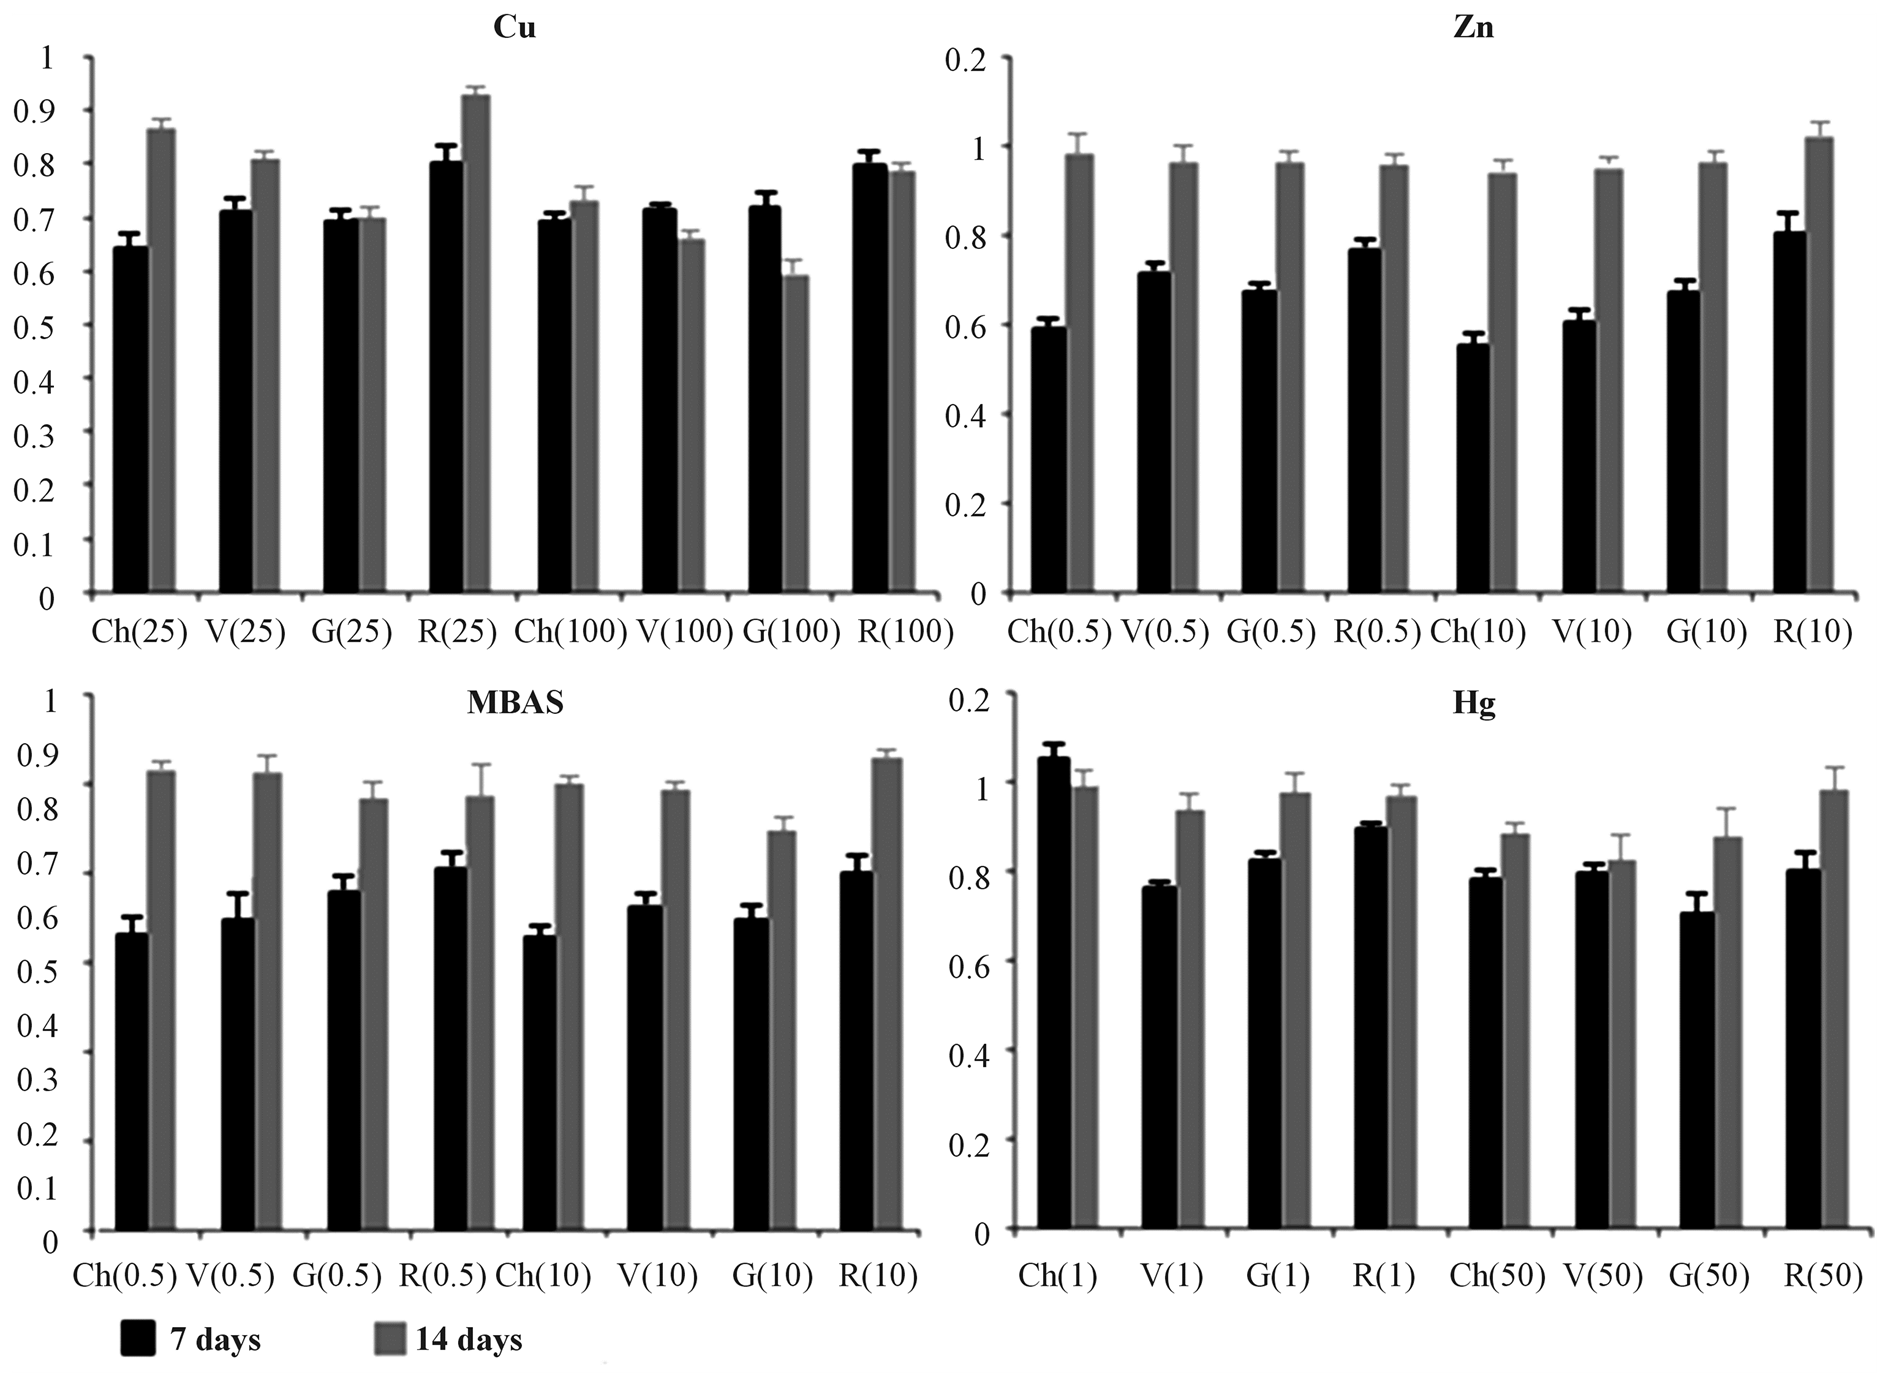
Figure 5. Pheophytin index. Pheophytin index normalized for the control reported for each species both after 7 (black) and 14 (grey) days of exposure. Ch = C. linum, V = V. aegagrophyla, G = G. longissima, R = R. cirrhosa. Numbers reported in brackets indicate toxicant exposure doses (mg∙L−1).
vels in controls than in treated tissues. Recorded differences among trace element levels in controls and treated tissues are significant in every case (Dunnett’s test, p < 0.01). In controls, average concentrations are lower than 4.0 mg∙kg−1 (Cu), 0.11 mg∙kg−1 (Hg), 25 mg∙kg−1 (Zn), while the highest values of trace elements are recorded in R. cirrhosa (Cu, Zn) and C. linum (Hg) tissues. In spite of these initial differences, exposed species show different bioaccumulation trends, which are clearly dose-dependent, toxicant-dependent and specie-dependent. Absolute highest levels are recorded in G. longissima tissues (Cu = 2030.2 mg∙kg−1; Hg = 928.5 mg∙kg−1) and C. linum (Zn = 933.08 mg∙kg−1), observed in correspondence with maximum exposure doses.
BioConcentration Factors (BCF) calculated for each species after 14 days of exposure and associated with toxicant doses are reported in Figure 6. On a general basis, BCF consistently above 1.0 is observed, suggesting enrichments in treated tissues. Concerning Cu, measured BCFs increase in proportion to the dose in the case of green macroalgae (C. linum, and V. aegagrophyla), whereas in G. longissima and R. cirrhosa BCFs are inversely proportional to the exposure dose. The inverse behaviour is observed in the case of Hg, for which green macroalgae show inverse proportions of BCFs to toxicant dose. Zn evidence, for all of considered species, is also
Table 4. Average trace elements levels in controls and exposed species.
Notes: Average data (n = 3) are expressed as mg∙kg−1 w.w. C = control; LD = Lowest exposure dose; HD = Highest exposure dose. Exposure doses were: 25 mg∙L−1 (LD) and 100 mg∙L−1 (HD) for Cu, Zn; 1.0 mg∙L−1 (LD) and 50 mg∙L−1 (HD) for Hg.
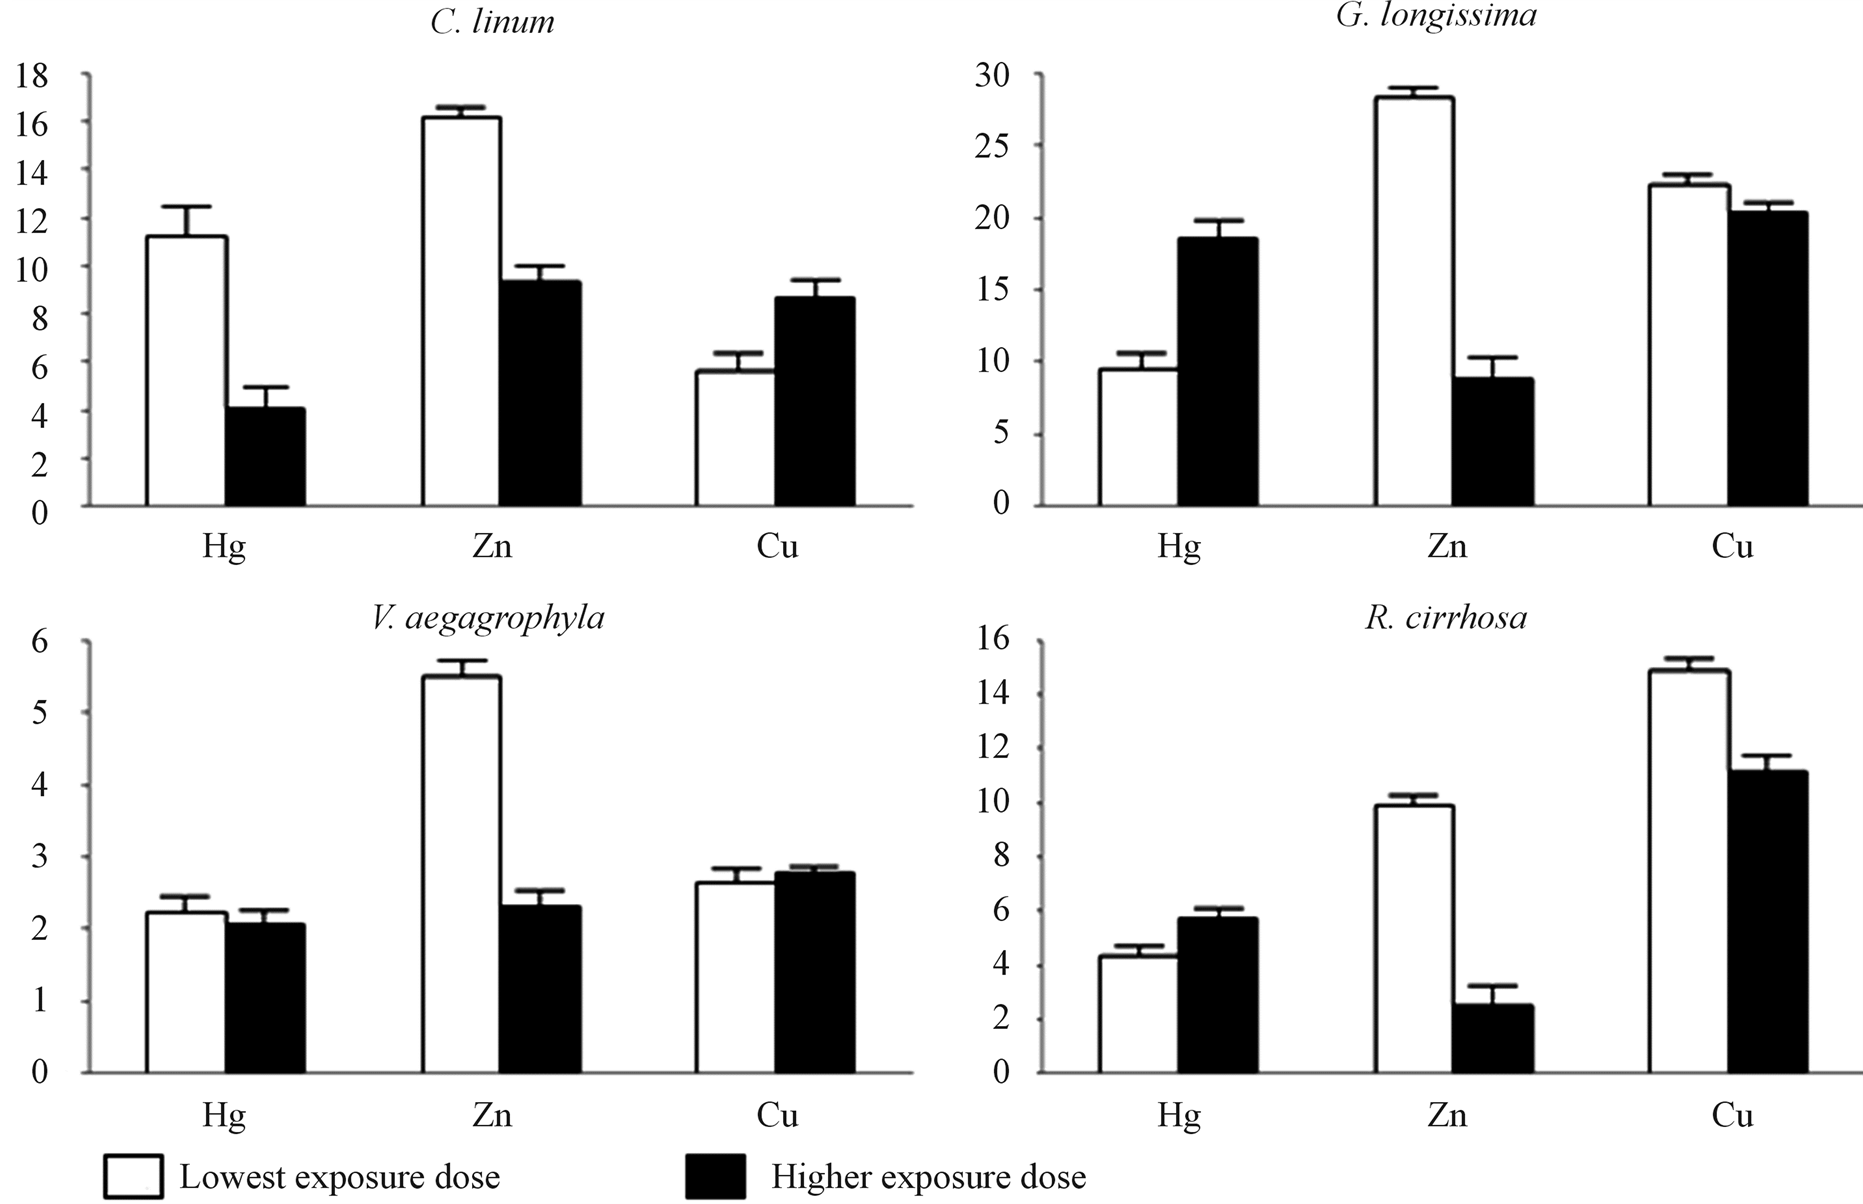
Figure 6. BCFs in exposed species. Bioconcentration factors (BCFs) are reported for exposed species. Exposure doses were: 1 mg∙L−1 (LD) and 50 mg∙L−1 (HD) for Hg and 25 mg∙L−1 (LD) and 100 mg∙L−1 (HD) for Zn and Cu.
inversely proportional to dose.
4. Discussion
Ecotoxicological tests are recognized as important tools in environmental studies [33] as they allow for the relation of a certain toxicological endpoint to the exposure dose of a given environmental toxicant on qualitative or quantitative bases. Any physiological, morphological or biological (growth rate, reproductive efficiency, survival responses) change induced by the exposure could be an endpoint of interest in ecotoxicological research and applications [34] . Effects induced by exposure are more easily and precociously manifested in structurally simpler species such as unicellular organisms and macroalgae than more complex ones like, for example, phanerogams [35] . Even though tests performed on the latter are less standardized and more replicable [36] -[38] , the ecological value of responses obtained is notably higher. Species considered in the present research are three macroalgae (C. linum, G. longissima, V. aegagrophyla) and one phanerogam (R. cirrhosa). Compared to macroalgae, phanerogams and R. cirrhosa have much more complex structures. Phanerogams are important species in aquatic environments; they are biocenosis of great ecological and economical relevance in the Mediterranean sea [39] because they have several biological functions: they are involved in managing fish stocks in the coastal environment, constitute a place for nurseries, shelter and food for a large number of animal species [40] , and play a role in regulating hydrodynamism as they help maintain the coastal balance [41] . In spite of this, little research has been carried out to understand ecotoxicological responses of phanerogams to water pollutants and, to the best of our knowledge, this study is the first to be performed on R. cirrhosa, the climax species in transitional water ecosystems.
In water ecosystems, environmental quality evaluation is based on the application of biotic indices [42] . Marine benthic phanerogams and macroalgae are key structural and functional components of some of the most productive ecosystems of the world, including coastal water and lagoons; biotic indices based on macroalgae are widely used to define aquatic ecosystem health [43] . Species considered in this study are primary producers commonly found in transitional water ecosystems and widely used in calculations of numerous biotic indices for the evaluation of the water quality. Due to the importance of these species in ecological evaluations and to the lack of knowledge on ecotoxicological responses of aquatic vegetation when exposed to pollutants, results obtained in this study could provide a useful tool for the implementation of biotic indices in chemically polluted waters. In fact, in aquatic ecosystems, observed biotic responses have not to date been easily relatable to the occurrence of chemical pollution due to the lack of knowledge of the effects induced by the exposure to trace elements and surfactants. This research highlights the fact that different macrophytes species have significantly different responses to pollution, and their behaviour is toxicant-dependent. In fact, while macroalgae are severely morphologically damaged by trace elements, phanerogams are not evidently threatened by such exposure, even though physiological endpoints (alteration of the photosynthetic complex) clearly indicate stress.
The results shown in this paper, applied to the detection of effects related to pollution-induced stress, indicate that alteration of morphological traits observed in exposed tissues is associated with significant alterations of physiological endpoints. Furthermore, photosynthetic complexes show clear stress, even when no morphological changes are detected, as in the case of the species R. cirrhosa, and in the cases of all tested species at the lower dose of MBAS. Phe levels in exposed tissues are lower than in controls, indicating a generally lower production of Phe in exposed macroalgae and phanerogam tissues. Photosynthetic complex alteration [9] and pheophitin ratio [10] prove to be useful early stress indicators in unicellular algal species [9] [11] [44] [45] . Results obtained in this study suggest that the alteration of the photosynthetic complex could be a useful endpoint capable of highlighting early stress conditions in macroalgae and phanerogam species as well, even when tissues are exposed at sub-lethal doses.
Tested chemicals from different class of pollutants are characterized by different mechanisms of action. Surfactants determine a significant alteration of cellular membranes inducing cytosolic lysis, with low doses associated with biostimulation and increased Chl-a production [46] -[48] . Trace elements act directly on photosynthetic processes. A sizeable accumulation of trace elements is reported in plants [49] , but data on toxicity observed in macrophytes due to exposure to trace elements and surfactants are scarce and conflicting. ExcessZn could inhibit key metabolic processes such as growth [50] and photosynthesis [51] inducing oxidative stress [52] [53] . Cu brings about a significant alteration of cell membrane permeability, inducing the loss of organic substances [54] , potassium [55] and manganese [56] . Experiments carried out in this field most often concern P. oceanica, and often conclude that the plant’s vitality is diminished, whether by trace metals [49 and citations therein] or detergents [57] . R. cirrhosa presents a herbaceous rhizome with an extremely large number of branches, with very narrow, single-veined leaves with pointed tips [49] , and could adsorb and bioconcentrate pollutants both from leaves and roots [58] . In spite of this, leaves are the plant’s most significant part from an ecological point of view. In fact, it is an annual species [49] , and leaves are completely changed each year, and are therefore a source of pollutants for primary consumers [59] [60] spreading pollution throughout the trophic web [61] . Results obtained in this study indicate that R. cirrhosa is able to accumulate high concentrations of trace elements in leaves without evident morphological alteration of tissues, which could be consumed by herbivores, carrying pollution out into the trophic web.
Concerning BCFs, little data is available on autotroph species, and approximately 90% of BCFs are derived in fresh water, while only 10% are in salt water [62] . BCFs results calculated in this research are, to the best of our knowledge, the first results reported on these chemicals for C. linum, G. longissima, V. aegagrophyla and R. cirrhosa.
5. Conclusion
This paper shows how the alteration of the photosynthetic complex and pheophytin production could be useful toxicological endpoints in macrophytes to evaluate early effects of trace elements and surfactant pollution on exposed tissues even at sub-lethal doses (Cu, Hg, Zn). To the best of our knowledge, this research is the first to measure BCFs in C. linum, G. longissima, V. aegagrophyla, R. cirrhosa, highlighting a clear specie-specificity and dose-dependency of the bioconcentration behaviour of the trace elements studied.
Acknowledgements
The authors are grateful to Mauro Lenzi for his valuable support in algal species identification and to Theresa Davis for language revision.
References
- Volpi, G.A., Girardini, M., Marchetto, D. and Pantani, C. (2009) Microtox® Solid Phase Test: Effect of Diluents Used in Toxicity Test. Ecotoxicology and Environmental Safety, 72, 851-886. http://dx.doi.org/10.1016/j.ecoenv.2008.01.011
- USEPA (1974) Marine Algal Assay Procedure Bottle Test. Eutrophication and Lake Restoration Branch. National Environmental Research Center, Corvallis, Oregon, 43.
- Trainor, F.R. (1984) Indicator Algal Assays: Laboratory and Field Approaches. In: Shubert, L.E., Ed., Algae as Ecological Indicators, Academic Press, London, 3-14.
- UNI EN ISO 10253 (2006) Water Quality—Marine Algal Growth Inhibition Test with Skeletonema costatum and Phaeodactylum tricornutum.
- Giusti, E., Marsili-Libelli, S., Renzi, M. and Focardi, S. (2010) Assessment of Spatial Distribution of Submerged Vegetation in the Orbetello Lagoon by Means of a Mathematical Model. Ecological Modelling, 221, 1484-1493. http://dx.doi.org/10.1016/j.ecolmodel.2010.02.019
- Renzi, M., Guerranti, C., Giovani, A., Perra, G. and Focardi, S.E. (2013) Perfluorinated Compounds: Levels, Trophic Web Enrichments and Human Dietary Intakes in Transitional Water Ecosystems. Marine Pollution Bulletin. http://dx.doi.org/10.1016/j.marpolbul.2013.09.014
- EEC (2000) Directive 2000/60/EC of the European Parliament and of the Council Establishing a Framework for Community Action in the Field of Water Policy. OJEC L 327/1-72, Brussels.
- Lytle, J.S. and Lytle, T.F. (2001) Use of Plants for Toxicity Assessment of Estuarine Ecosystems. Environmental Toxicology and Chemistry, 20, 68-83. http://dx.doi.org/10.1002/etc.5620200107
- Geider, R.J., Roche, J.L., Greene, R.M. and Olalzola, M. (1993) Response of the Photosynthetic Apparatus of Pheodactylum tricornutum (Bacillariophyceae) to Nitrate, Phosphate or Iron Starvation. Journal of Phycology, 29, 755-766. http://dx.doi.org/10.1111/j.0022-3646.1993.00755.x
- Ronen, R. and Galun, M. (1984) Pigment Extraction from Lichens with Dimethylsulfoxide (DMSO) and Estimation of Chlorophyll Degradation. Environmental and Experimental Botany, 24, 239-245. http://dx.doi.org/10.1016/0098-8472(84)90004-2
- Renzi, M., Roselli, L., Giovani, A., Focardi, S.E. and Basset, A. (in Press) An Integrated Approach to Ecotoxicity Tests on Unicellular Algal Species: The Case Study of Phaeodactylum tricornutum, Ecotoxicology.
- Brandini, F.P., Da Silva, E.T., Pellizzari, F.P., Fonseca, A.L.O. and Fernandes, L.F. (2001) Production and Biomass Accumulation of Periphytic Diatom Growing on Glass Slides during a 1-Year Cycle in a Subtropical Estuarine Environment (Bay of Paranaguá, Southern Brazil). Marine Biology, 138, 163-171. http://dx.doi.org/10.1007/s002270000427
- Moreira, S.M., Guilhermino, L. and Ribeiro, R. (2006) An in Situ Assay with the Microalga Phaeodactylum tricornutum for Sediment-Overlying Water Toxicity Evaluations in Estuaries. Environmental Contamination and Toxicology, 25, 2272-2279. http://dx.doi.org/10.1897/05-266R.1
- Dalsgard, T. and Krause-Jensen, D. (2006) Monitoring Nutrient Release from Fish Farms with Macroalgal and Phytoplankton Bioassays. Aquaculture, 256, 302-320. http://dx.doi.org/10.1016/j.aquaculture.2006.02.047
- Macinnis-Ng, C.M.O. and Ralph, P.J. (2003) In Situ Impact of Petrochemicals on the Photosynthesis of the Seagrass Zostera capricorni. Marine Pollution Bulletin, 46, 1395-1407. http://dx.doi.org/10.1016/S0025-326X(03)00290-X
- Ralph, P.J., Gademann, R. and Dennison, W.C. (1998) In Situ Seagrass Photosynthesis Measured Using a Submersible, Pulse-Amplitude Modulated Fluorometer. Marine Biology, 132, 367-373. http://dx.doi.org/10.1007/s002270050403
- Durako, M.J. and Kunzelman, J.I. (2002) Photosynthetic Characteristics of Thalassia testudinum Measured in Situ by Pulse-Amplitude Modulated (PAM) Fluorimetry: Methodological and Scale-Based Considerations. Aquatic Botany, 73, 173-185. http://dx.doi.org/10.1016/S0304-3770(02)00020-7
- Renzi, M., Giovani, A. and Focardi, S.E. (2012) Water Pollution by Surfactants: Fluctuations Due to Tourism Exploitation in a Lagoon Ecosystem. Journal of Environmental Protection, 3, 1004-1009. http://dx.doi.org/10.4236/jep.2012.39116
- Renzi, M., Perra, G., Guerranti, C., Mariottini, M., Baroni, D., Volterrani, M., Graziosi, M., Specchiulli, A. and Focardi, S. (2009) Assessment of Environmental Pollutants in Ten Southern-Italian Harbours Sediments. Toxicology and Industrial Health, 25, 351-363. http://dx.doi.org/10.1177/0748233709104868
- Renzi, M., Tozzi, A., Baroni, D. and Focardi, S. (2011) Factors Affecting the Distribution of Trace Elements in Harbour Sediments. Chemistry and Ecology, 27, 235-250. http://dx.doi.org/10.1080/02757540.2010.547483
- Cantarero, S., Camino-Sánchez, F.J., Zafra-Gómez, A., Ballesteros, O., Navalón, A., Vílchez, J.L., Verge, C., Reis, M.S. and Saraiva, P.M. (2012) Evaluation of the Presence of Major Anionic Surfactants in Marine Sediments. Marine Pollution Bulletin, 64, 587-594. http://dx.doi.org/10.1016/j.marpolbul.2011.12.015
- Meyer, J.S., Davidson, W., Sundby, B., Oris, J.T., Lauren, D.J., Forstner, U., Hong, J. and Crosby, D.G.S. (1994) The Effects of Variable Redox Potentials, pH, and Light on Bioavailability in Dynamic Water-Sediment Environments. In: Landrum, P.F., Bergman, H.L. and Benson, W.H., Eds., Bioavailability, Physical, Chemical, and Biological Interactions, Lewis Publications, Boca Raton, 155-170.
- Bradley, J.C. (2004) Toxicity of Anionic Surfactants in a Primary Effluent: Identification, Characterization and Removal. Thesis of Master of Applied Science. http://hdl.handle.net/2429/15492
- OECD (1996) Bioconcentration: Flow-Through Fish Test. OECD Guidelines for the Testing Chemicals No. 305E and Compliance Monitoring No. 1. Organization for Economic Co-Operation and Development, Paris, 41.
- Wellburn, A.R. (1994) The Spectral Determination of Chlorophylls A and B, as Well as Total Carotenoids, Using Various Solvents with Spectrophotometers of Different Resolution. Journal of Plant Physics, 144, 307-313. http://dx.doi.org/10.1016/S0176-1617(11)81192-2
- Crippen, R.W. and Perrier, J.L. (1974) The Use of Neutral Red and Evan’s Blue for Live-Dead Determination of Marine Phytoplankton. Stain Technology, 49, 97-104.
- Gallagher, J.C. (1984) Patterns of Cell Viability in the Diatoms, Skeletonema costatum in Batch Culture and in Natural Populations. Estuaries, 7, 98-101. http://dx.doi.org/10.2307/1351960
- USEPA (SW-846) (1996) Test Methods for Evaluating Solid Waste, Physical/Chemical Methods, Method 3051A, “Microwave Assisted Acid Digestion of Sediments, Sludge, Soils and Oils”. Office of Solid Waste, Washington DC.
- USEPA (SW-846) (1996) Test Methods for Evaluating Solid Waste, Physical/Chemical Methods, Method 6010B “Inductively Coupled Plasma-Atomic Emission Spectrometry”. Office of Solid Waste, Washington DC.
- US-EPA (1996) SW-846, Test Methods for Evaluating Solid Waste, Physical/Chemical Methods, Method 7473 Mercury in Solids and Solutions by Thermal Decomposition, Amalgamation, and Atomic Absorption Spectrophotometry. Office of Solid Waste, Washington DC.
- USEPA (1996) Fish BCF. US Environmental Protection Agency, Washington DC.
- Mohammady, N.G.E.D., Chen, Y.C., El-Mahdy, A.E.R.A. and Mohammad, R.F. (2005) Temporal Alterations of Nannochloropsis salina (Eustigmatophyceae) Grown under Aqueous Diesel Fuel Stress. Journal of Applied Phycology, 17, 161-170. http://dx.doi.org/10.1007/s10811-005-5510-y
- Bacci, E. (1996) Ecotoxicology of Organic Contaminants. Elsevier, Amsterdam, 150 p.
- Truhaut, R. (1975) Ecotoxicology—A New Branch of Toxicology: A General Survey of Its Aims, Methods and Prospects. In: McIntyre, A.D. and Mills, C.F., Eds., Ecological Toxicology Research, Plenum Press, New York, 3-23. http://dx.doi.org/10.1007/978-1-4615-8945-7_1
- Jochem, F.J. (2000) Probing the Physiological State of Phytoplankton at Single Cell Level. Scientia Marina, 64, 183- 195.
- Stauber, J.L., Franklin, N.M. and Adams, M.S. (2002) Applications of Flow Cytometry to Ecotoxicity Testing Using Microalgae. Trends in Biotechnology, 20, 141-143. http://dx.doi.org/10.1016/S0167-7799(01)01924-2
- Eisentraeger, A., Klein, W. and Hahn, J.S. (2003) Comparative Studies on Algal Toxicity Testing Using Fluorometric Microplate and Erlenmeyer Flask Growth Inhibition Assays. Ecotoxicology and Environmental Safety, 54, 346-354. http://dx.doi.org/10.1016/S0147-6513(02)00099-4
- Moreira-Santos, M., Soares, A.M. and Ribeiro, R. (2004) A Phytoplankton Growth Assay for Routine in Situ Environmental Assessments. Environmental Toxicology and Chemistry, 23, 1549-1560. http://dx.doi.org/10.1897/03-389
- Costanza, R., d’Arge, R., de Groot, R., Farber, S., Grasso, M., Hannon, B., Limburg, K., Naeem, S., O‘Neill, R.V., Paruelo, J., Raskin, R.G. and Sutton, P. (1997) The Value of the World’s Ecosystem Services and Natural Capital. Nature, 387, 253-260. http://dx.doi.org/10.1038/387253a0
- Boudouresque, C.F. and Meinesz, A. (1982) Découverte de l’herbier de Posidonies. Cahier Parc nation. Port-Cros, 4, 1-79.
- Clarke, S.M. and Kirkman, H. (1989) Seagrasss Dynamics. In: Larkum, A.W.D., McComb, A.J. and Shepherd, S.A., Eds., Biology of Seagrasses, Vol. 2, Aquatic Plant Studies, 610-634.
- Decree Law n. 152 (2006) Norme in materia ambientale. Gazzetta Ufficiale n. 88, 14th 2006-Supplemento Ordinario n. 96. Document in Italian Language.
- Orfanidis, S., Papathanasiou, V., Sabetta, L., Pinna, M., Gigi, V., Gounaris, S., Tsiagga, E., Nakou, K. and Theodosiou, T.H. (2007) Benthic Macrophyte Communities as Bioindicators of Transitional and Coastal Waters: Relevant Approaches and Tools. Transitional Waters Bulletin, 3, 45-49.
- Streiber, U., Muller, J.F., Haugg, A. and Gademann, R. (2002) New Type of Dual-Channel PAM Chlorophyll Fluorometer for Highly Sensitive Water Toxicity Biotests. Photosynthesis Research, 74, 317-330. http://dx.doi.org/10.1023/A:1021276003145
- Katsumata, M., Koike, T., Nishikawa, M., Kazumura, K. and Tsuchiya, H. (2006) Rapid Ecotoxicological Bioassay Using Delayed Fluorescence in the Green Alga Pseudokirchneriella subcapitata. Water Research, 40, 3393-3400. http://dx.doi.org/10.1016/j.watres.2006.07.016
- Yamane, A., Okada, M. and Sudo, R. (1984) The Growth Inhibition of Planktonic Algae Due to Surfactants Used in Washing Agents. Water Research, 18, 1101-1105. http://dx.doi.org/10.1016/0043-1354(84)90224-0
- Nyberg, H. (1988) Growth of Selenastrum capricornutum in the Presence of Synthetic Surfactants. Water Research, 22, 217-223. http://dx.doi.org/10.1016/0043-1354(88)90081-4
- Dirilgen, N. and Ince, N. (1994) Inhibition Effect of Anionic Surfactant SDS on Duckweed, Lemna minor with Considerations of Growth and Accumulation. Chemosphere, 31, 4185-4196. http://dx.doi.org/10.1016/0045-6535(95)80017-F
- Pergent-Martini, C. and Le Ravallec, C. (2007) Guidelines for Impact Assessment on Seagrass Meadows. Regional Activity Centre for Specially Protected Areas (RAC/SPA) Boulevard du leader Yasser Arafat B.P. 337-1080 Tunis CEDEX, 48.
- Stauber, J.L. and Florence, T.M. (1990) Mechanisms of Toxicity of Zinc to the Marine Diatom Nitzschia closterium. Marine Biology, 105, 519-524. http://dx.doi.org/10.1007/BF01316323
- Nguyen-Deroche, T.L.N., Le, T.T., Bui, T.V., Rincé, Y., Tremblin, G. and Morant-Manceau, A. (2009) Effects of Copper on Growth and Photosynthesis in Marine Diatoms: A Comparison between Species from Two Different Geographical Areas. Cryptogamie Algologie, 30, 97-109.
- Li, M., Hu, C., Zhu, Q., Chen, L., Kong, Z. and Liu, Z. (2006) Copper and Zinc Induction of Lipid Peroxidation and Effects on Antioxidant Enzyme Activities in the Microalga Pavlova viridis (Prymnesiophyceae). Chemosphere, 62, 565-572. http://dx.doi.org/10.1016/j.chemosphere.2005.06.029
- Rijstenbil, J.W. (2003) Effects of UVB Radiation and Salt Stress on Growth, Pigments and Antioxidative Defence of the Marine Diatom Cylindrotheca closterium. Marine Ecology Progress Series, 254, 37-48. http://dx.doi.org/10.3354/meps254037
- Steeman-Nielsen, L. and Wium Andersen, S. (1971) The Influence of Cu on Photosynthesis and Growth in Diatoms. Physiologia Plantarum, 24, 480-484. http://dx.doi.org/10.1111/j.1399-3054.1971.tb03522.x
- Rai, L.C., Gaur, J.P. and Kumar, H.D. (1981) Phycology and Heavy Metal Pollution. Biological Reviews, 56, 99-151. http://dx.doi.org/10.1111/j.1469-185X.1981.tb00345.x
- Sunda, G.W. and Huntsman, S.A. (1983) Effect of Competitive Interactions between Manganese and Copper on Cellular Manganese and Growth in Estuarine and Oceanic Species of the Diatom Thalassiosira. Limnology and Oceanography, 28, 924-934. http://dx.doi.org/10.4319/lo.1983.28.5.0924
- Monnier-Besombes, G. (1983) Etude de la contamination de la Posidonie (Posidonia oceanica L. Delile) et de son milieu par des composants de détergents synthétiques. Thèse Doct. 3ème cycle Ecol., Univ. Aix-Marseille II, Fr., 1-162.
- Brinkhuis, B.H., Penello, W.F. and Churchill, A.C. (1980) Cadmium and Manganese Flux in Eelgrass Zoostera marina II. Metal Uptake by Leaf and Root-Rhizome Tissues. Marine Biology, 58, 187-196. http://dx.doi.org/10.1007/BF00391875
- Ward, T.J. (1987) Temporal Variation of Metals in the Seagrass Posidonia australis and Its Potential as a Sentinel Accumulator near a Lead Smelter. Marine Biology, 95, 315-321. http://dx.doi.org/10.1007/BF00409019
- Ward, T.J. (1989) The Accumulation and Effects of Metals in Seagrasses Habitats. In: Larkum, A.W.D., McComb, A.J. and Shepherd, S.A., Eds., Biology of Seagrasses, Elsevier, Amsterdam, 797-820.
- Schlacher-Hoenlinger, M.A. and Schlacher, T.A. (1998) Accumulation, Contamination and Seasonal Variability of Trace Metals in the Coastal Zone—Patterns in a Seagrass Meadow from the Mediterranean. Marine Biology, 131, 401- 410. http://dx.doi.org/10.1007/s002270050333
- Arnot, J.A. and Gobas, F.A.P.C. (2006) A Review of Bioconcentration Factor (BCF) and Bioaccumulation Factor (BAF) Assessments for Organic Chemicals in Aquatic Organisms. Environmental Reviews, 14, 257-297.