Smart Grid and Renewable Energy
Vol.1 No.3(2010), Article ID:3328,12 pages DOI:10.4236/sgre.2010.13021
Optimal Placement of Multi DG Units Including Different Load Models Using PSO
![]()
Arab Academy for Science & Technology, Faculty of Engineering & Technology, Department of Electrical & Control Engineering
Email: Amanyelz@yahoo.com
Received November 4th, 2010; revised November 28th, 2010; accepted December 4th, 2010
Keywords: Particle Swarm Optimization (PSO), Optimal Placement, Distributed Generation (DG), Load Models, Impact Indices, Short Circuit Level, Voltage Stability
ABSTRACT
This paper proposes a multi-objective index-based approach to optimally determine the size and location of multi-distributed generators (DG) units in distribution system with different load models. It is shown that load models can significantly affect the optimal location and sizing of DG resources in distribution systems. The proposed multi-objective function to be optimized includes a short circuit level parameter to represent the protective device requirements. The proposed function also considers a wide range of technical issues such as active and reactive power losses of the system, the voltage profile, the line loading and the MVA intake by the grid. The optimization technique based on particle swarm optimization (PSO) is introduced. The analysis of continuation power flow to determine the effect of DG units on the most sensitive buses to voltage collapse is carried out. The proposed algorithm is tested using the 38-bus radial system and the IEEE 30-bus meshed system. The results show the effectiveness of the proposed algorithm.
1. Introduction
The newly introduced distributed or decentralized generation units connected to local distribution systems are not dispatchable by central operator, but they can have a significant impact on the power flow, voltage profile, stability, continuity, short circuit level and quality of power supply for customers and electricity suppliers. Optimization techniques should be employed for deregulation of power industry, allowing for the best allocation of the DG.
There are many approaches for deciding the optimum sizing and siting of distributed generation units in distribution systems. In [1-3], the authors determined the optimum locations of DG in the distribution network. The work aimed to study several factors related to the network and the DG unit itself such as the overall system efficiency, system reliability, voltage profile, load variation, network losses and the DG loss adjustment factors. In [4], the authors aimed to determine the optimal sizing of a small isolated power system that contains renewable and/or conventional energy technologies to minimize the system’s cost of energy.
In [5-9], the authors succeeded in merging both the DG location and size in one optimization problem. The main factors included in the optimization problem were investment cost, operation cost, network configuration, active and reactive power costs, heat and power requirements, voltage profile and system losses. Several methods have been adopted to solve such an optimization problem. Some of them rely on conventional optimization methods and others use artificial intelligent based optimization methods.
In some researches, the optimum location and size of a single DG unit is determined [5,10-13] in others the optimum locations and sizes of multiple DG units are determined [6, 14-16].
In [3], a mixed integer linear program was formulated to solve the optimization problem. The objective was to optimally determine the DG plant mix on a network section. In [4], authors proposed a tabu search (TS) based method to find the optimal solution of their problem. In [5], authors proposed a PSO algorithm to determine the optimum size and location of a single DG unit to minimize the real power losses of the system. The problem was formulated as one of the constrained mixed integer nonlinear programming with the location being discrete and the size being continuous. In [6], different scenarios were suggested for optimum distribution planning. One of these scenarios was to place multiple DG units at certain locations pre-determined by the Electric Utility Distribution Companies (DISCOs) aiming to improve their profiles and minimize the investment risk. In [7], a GA based technique along with optimal power flow (OPF) calculations were used to determine the optimum size and location of DG units installed to the system in order to minimize the cost of active and reactive power generation. In [8], the primal-dual interior-point optimization procedure was employed to identify the optimal location and size of DG units introduced to the system. In [9], sensitivity analysis of power losses in terms of DG size, location and operating point has been performed to find the optimal size and location of DG units. In [10], authors used an optimization technique based on genetic algorithm (GA). Their objective was to minimize a multiobjective performance index function. The indices were reflecting the effect of DG insertion on real and reactive power losses of the system, the voltage profile and the distribution line loading. Different load models were taken into consideration. In [11], authors proposed an analytical method to determine the optimum locationsize pair of a DG unit in order to minimize only the line losses of the power system. In [12], authors used an exhaustive search algorithm to optimally locate and size a single DG unit in a meshed system taking into consideration the system losses and short circuit level. In [13], the authors studied the impact of placing a DG unit of certain size at each node of the system on the system indices representing system losses, voltage profile, line loading capacity and short circuit level. As for placing multiple DG units many researches were presented. In [14], authors used a GA based algorithm to determine the optimum size and location of multiple DG units to minimize the system losses and the power supplied by the main grid taking into account the limits of the voltage at each node of the system. P-V curves have been traditionally used as graphical tools for studying voltage stability in electric power systems. The overall impact of a DG unit on voltage stability is positive. This is due to the improved voltage profiles as well as decreased reactive power losses. In [15], authors placed DG units at the most sensitive buses to voltage collapse. The units had the same capacity and were placed one by one. In [16], a GAbased algorithm was presented to locate multiple DG units to minimize a cost function including the system losses and service interruption costs.
All mentioned researches placed DG units with unity power factor. In [17], PSO was used to place multiple DG units with non unity power factor but the objective was to minimize only the real power loss of the system.
In this paper, all factors, indices and objective functions are gathered to form a multiobjective optimization problem. The placement of multiple DG units with unspecified power factor taking into account different load models is considered. The optimization problem is solved using particle swarm optimization (PSO) technique which is capable of finding global or near global optimum solution in addition to its very short simulation time compared with other artificial intelligence techniques such as genetic algorithm (GA), tabu search (TS) or simulated annealing (SA). Although GA, for example, is very sufficient in finding global or near global optimal solution of the problem, it requires a very long run time that may be several minutes or even several hours depending on the size of the system under study. Particle swarm optimization (PSO), first introduced by Kennedy and Eberhart, is one of the modern heuristic algorithms. It was developed through simulation of a simplified social system, and has been found to be robust in solving continuous nonlinear optimization problems [18,19]. The PSO technique can generate a high quality solution within shorter calculation time and stable convergence characteristic than other stochastic methods [20]. PSO has been motivated by the behavior of organisms, such as fish schooling and bird flocking. Generally, PSO is characterized as a simple concept, easy to implement, and computationally efficient. Unlike the other heuristic techniques, PSO has a flexible and well-balanced mechanism to enhance the global and local exploration abilities.
The proposed algorithm was applied to two test systems, the radial 38-bus system [10] and the mesh IEEE 30-bus system [21]. The algorithm is built using MATLAB script functions. A continuation power flow is carried out to determine the effect of DG units on the voltage stability limits using the Power System Analysis Toolbox (PSAT) [22].
2. Load Models and Impact Indices
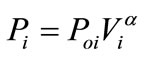
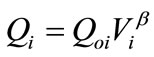
The optimal allocation and sizing of DG units under different voltage dependent load models scenarios are to be investigated. Practical voltage dependent load models, i.e. residential, industrial and commercial have been adopted for investigations. The load models can be mathematically expressed as [10]
 (1)
(1)
 (2)
(2)
where Pi and Qi are real and reactive power at bus i, Poi and Qoi are active and reactive operating point at bus i, Vi is voltage at bus i, and α and β are real and reactive power exponents. In a constant power model conventionally used in power flow studies, α = β = 0 is assumed. The values of the real and reactive exponents used in the present work for industrial, residential and commercial loads are given in Table 1 [10].
In the practical situations, loads are mixture of different load types depending on the nature of area being supplied. Therefore, a load class mix of residential, industrial and commercial load is to be investigated too where every bus of the system has different type of load connected to it.
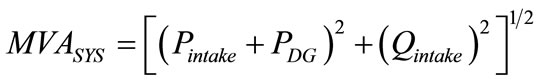
There are various technical issues that need to be addressed when considering the presence of distributed generators in distribution systems. Ochoa et al. [13] computed several indices in order to describe the impacts on distribution system due to the presence of distributed generation during maximum power generation. The studies are presented for each of these load models. The MVAsys is the total MVA intake by the DISCO and is defined as
 (3)
(3)
where Pintake and Qintake are the real and reactive power intake from the grid and PDG is the power generated by the DG units.
In this work several indices will be computed in order to describe the effect of load models due to the presence of DG. These indices are defined as follows:
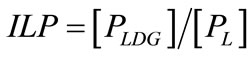
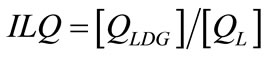
1) Real and Reactive Power Loss Indices (ILP and ILQ): The real and reactive power loss indices are defined as
 (4)
(4)
 (5)
(5)
where PLDG and QLDG are the real and reactive power losses of the distribution system after inclusion of DG. PL and QL are the real and reactive system losses without DG in the distribution system.
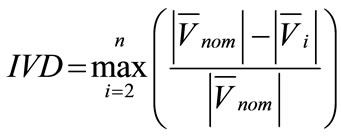
2) Voltage Profile Index (IVD): One of the advantages of proper location and size of the DG is the improvement in voltage profile. This index penalizes the size-location pair which gives higher voltage deviations from the nominal value (Vnom). In this way, closer the index to zero better is the network performance. The IVD can be defined as
 (6)
(6)
where n is the number of buses.
Normally, the voltage limits (Vmin ≤ Vi ≤ Vmax) at a particular bus is taken as technical constraint, and thus
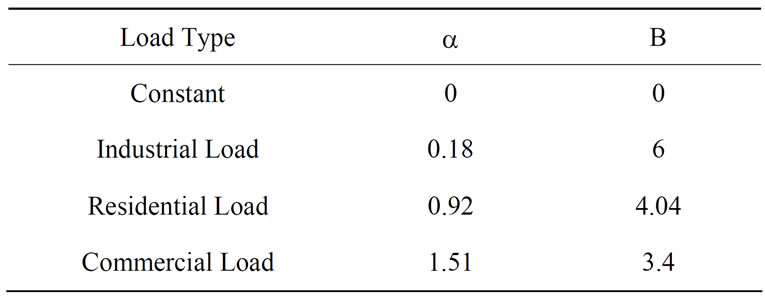
Table 1. Load types and exponent values.
the value of the IVD is normally small and within the permissible limits.
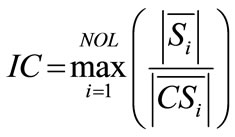
3) MVA Capacity Index (IC): As a consequence of supplying power near to loads, MVA flows may diminish in some sections of the network, thus releasing more capacity, but in other sections they may also increase to levels beyond distribution line limits (if line limits are not taken as constraints). The index (IC) gives important information about the level of MVA flow/currents through the network regarding the maximum capacity of conductors. This gives the information about need of system line upgrades. Values higher than unity (calculated MVA flow values higher than the MVA capacity) of the index given the amount of capacity violation in term of line flow, whereas the lower values indicated the capacity available
 (7)
(7)
where NOL is the number of lines, Si is the MVA flow in line i and CSi is the MVA capacity of line i.
The benefit of placing DG in a system in context of line capacity released is measured by finding the difference in IC between system with and without DG. The avoidance of flow near to the flow limits is an important criterion as it indicates that how earlier the system needs to be upgraded and thus adding to the cost. Normally, the limits (Si ≤ Si,max) at a particular line is taken as a strict constraint.
4) Short Circuit Level Index (ISC): This index is related to the protection and sensitivity issues since it evaluates the short circuit current at each bus with and without DG [12,13].
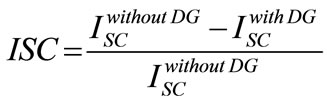 (8)
(8)
Where  is the short circuit current before installing the DG and
  is the short circuit current after installing the DG.
3. Particle Swarm Optimization
In this paper a PSO technique is developed to find the best solution of the multiobjective problem of placing and sizing of multiple DG units.
PSO is one of the optimization techniques and belongs to evolutionary computation techniques [18,23,24]. The method has been developed through a simulation of simplified social models. The features of the method are as follows:
1) The method is based on researches on swarms such as fish schooling and bird flocking.
2) It is based on a simple concept. Therefore, the computation time is short and it requires few memories.
According to the research results for bird flocking, birds are finding food by flocking (not by each individual). It leaded the assumption that information is owned jointly in flocking. According to observation of behavior of human groups, behavior pattern on each individual is based on several behavior patterns authorized by the groups such as customs and the experiences by each individual (agent). The assumptions are basic concepts of PSO.
PSO is basically developed through simulation of bird flocking in two-dimension space. The position of each individual (agent) is represented by XY axis position and also the velocity is expressed by vx (the velocity of X axis) and vy (the velocity of Y axis). Modification of the agent position is realized by the position and velocity information.
An optimization technique based on the above concept can be described as follows: namely, bird flocking optimizes a certain objective function. Each agent knows its best value so far (pbest) and its XY position. Moreover, each agent knows the best value so far in the group (gbest) among pbests. Each agent tries to modify its position using the following information:
• the current positions (x,y)
• the current velocities (vx,vy)
• the distance between the current position, and pbest and gbest.
This modification can be represented by the concept of velocity. Velocity of each agent can be modified by the following equation:
 (9)
(9)
where, vik: velocity of agent i at iteration kw: weighting functioncj: weighting factorrand: random number between 0 and 1,
 : current position of agent i at iteration kpbesti: pbest of agent igbest: gbest of group.
Using the above equation, a certain velocity, which gradually gets close to pbest and gbest can be calculated. The current position (searching point in the solution space) can be modified by the following equation:
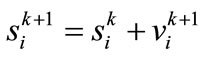 (10)
(10)
Figure 1 shows a searching concept with agents in a solution space and Figure 2 shows a concept of modification of a searching point by PSO.
4. Multiobjective-Based Problem Formulation
The multiobjective index for the performance calculation of distribution systems for DG size and location planning with load models considers all previous mentioned indices by giving a weight to each index.
The PSO-based multiobjective function (MOF) is given by
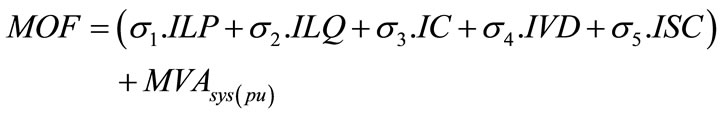 (11)
(11)
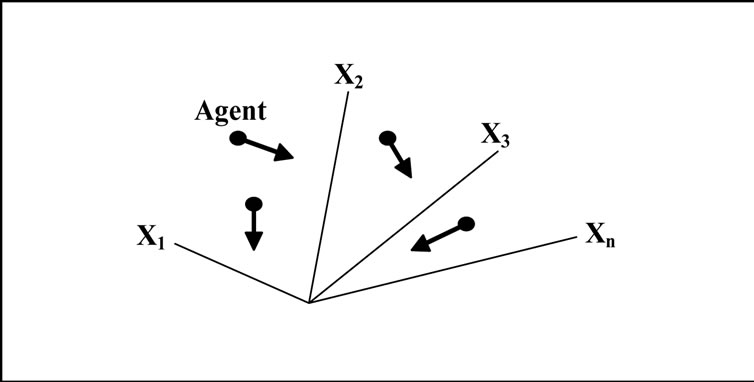
Figure 1. Searching concept with agents in a solution space by PSO.
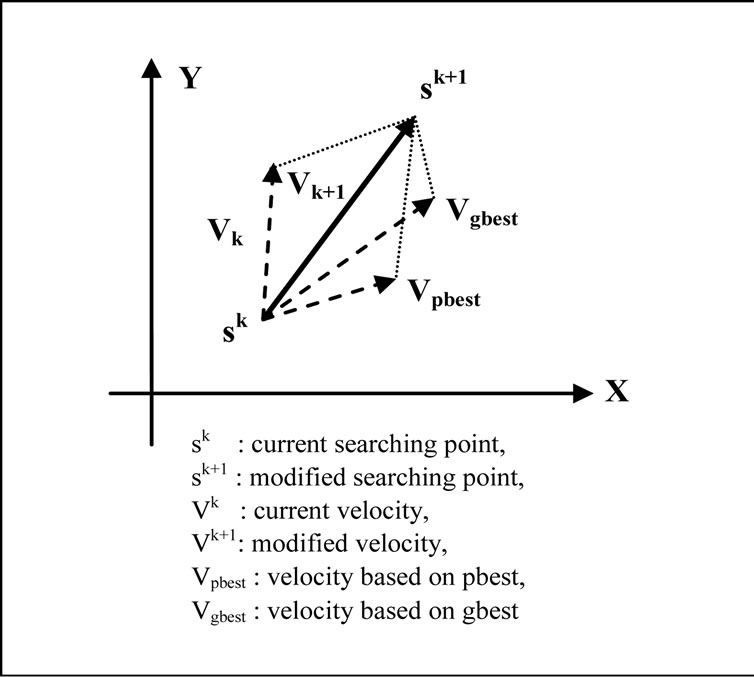
Figure 2. Concept of modification of a searching point by PSO.
where MVAsys(pu) is the total intake form the grid in per unit and
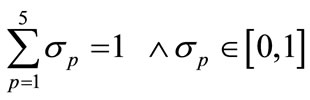 (12)
(12)
These weights are indicated to give the corresponding importance to each impact indices for the penetration of DG with load models and depend on the required analysis (e.g., planning, operation, etc.).
The weighted normalized indices used as the components of the objective function are due to the fact that the indices get their weights by translating their impacts in terms of cost. It is desirable if the total cost is decreased. Table 2 shows the values for the weights used in present work, considering normal operation analysis and are selected guided by the weights in [10] and [13]. However, these values may vary according to engineer’s concerns. For this analysis, active losses have the higher weight (0.3) since it is important in many applications of DG. The current capacity index (IC) has the second major (0.25) since it gives important information about the level of currents through the network regarding the maximum capacity of conductors in distribution systems. Protection and selectivity impact (ISC) received weighting of 0.15 since it evaluates important reliability problems that DG presents in distribution networks. The behavior of voltage profile (IVD) receives a weight of 0.1 due to its power quality impact.
The multiobjective function (11) is minimized subjected to various operational constraints to satisfy the electrical requirements for distribution network. These constraints are the following.
1) Power-Conservation Limits: The algebraic sum of all incoming and outgoing power including line losses over the whole distribution network and power generated from DG unit should be equal to zero.
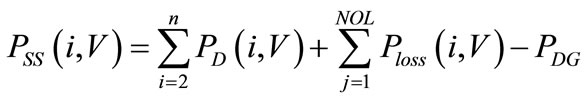 (12)
(12)
where NOL = no. of lines, PD = power demand (MW).
2) Distribution Line Capacity Limits: Power flow through any distribution line must not exceed the thermal capacity of the line
 (13)
(13)
3) Voltage Limits: the voltage limits depend on the voltage regulation limits provided by the DISCO
 (14)
(14)
The implementation of PSO starts by random generation of an initial population of possible solutions. For each solution, a size-location pairs of the DG units introduced to the system are chosen within technical limits
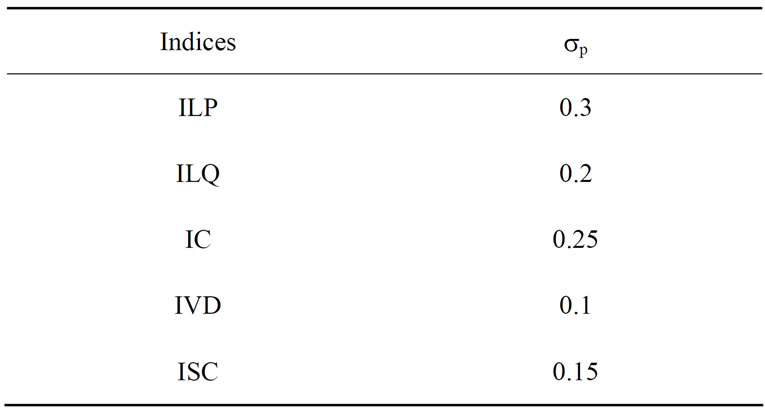
Table 2. Indices weights.
of locations and sizes of the DG units. Each solution must satisfy the operational constraints represented by equations (12), (13) and (14). If one of these constraints is violated, such solution is rejected. After generating a population of solutions satisfying the pre-specified constraints, the objective function of each solution (individual) is evaluated.
Once the population cycle is initialized, the position of each individual in the solution space is modified using the PSO parameters, e.g. pbest, gbest and the agent velocity, to generate the new population. If the DG size and/or location exceed the limit, they are adjusted back within the specified limits. The operational constraints are then checked. If any of them is violated the new solution is rejected. The algorithm stops when the maximum number of generation is reached. According to the PSO theory, the optimal is the best solution ever found throughout the generations (gbest).
To validate the proposed method, it is applied to the 38 -bus system of reference [10] under the same load conditions and using the same objective function (IMO) and same values of indices weights used in [10] to optimally place one DG unit in the system.
The results of applying the proposed PSO to the system under different load conditions and the results given in [10] through applying the GA are given in Table 3. It must be noted that the run time of the PSO algorithm ranged from 10-20 seconds which is relatively a very short time.
As shown in Table 3, for all load models, all the indices are much reduced when using PSO for problem solution compared with their values resulted when using GA in [10] except the IC index. From the values of the IC index it can be concluded that the line loading with the resulted size-location pairs was higher than that of [10] but still within rated limits. However, the overall objective function (IMO) was reduced as well.
From the previous results, it can be concluded that the proposed PSO method is an efficient method to deal with the problem introduced in this work.
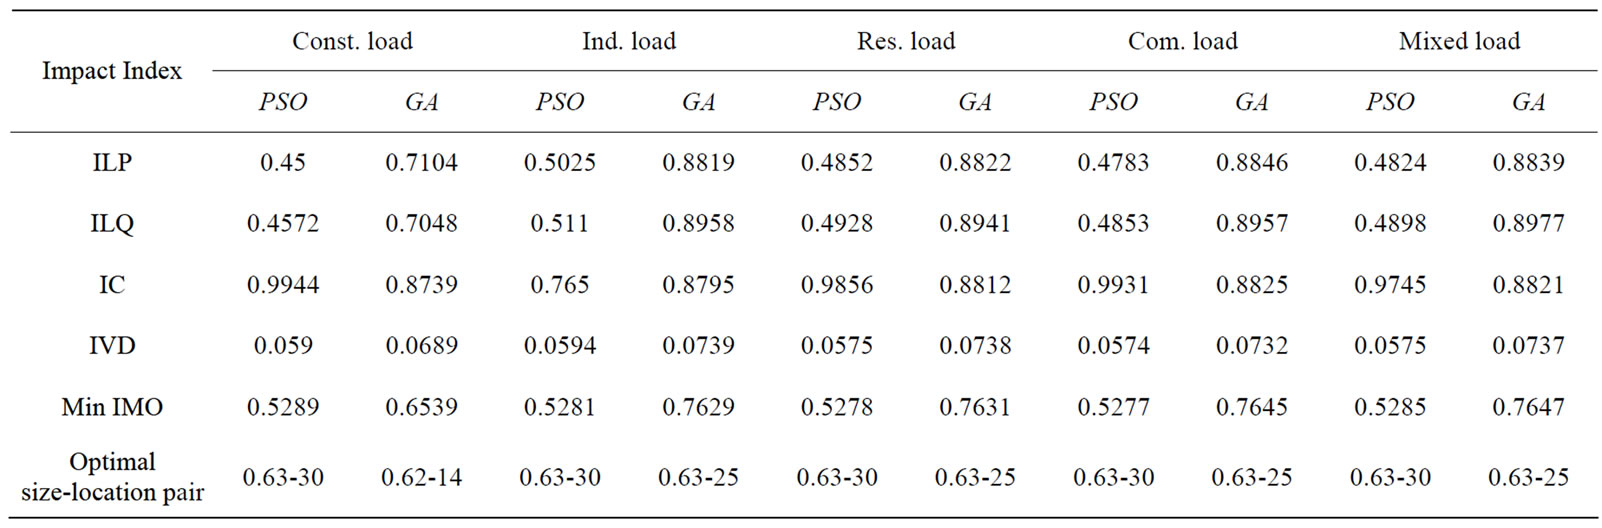
Table 3. Impact indices for penetration of DG unit in the 38-bus system with load models using PSO and GA.
5. Simulation Results and Analysis
The proposed algorithm is tested using both 38-bus radial test system [10] and IEEE 30-bus mesh test system [21]. The base values used are 100 MVA and 23 kV. A DG size is considered in a range of 0 to 0.63 pu. In this paper it is considered that the DG is operated at an unspecified power factor unlike what was commonly used in literature.
First bus is considered as feeder of electric power from generation/transmission network. Remaining buses of distribution system except the voltage controlled buses are considered for the placement of a DG of given size from the range considered. Real and reactive loads were modeled as voltage dependent.
5.1. Case 1: 38-Bus Radial System
The proposed PSO based algorithm is applied to the 38- bus test system to determine the optimal size and location of distributed generation units such that the multiobjective function given in (11) is minimized. The system line data and load data are given in [10]. For this test system, 3 DG units are optimally sized and placed. The proposed system is applied at different load models. The size and location of each DG unit under different load models are given in Table 4.
The multiobjective function optimally minimized under different load models is shown in Figure 3. The parameters used for PSO in all cases were a population size of 15 and a maximum iteration of 25. As shown in figure, the objective function reached a near global minimum and stayed there till the end of iterations.
The value of the MOF and the impact of optimal placement and sizing of DG units on the active and reactive power losses of the system and the total MVA intake from the grid are given in Table 5.
It is shown that the optimal placement of DG units in the system caused a reduction in both power losses and
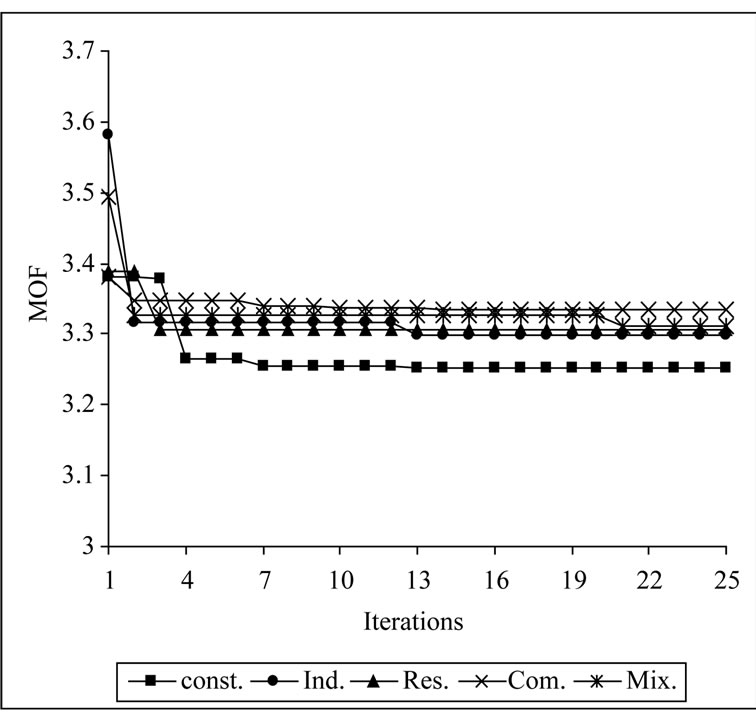
Figure 3. The multiobjective function optimally minimized under different load models.
MVA intake from the grid. The reduction in real power loss was in the range of 54% up to 67%. The reduction in reactive power loss was in the range of 58% up to 67%. The reduction in the total MVA intake was in the range of about 30%.
The effect of inserting DG units in the system on the voltage profile, line flow and the short circuit level is shown in Figures 4, 5 and 6, respectively.
Figure 4 shows the improvement in voltage profile under different load models. As shown in figure the voltage at all buses before inserting DG units to the system is higher than 0.95 pu except at buses 18 and 37 in the case of constant load model. Due to the insertion of DG units, the voltage profile significantly improved for all studied load models. As shown in Figure 4, the voltage at bus 18 during the constant load was raised to 0.99 pu.
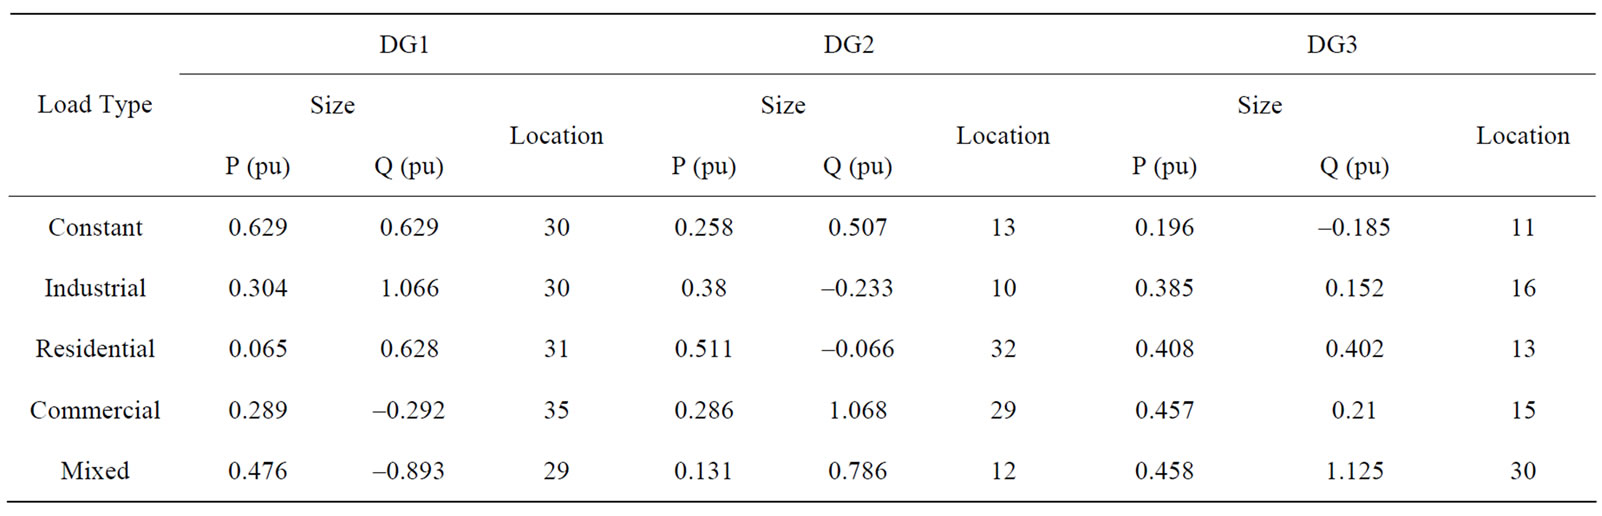
Table 4. Size and location of DG units in 38-bus radial system.
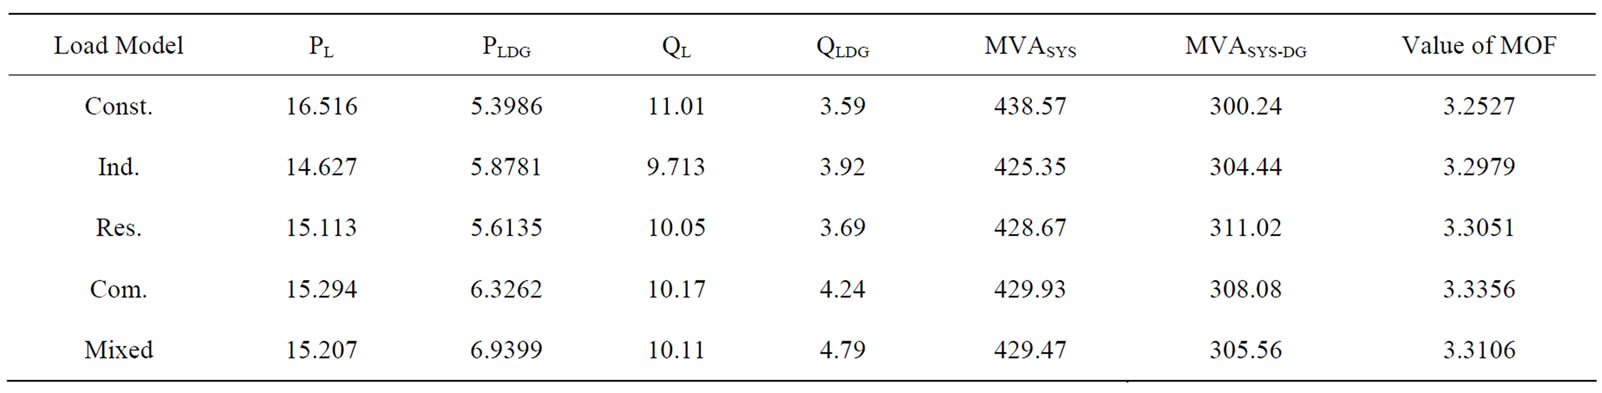
Table 5. System power losses and MVA intake at different load models in 38-bus radial system and the value of the MOF.
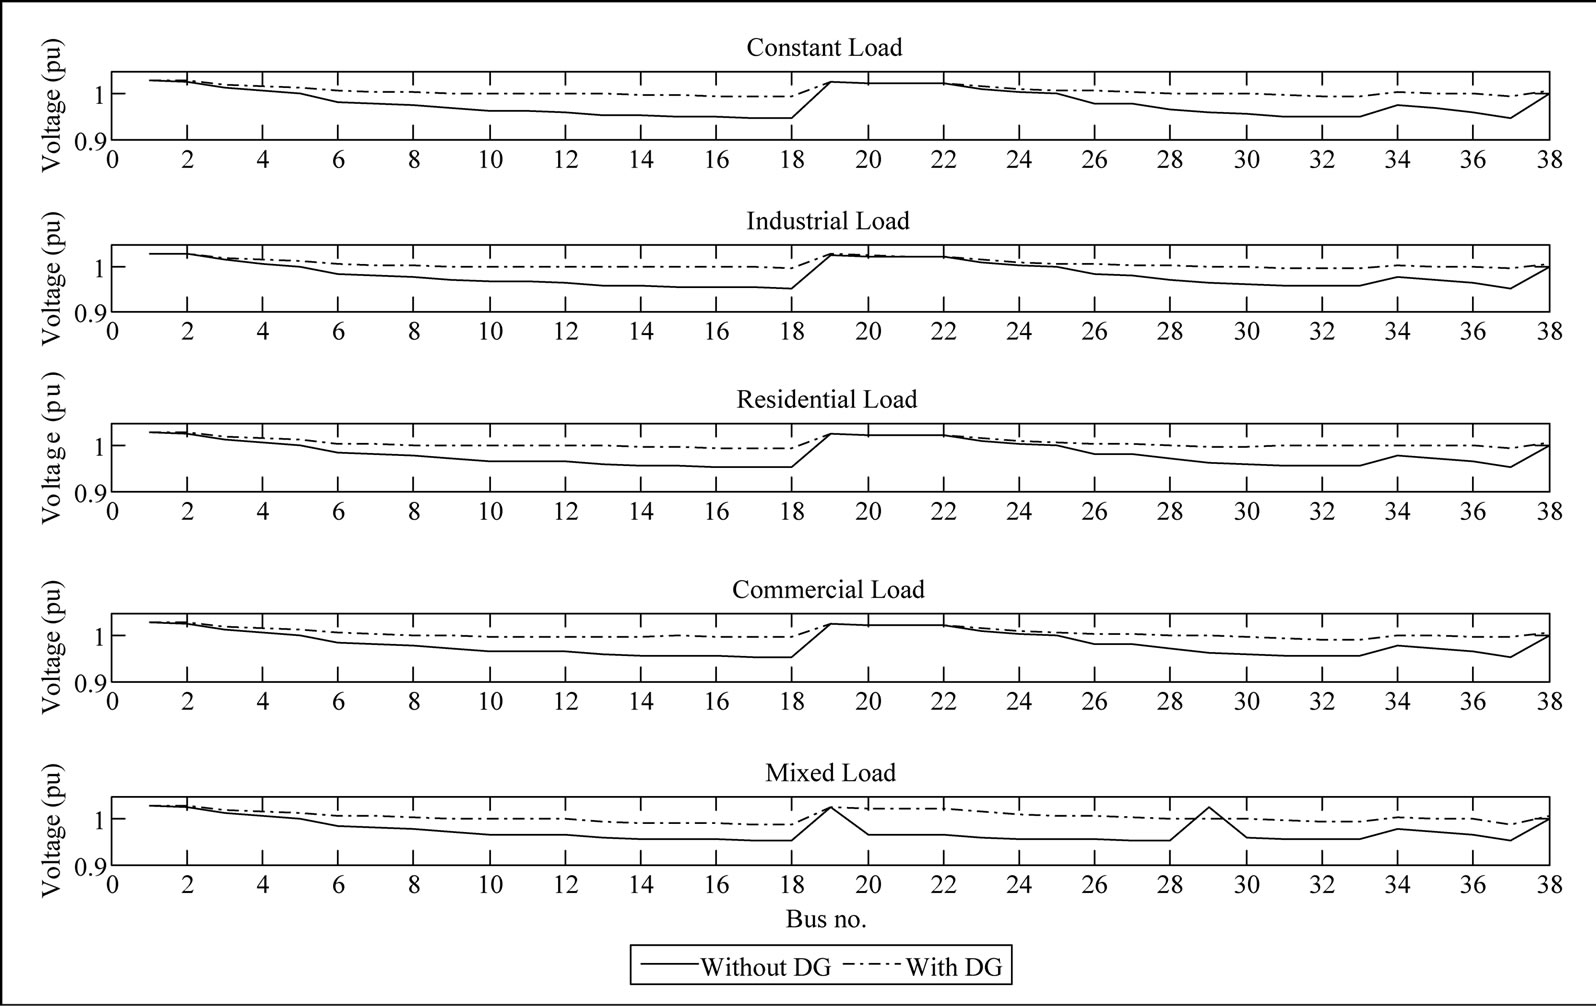
Figure 4. The voltage profile under different load models.
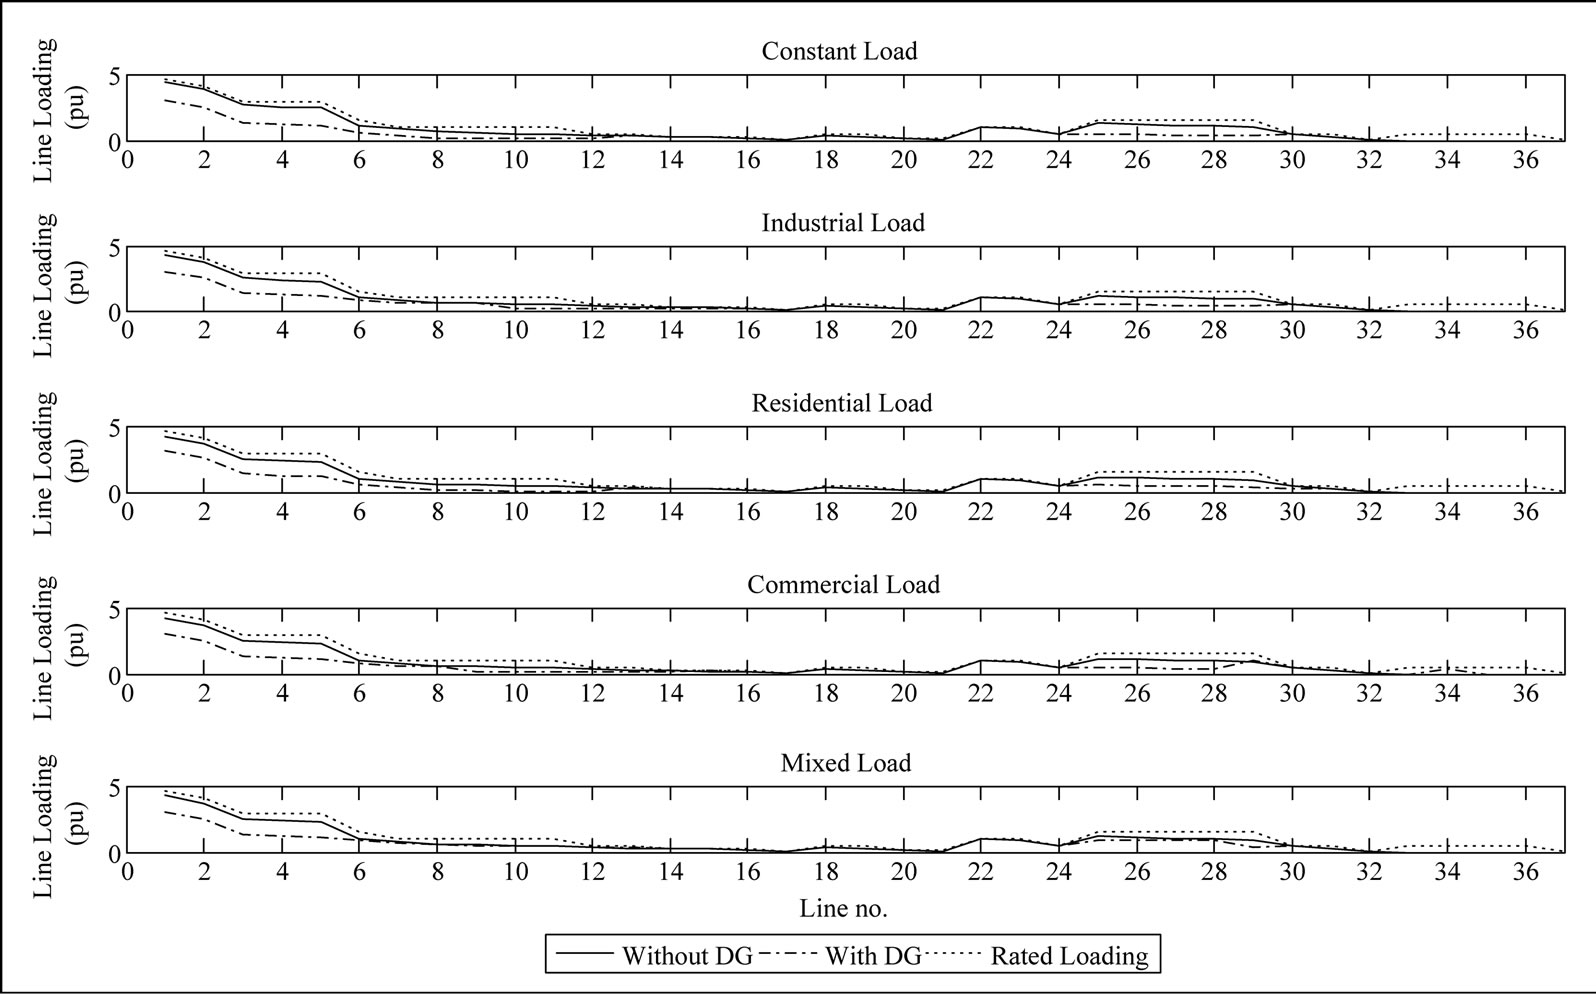
Figure 5. The line loading under different load models.
Figure 5 shows the line loading of the system with and without DG. It is clear that for most of the lines the loading decreased while for some lines it was kept the same or increased but still within line loading limits.
As a result of the placement of DG units in the system, the short circuit level at most of the system buses was increased. Figure 6 shows the difference between the short circuit level at each bus of the system with and without DG as a percent of the value of short circuit level before placement of DG units in the system. As shown in figure, the maximum increase is very low where a maximum difference of 3.92% occurred in case of industrial load model and it happened at bus 37.
Running the continuation power flow using the PSAT for the system with and without DG units and recording the PV curve at the weakest buses of the system, bus 18 and bus 37, showed a great improvement in the maximum loading and hence in the voltage stability margin for both buses. Figure 7 shows how the maximum loading and in accordance the voltage stability margin at buses 18 and 37 in case of constant load model has been improved by moving the break down point far to the right (higher loading parameter l) .
5.2. Case 2: IEEE 30-Bus Mesh System
The proposed PSO based algorithm is applied to the
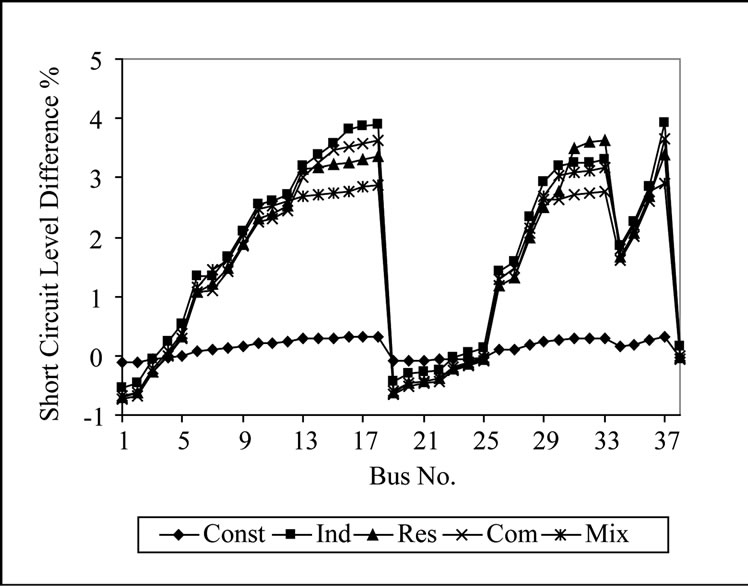
Figure 6. The short circuit level difference of the system under different load models.
IEEE 30-bus test system to determine the optimal size and location of distributed generation units such that the multiobjective function given in (11) is minimized. The system line data and bus data are given in [21]. For this test system, 2 DG units are optimally sized and placed. The proposed system is applied at different load models. The size and location of each DG unit under different load models are given in Table 6.
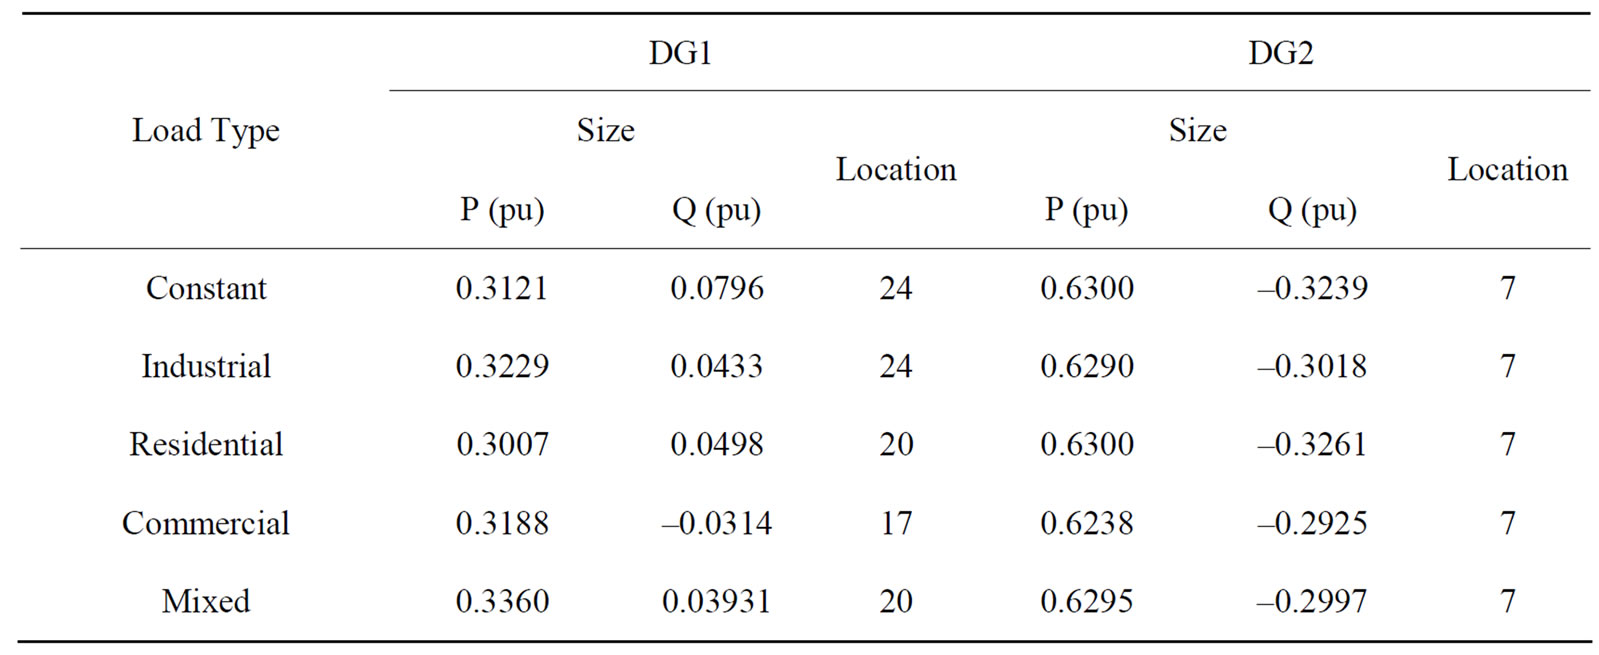
Table 6. Size and location of DG units in 30-bus meshed system.
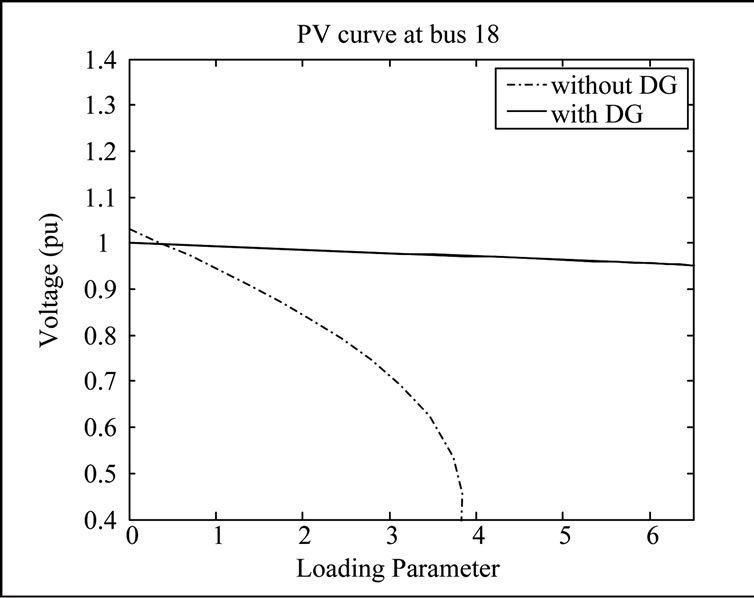
Figure 7. The PV curves at the one of the weakest buses of the system.
The multiobjective function optimally minimized under different load models is shown in Figure 8. The parameters used for PSO in all cases were a population size of 25 and a maximum iteration of 50. As shown in figure, the objective function reached a global minimum and stayed there till the end of iterations.
The value of the MOF and the impact of optimal placement and sizing of DG units on the active and reactive power losses of the system and the total MVA intake from the grid are given in Table 7.
It is shown that the optimal placement of DG units in the system caused a reduction in both power losses and MVA intake from the grid. The reduction in real power loss was in the range of 30% up to 37%. The reduction in reactive power loss was in the range of 26% up to 31%. The reduction in the total MVA intake was in the range of about 62%.
The effect of inserting DG units in the system on the voltage profile, line flow and short circuit level is shown in Figures 9, 10 and 11.
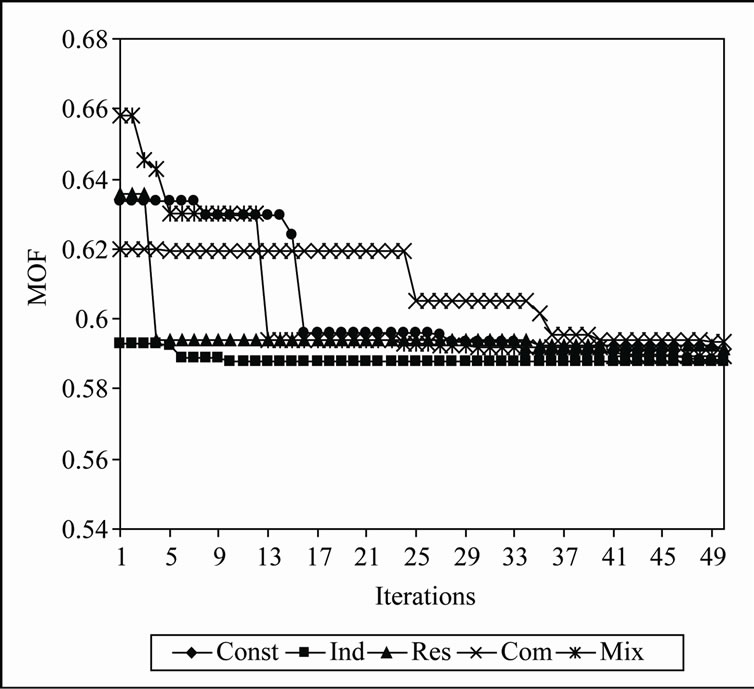
Figure 8. The multiobjective function optimally minimized under different load models.
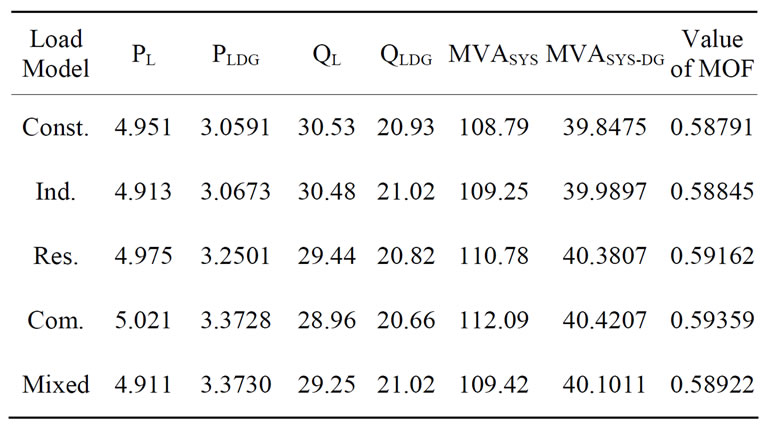
Table 7. System power losses and MVA intake at different load models in 30-bus meshed system.
Figure 9 shows the improvement in voltage profile under different load models. As shown in figure the voltage at all buses before inserting DG units to the system is higher than 0.95 pu and the lowest voltage is at
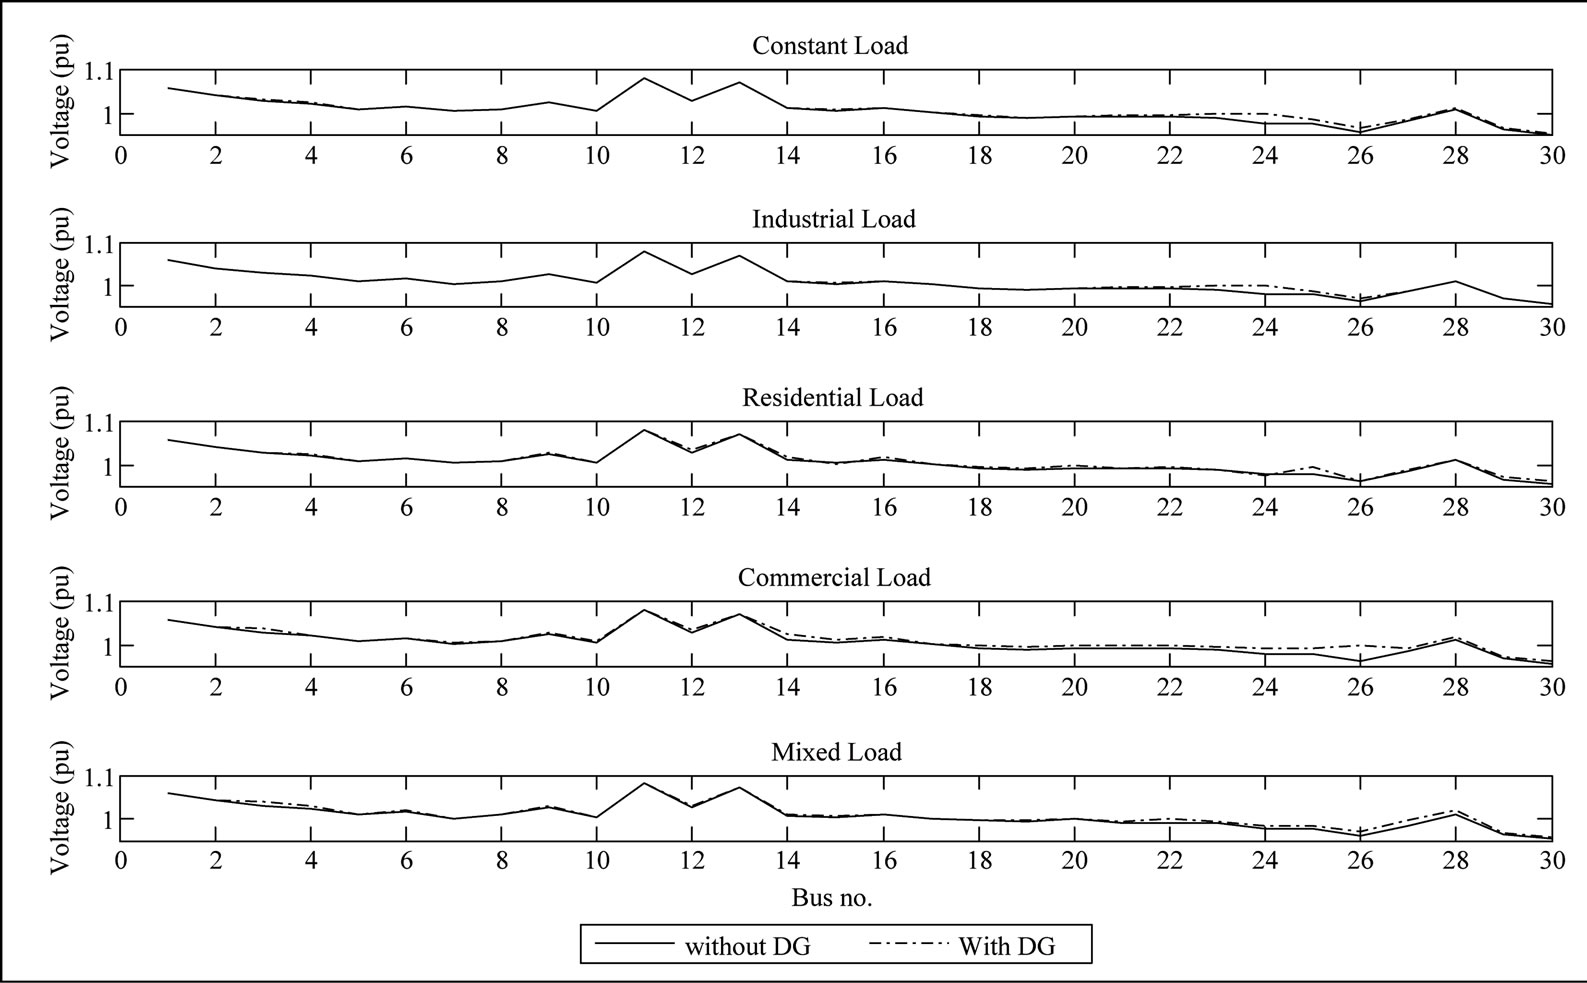
Figure 9. The voltage profile under different load models.
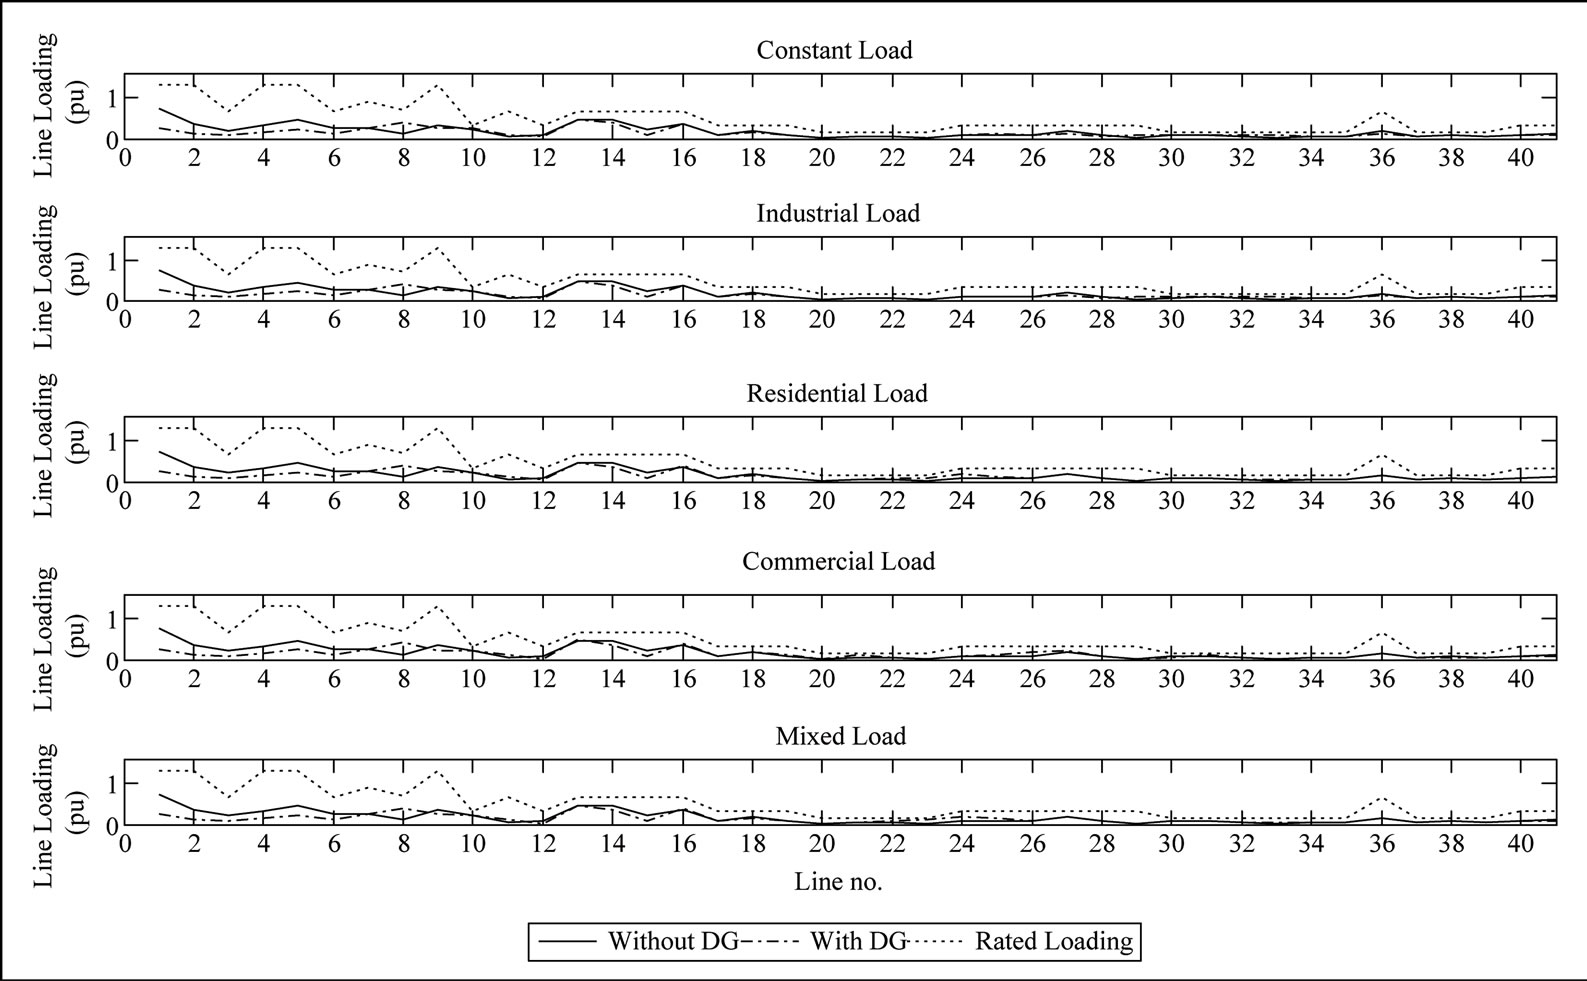
Figure 10. The line loading under different load models.
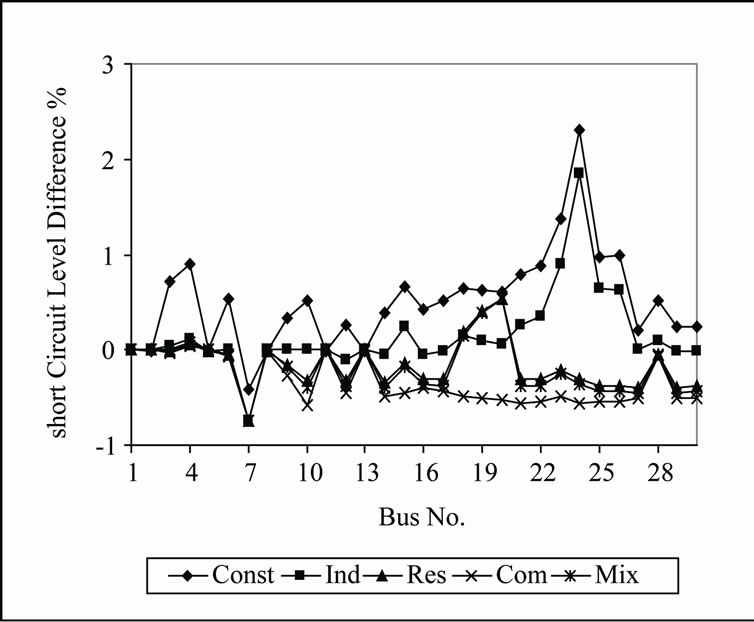
Figure 11. The short circuit level difference of the system under different load models.
bus 30. Due to the insertion of DG units, the voltage profile significantly improved for all studied load models at most of the system buses.
Figure 10 shows the line loading of the system with and without DG. It is clear that for most of the lines the loading decreased while for some lines it was kept the same or increased but still within line loading limits.
As a result of the placement of DG units in the system, the short circuit level at most of the system buses was increased. Figure 11 shows the difference between the short circuit level at each bus of the system with and without DG as a percent of the value of short circuit level before placement of DG units in the system. As shown in figure, the maximum increase is very low where a maximum difference of 2.3% occurred in case of industrial load model and it happened at bus 23.
Running the continuation power flow using the PSAT for the system with and without DG units and recording the PV curve at the weakest bus of the system, bus 30, showed an improvement in the maximum loading and hence in the voltage stability margin. Figure 12 shows how the maximum loading and in accordance the voltage stability margin at bus 30 in case of constant load model has been improved by moving the break down point more to the right (higher loading parameter l) .
6. Conclusions
Multiobjective optimization analysis, including load models, for size-location planning of distributed generation in distribution system was presented. The proposed optimization algorithm was applied to the 38-bus radial test system and the IEEE 30-bus mesh test system. The results showed that the proposed algorithm is capable of optimal and fast placement of DG units. The results
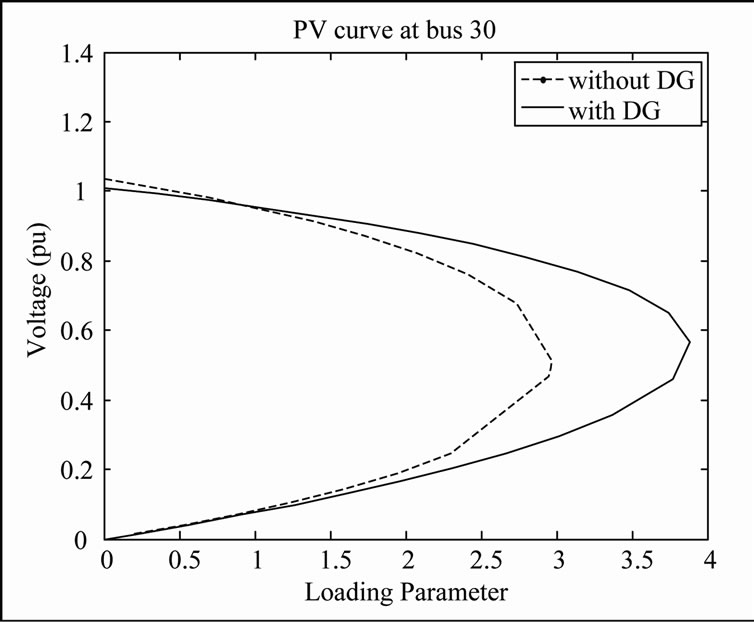
Figure 12. The PV curves at bus 30.
clarified the efficiency of this algorithm for improvement of voltage profile, reduction of power losses, reduction of MVA flows and MVA intake from the grid and also increasing the voltage stability margin and maximum loading.
REFERENCES
- M. Gandomkar, M. Vakilian and M. Ehsan, “A Combination of Genetic Algorithm and Simulated Annealing for Optimal Distributed DG Allocation in Distributed Networks,” Proceedings of IEEE Electrical and Computer Engineering Canadian Conference, Saskatoon, May 2005, pp. 645-648.
- D. Zhu, R. P. Broadwater, K. Tam, R. Seguin and H. Asgeirsson, “Impact of DG Placement on Reliability and Efficiency with Time-Varying Loads,” IEEE Transactions on Power Systems, Vol. 21, No. 1, 2006, pp. 419- 427.
- A. keane and M. O’Malley, “Optimal Distributed Generation Plant Mix with Novel Loss Adjustment Factors,” IEEE Power Engineering Society General Meeting, Montreal, July 2006, p. 6.
- M. F. AlHajri, M. R. AlRashidi and M. E. El-Hawary, “Hybrid Particle Swarm Optimization Approach for Optimal Distribution Generation Sizing and Allocation in Distribution Systems,” Proceedings of Canadian Conference on Electrical and Computer Engineering, Vancouver, Canada, April 2007, pp. 1290-1293.
- Y. A. Katsigiannis and P. S. Georgilakis, “Optimal Sizing of Small Isolated Hybrid Power Systems Using Tabu Search,” Journal of Optoelectronics and Advanced Materials, Vol. 10, No. 5, May 2008, pp. 1241-1245.
- W. El-Khattam, Y. G. Hegazy and M. M. A. Salama, “An Integrated Distributed Generation Optimization Model for Distribution System Planning,” IEEE Transactions on Power Systems, Vol. 20, No. 2, May 2005, pp. 1158-1165.
- M. Mardaneh and G. B. Gharehpetian, “Siting and Sizing of Dg Units Using Ga and Opf Based Technique,” IEEE Region 10 Conference, Vol. 3, 2004, pp. 331-334.
- H. lyer, S. Ray and R. Ramakumar, “Voltage Profile Improvement with Distributed Generation,” IEEE Power Engineering Society General Meeting, Vol. 3, No. 3, June 2005, pp. 2977-2984.
- M. A. Kashem, D. T. Le, M. Negnevitsky and G. Ledwich, “Distributed Generation for Minimization of Power Losses in Distribution Systems,” IEEE Power Engineering Society General Meeting, Montreal, June 2006, pp. 1-8.
- D. Singh, D. Singh and K. S. Verma, “Multiobjective Optimization for Dg Planning with Load Models,” IEEE Transactions on Power Systems, Vol. 24, No. 1, 2009, pp. 427-436.
- T. Gozel and M. H. Hocaoglu, “An Analytical Method for the Sizing and Siting of Distributed Generators in Radial Systems,” International Journal of Electric Power System Research, Vol. 79, No. 6, June 2009, pp. 912-918.
- M. M. Elnashar, R. El-Shatshat and M. A. Salama, “Optimum Siting and Sizing of a Large Distributed Generators in a Mesh Connected System,” International Journal of Electric Power System Research, Vol. 80, June 2010, pp. 690-697.
- L. F. Ochoa, A. Padilha-Feltrin and G. P. harrison, “Evaluating Distributed Generation Impacts with a Multiobjective Index,” IEEE Transactions on Power Delivery, Vol. 21, No. 3, July 2006, pp. 1452-1458.
- R. K. Singh and S. K. Goswami, “Optimum Allocation of Distributed Generations Based on Nodal Pricing for Profit, Loss Reduction and Voltage Improvement Including Voltage Rise Issue,” International Journal of Electric Power and Energy Systems, Vol. 32, No. 6, July 2010, pp. 637- 644.
- H. Hedayati, S. A. Nabaviniaki and A. Akbarimajd, “A Method for Placement of Dg Units in Distribution Networks,” IEEE Transactions on Power Delivery, Vol. 23, No. 3, July 2008, pp. 1620-1628.
- G. Celli, E. Ghiani, S. Mocci and F. Pilo, “A Multiobjective Evolutionary Algorithm for the Sizing and Siting of Distributed Generation,” IEEE Transactions on Power Systems, Vol. 20, No. 2, May 2005, pp. 750-757.
- M. AlHajri, “Sizing and Placement of Distributed Generation in Electrical Distribution Systems using Conventional and Heuristic Optimization Methods,” Ph.D. Dissertation, Dalhousie University, Halifax, Nova Scotia, 2009.
- J. Kennedy and R. Eberhart, “Particle Swarm Optimization,” Proceedings of IEEE International Conferences on Neural Networks, Vol. 4, Perth, Australia, 1995, pp. 1942 -1948.
- Y. Shi and R. Eberhart, “A Modified Particle Swarm Optimizer,” Proceedings of IEEE International Conferences Evolution Computation, Anchorage, UK, May 1998, pp. 69-73.
- H. Yoshida, K. Kawata and Y. Fukuyama, “A Particle Swarm Optimization for Reactive Power and Voltage Control Considering Voltage Security Assessment,” IEEE Transactions on Power System, Vol. 15, No. 4, 2000, pp. 1232-1239.
- N. Deeb and S. Shahidehpour, “Cross Decomposition for Multi-Area Optimal Reactive Power Planning,” IEEE Transactions on Power Systems, Vol. 8, No. 4, 1993, pp. 1539-1544.
- Power System Analysis Toolbox (PSAT). http://www.power.uwaterloo.ca/~fmilano/psat.htm
- Y. Fukuyama and T. Yura, “A Particle Swarm Optimization for Reactive Power and Voltage Control Considering Voltage Stability,” Proceedings of IEEE International Conferences on Intelligent System Applications to Power Systems (ISAP), Rio de Janeiro, April 1999.
- S. Naka, T. Genji, T. Tura and Y. Fukuyama, “Practical Distribution State Estimation Using Hybrid Particle Swarm Optimization,” Proceedings of IEEE Power Engineering Society Winter Meeting, Ohio, USA, 2001.