Communications and Network
Vol.3 No.2(2011), Article ID:4971,14 pages DOI:10.4236/cn.2011.32012
Design and Simulation of a Secure and Robust Underwater Acoustic Communication System in the Persian Gulf
1Electrical Engineering Department, Malek-Ashtar University of Technology, Tehran Isfahan, Iran
2Electrical Engineering Department, Iran University of Science and Technology, Tehran, Iran
E-mail: doosti.aref@ieee.org, {mjannati, vakily}@iust.ac.ir
Received March 12, 2011; revised April 11, 2011; accepted April 19, 2011
Keywords: Persian Gulf, LPC-10, IDEA Encryption, DFE, Rivest Cipher, Ray Tracing, QPSK Modulation
Abstract
In recent years, underwater acoustic (UWA) communications have received much attention as their applications have begun to shift from military toward commercial. Digital communications through UWA channels differ substantially from those in other media, such as radio channels, due to severe signal degradations caused by multipath propagation and high temporal and spatial variability of the channel conditions. This paper describes a project designed, based on the results obtained from extensive laboratory and field experiments on sound speed profile in different depths of the Persian Gulf, to investigate and demonstrate an underwater acoustic communication system. Transmitted data are acoustic signals to which for more safety in transmission and low frequency bandwidth, Rivest cipher cryptography algorithm and linear prediction coding are applied, respectively. In transmitter, Quadrature Phase Shift Keying (QPSK) signaling is employed to make efficient use of the available channel bandwidth. In the channel, a comprehensive model for short-range shallow water multipath acoustic channel is presented. The mathematical modeling of the multipath effects is based on the ray tracing and the image method. Also, the attenuations due to wave scatterings at the surface and their bottom reflections are accounted for. In addition, we consider the loss due to the frequency absorption of different materials and the presence of ambient noises such as the sea state noise, shipping noise, thermal noise and turbulences. In the receiver, to overcome the difficulties of inter symbol interference, adaptive equalization using Decision Feedback Equalizer (DFE) is applied.
1. Introduction
In the past five to 10 years, there has been a growing interest in the underwater acoustic communications in various application areas such as remote control in off-shore oil industry, pollution monitoring in environmental systems, collection of scientific data recorded at ocean-bottom stations, speech transmission between divers, and mapping of the ocean floor for detection of objects, as well as for the discovery of new resources [1]. Wireless underwater communications can be established by transmission of acoustic waves but they are not the only means for wireless transmission of signals under water. Radio waves that will propagate any distance through conductive sea water are the extra low frequency ones (30 Hz - 300 Hz) which require large antenna and high transmitter powers. Optical waves do not suffer so much from attenuation, but they are affected by scattering. Consequently, transmission of optical signals requires high precision in pointing the narrow laser beams. While the laser technology is still being perfected for practical use, acoustic waves remain the single best solution for communicating under water in applications where tethering is unacceptable [1,2].
Seawater acts as an acoustic waveguide in which sound waves travel. The sound channel, as a sound waveguide, is a channel with random parameters; however, this doesn’t mean that its behavior is unpredictable. The most important characteristic of the seawater is its inhomogeneous nature, which on the whole, can be classified into regular and random varieties. Regular variations of sound speed in different layers of water lead to the formation of sound channels and this phenomenon facilitates long distance sound propagation. Random inhomogeneities cause the scattering of sound waves and result in sound field fluctuations.
To overcome the difficulties of time-varying multipath dispersion, the design of commercially available underwater acoustic communication systems has relied so far mostly on the use of noncoherent modulation techniques and signaling methods which provide relatively low data throughput. Recently, phase-coherent modulation techniques, together with array processing for exploitation of spatial multipath diversity, have been shown to provide a feasible means for a more efficient use of the underwater acoustic channel bandwidth. These advancements are expected to result in a new generation of underwater communication systems, with at least an order of magnitude increase in data throughput [2].
Bandwidth-efficient digital underwater acoustic communications can be achieved by employing equalization of quadrature amplitude modulation (QAM) and phase shift keying (PSK) signals. The receiver structure that has been found useful in many applications is a multichannel decision-feedback equalizer. Due to the nature of the propagation channel, the required signal processing is often prohibitively complex. Reduction in computational complexity can be achieved by using efficient adaptive algorithms, such as the low-complexity LMS algorithms with improved tracking properties [3,4], and by reducing the number of adaptively adjusted receiver parameters [4-6].
This paper is organized as follows. In the second section, transmitter is designed. Because of the strong frequency attenuation, channel bandwidth is limited, therefore in transmitter, we have used LPC-10 (Linear Prediction Coder-10) algorithm to compress speech signal. After that, for more safety in transmission, RC5 (Rivest Cipher) cryptography algorithm has been used to encrypt data. Then, for reduction of bit error rate (BER), channel coding is used. In the last section of transmission, data is modulated. In the third section, the model for the sound channel is provided. In the fourth section, the block diagram of the receiver and its performance is discussed.
Finally, the simulation results, based on the real data in the Persian Gulf, are presented.
2. Transmmiter
On the basis of extensive laboratory and field experiments and the results obtained from deferent simulations, to improve the bandwidth efficiency, using the coherent modulation methods such as Quadrature Amplitude Modulation (QAM) and phase shift keying (PSK) is the best approach in underwater operations [6]. Depending on the method for carrier synchronization, phasecoherent systems fall into two categories; differentially coherent and purely phase coherent. The advantage of using differentially coherent detection is the simple carrier recovery which it allows. Its disadvantage is performance loss as compared to coherent detection. While bandwidth-efficient methods have successfully been tested on a variety of channels, the real-time systems have mainly been implemented for applications in vertical and very short range channels, where little multipath is observed and the phase stability is good [1,3,6]. In this paper, for the purpose of compensating for the multipath effects and inter-symbol interference (ISI), since the Persian Gulf channel is shallow and horizontal and the QPSK modulation method in comparison with other methods has proper bit error rate despite low bandwidth, we have used the QPSK modulation method, which is purely coherent. The block diagram of the transmitter is shown in Figure 1. This transmitter includes blocks for producing the QPSK symbols. The resulting QPSK symbols are then passed through a pulse shaping filter. The rectangular pulses are not practical to send and require a large bandwidth. Hence, we replace them with shaped pulses that convey the same information but use smaller bandwidths and have other good properties such as inter symbol interference rejection. In continuation, we completely explain each of the blocks.
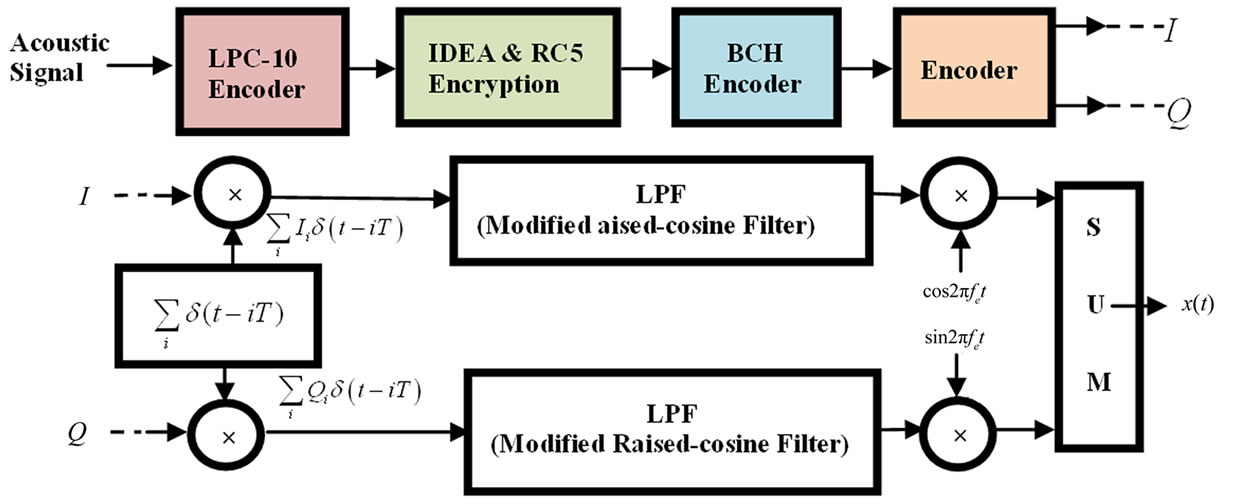
Figure 1. Block diagram and structure of the transmitter.
2.1. Speech Coding
In the first block of transmitter, acoustic signal is compressed with LPC-10 algorithm. Sampling frequency is 8 KHz and for any sample 8 bit is appropriated. Therefore sampling bit rate is 64 kbps. LPC-10 algorithm reduce bit rate to 2.4 kbps, consequently small bandwidth is needed and frequency attenuation is well reduced [7,8].
2.2. Cryptography
In the second block, data is encrypted with RC5 algorithm. RC5 is a symmetric block cipher designed to be suitable for both software and hardware implementation. It is a parameterized algorithm, with a variable block size, a variable number of rounds and a variable-length key. This provides the opportunity for great flexibility in both performance characteristics and the level of security [9]. In this paper, block size has been selected 32, number of rounds are 16 and key length is 10.
2.3. Channel Coding
This block is needed for error correction in channel. BCH (Bose, ray-Chaudhuri, Hocquenghem) coding has been selected for channel coding. The inputs of applied BCH code are 12 bits that convert to 32 bits and are transmitted in channel. This code can correct 5 or fewer random errors in receiver [10]. In each data transmission, a training sequence to which allocates 10% of the first transmitted sequences itself is multiplexed with the data sequences before the QPSK modulation. The main purpose of the training sequence is to provide the receiver with a known sequence which can be used for phase estimation and synchronization in decision feedback equalizer.
2.4. Modulation
The encoder accepts the sequence of the input binary data. It has two outputs; in-phase, I, and quadrature, Q. For each distinct pair of input binary data a unique combination of I =  and Q =
  is assigned. We consider each QPSK symbol as a complex number, I + jQ, whose real and imaginary components are the outputs of the in-phase and quadrature channels respectively, to describe those four points separated in the complex plane by
 ,
, ,
, , and
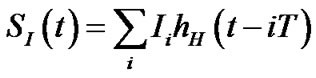
, and . The encoded data stream of I and Q is then used to modulate a sequence of impulses in which are Transmitted every signaling period; T. To limit their bandwidth such modulated sequences are then low-pass filtered by LPFs. The same low pass filters are applied at the receiver. The in-phase and quadrature signals at the output of low pass filter are:
 (1)
(1)
 (2)
(2)
that  is the impulse response of the low pass filter. The filtered signals are then multiplied by a carrier frequency, added and transmitted through the Persian Gulf underwater acoustic channel.
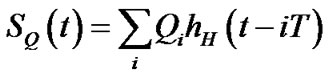
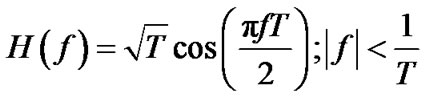
To avoid the disadvantages of the side lobes and to reduce the ISI we transmit data with shaped pulses instead of rectangular pulses. Therefore, the obtained QPSK symbols are passed through a modified raisedcosine filters (LPFs) with a roll-off factor  and impulse response
 . The transfer function of the baseband channel has the form:
 (3)
(3)
that T = s. The transfer function of both the transmitter filter and receiver filter is then
 , and the impulse response of the assumed non-fading part of the baseband channel is:
 (4)
(4)
Thus the impulse response of each filter is obtained through the inverse Fourier transform of Equation (3), which is:
 (5)
(5)
where
 and
and 
To reduce side lobe levels, the impulse response of the filter is modified by multiplying it with a Hamming window given as:
 (6)
(6)
The period of Hamming window is 2T that T is the period of each symbol. This window has 99.96% of its energy in the main lobe, with side lobes of over 20 dB down from the peak [11]. Thus Impulse response of filters is corrected:
 (7)
(7)
We use this modified raised cosine filter in the transmitter and receiver. In Figure 2, for the assumed sequence of “00110001101111011”, the output of the I and Q
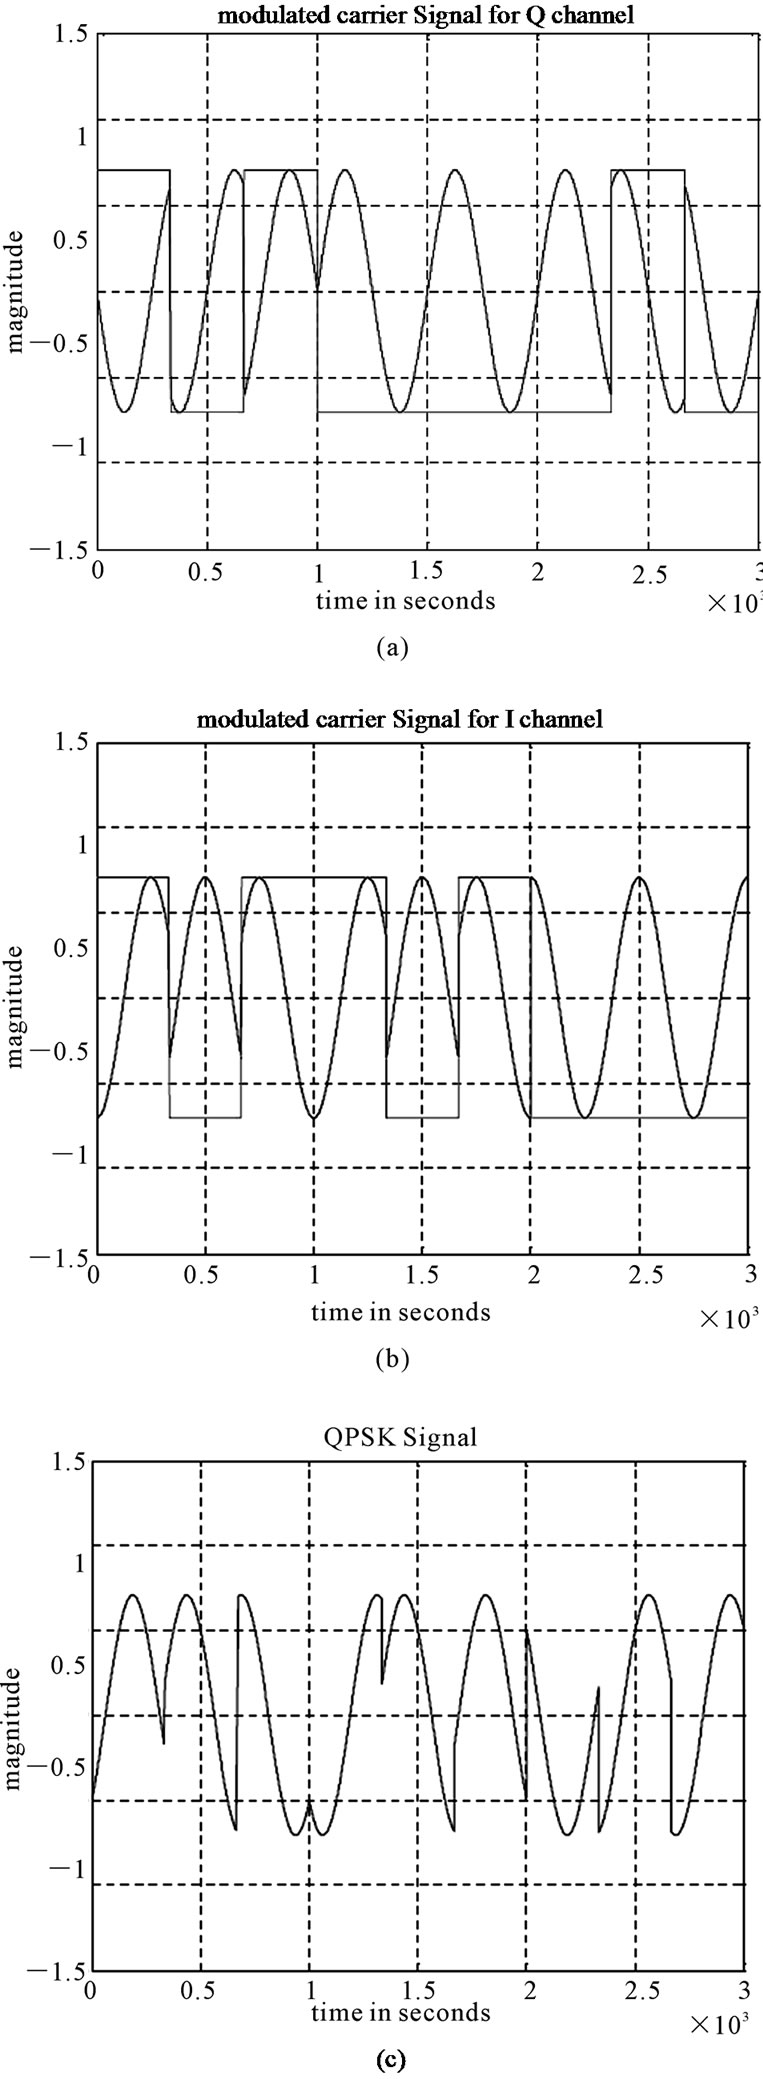
Figure 2. (a) Q channel. (b) I channel. (c) QPSK signal.
channels and the QPSK signals are shown.
3. Channel
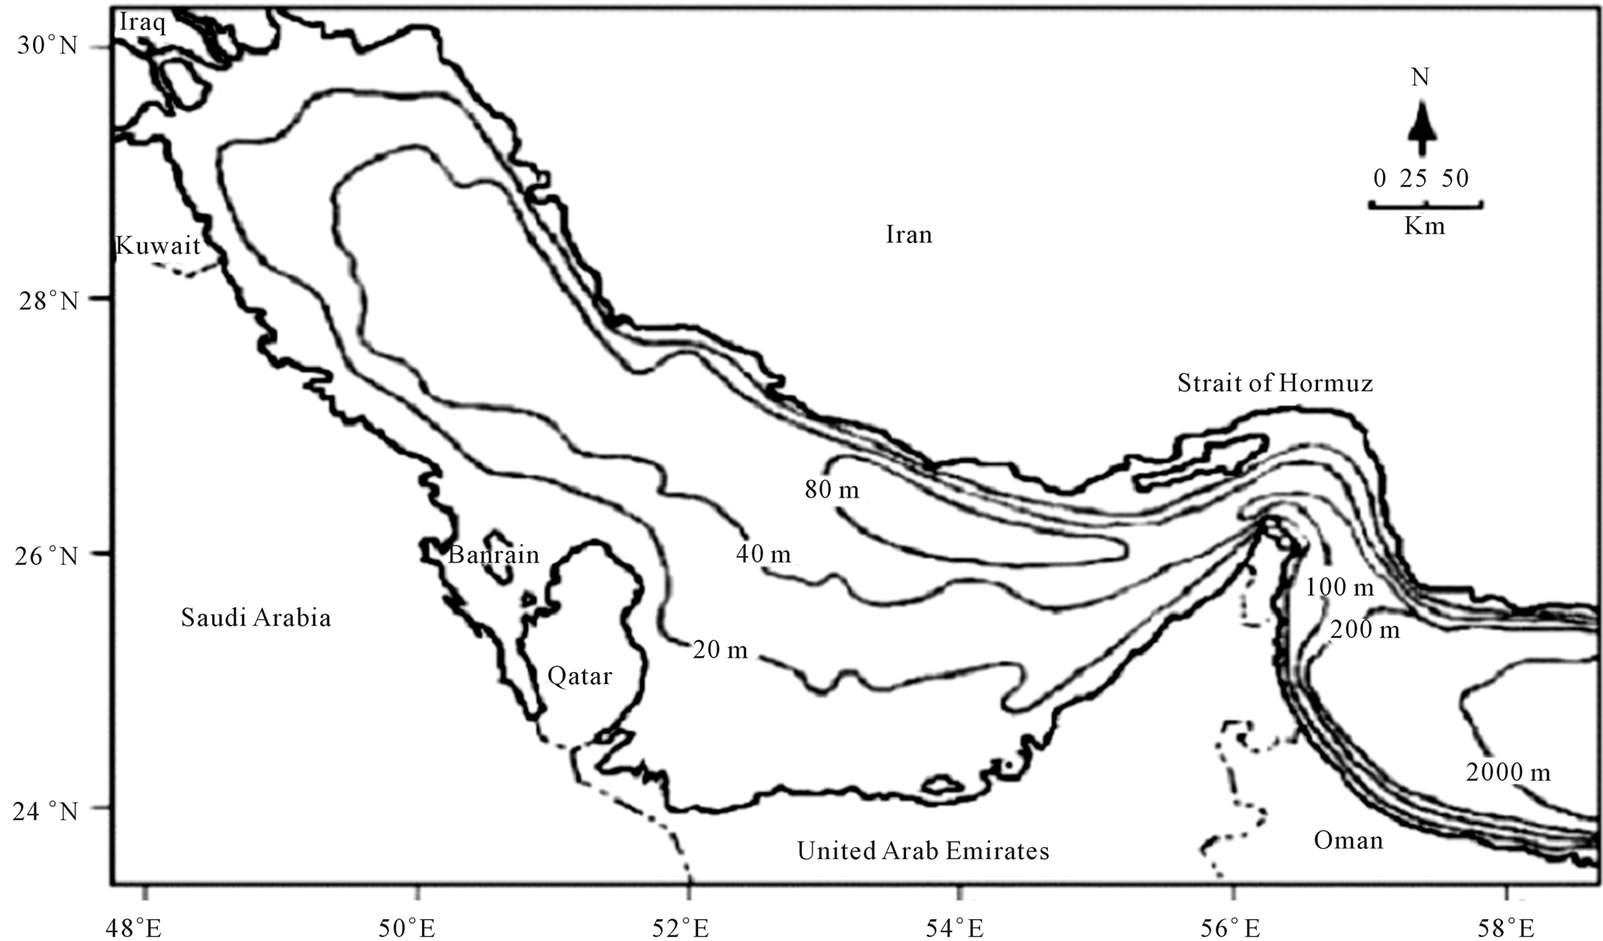
In this section, as an introduction and the most basic step, the variation of sound speed profile in the Persian Gulf is investigated. The Persian Gulf, owing to its oil and gas resources, is an important strategic region, economically, politically and militarily, and is one of the busiest waterways in the world. Countries bordering the Persian Gulf are the United Arab Emirates, Saudi Arabia, Qatar, Bahrain, Kuwait and Iraq on one side and Iran on the other side (Figure 3(a)). The Persian Gulf is ~990 km long and has a maximum width of 370 km. The average depth of it is 36 m. It occupies a surface area of ~239000 km2 [12,13]. Extensive shallow regions, <20 m deep, are found along the coast of United Arab Emirates, around Bahrain and at the head of the Gulf. Deeper portions, >40 m deep, are found along the Iranian coast continuing into the Strait of Hormuz, which has a width of ~56 km and connects the Persian Gulf via the Gulf of Oman with the northern Indian Ocean. Tectonic driven subsidence deepened the seafloor of the Strait on its southern side (200 - 300 m depths are seen in some localized seafloor depressions) and produced a 70 - 95 m deep trough along the Iranian side of the eastern part of the Persian Gulf. A southward widening channel leads from the Strait south across a series of sills (water depth of ~110 m) and shallow basins to the shelf edge [13-15]. The narrow Strait of Hormuz restricts water exchange between the Persian Gulf and the northern Indian Ocean. According to the obtained measurements, as can be observed in Figure 3(b), sound speed is the maximum during the summer (~1560 m/s) in the southern part of the Persian Gulf. Also, sound speed in the northern part of the Gulf varies from 1524 - 1528 m/s at the bottom and from 1547 - 1552 m/s at the surface a roughly 20 m/s sound speed difference from surface to bottom [16-18].
3.1. Modified Empirical Formula for Sound Speed Based on Real Data of the Persian Gulf
In this section, based on the performed measurements [19], the Medwin equation [20] is modified so that its output conforms to the measured sound speed profile in the Persian Gulf. In Figure 4, a profile of sound speed variation with depth is shown for the Strait of Hormuz location of 56.7˚E (Lon) and 25.4˚N (Lat). The water depth was 85 m, and the ADCP measurement tool, belonging to the NOAA submarine, was placed at a depth of 1 km. Considering the fact that sound speed variations with temperature and salinity in shallow waters are almost constant and in the range of 1500 to 1502 m/s, the horizontal axis of this figure shows the difference of the
 (a)
(a)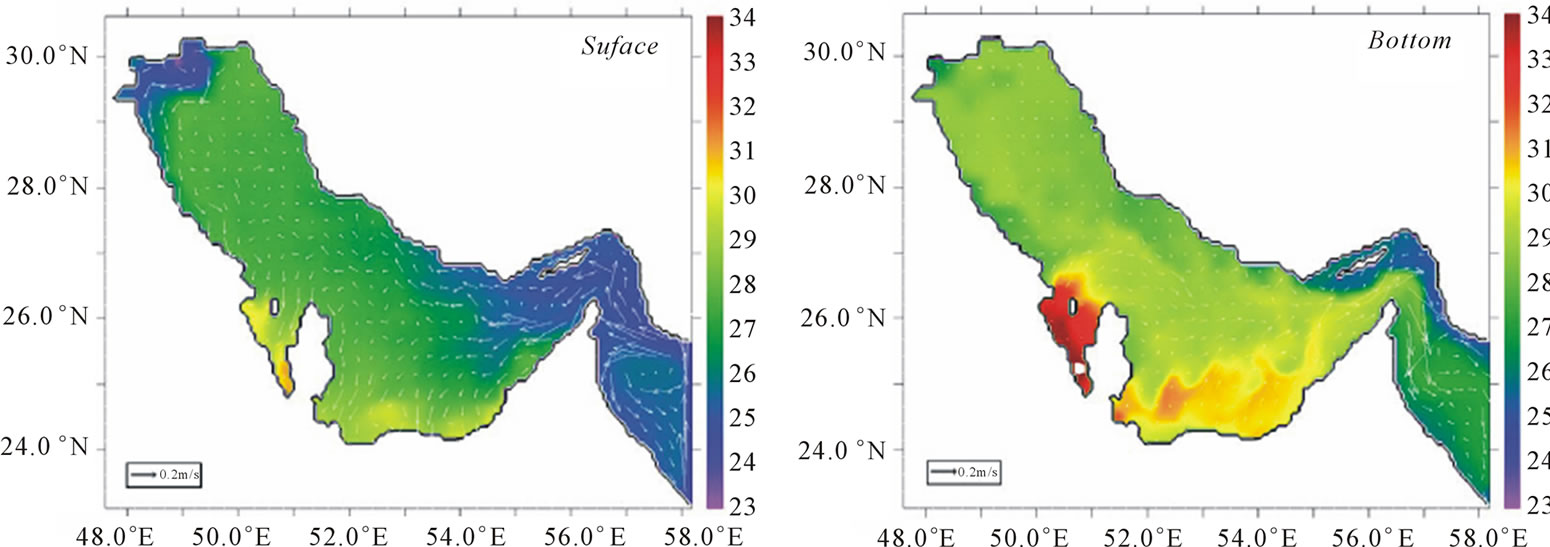 (b)
(b)
Figure 3. (a) Bathemetry used in this study [12]. (b) Sound speed (plus 1500 m/s) in surface and bottom layers in different parts of the Persian Gulf.
measured sound speeds from 1500 m/s. Also, the vertical axis of the profile depicts depth variations.
The relation of sound speed versus salinity and temperature in the Medwin formula is given by (8) [20]. Based on the salinity and temperature measurements from practical experiments (temperature = 33.56˚C, salinity = 38.37ppt), for the profile of Figure 5, the sound speed results obtained from (8) are actually in the range of 1500 to 1501 m/s.
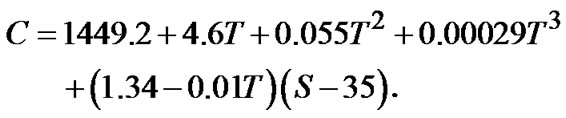 (8)
(8)
However, the dependence of sound speed to depth in the Medwin formula (C = 0.016D) under similar conditions of salinity and temperature, does not conform to the measured data; as Figure 6 clearly shows.
Equation (9) is the modified version of the Medwin formula that we have presented. In this equation, the de-
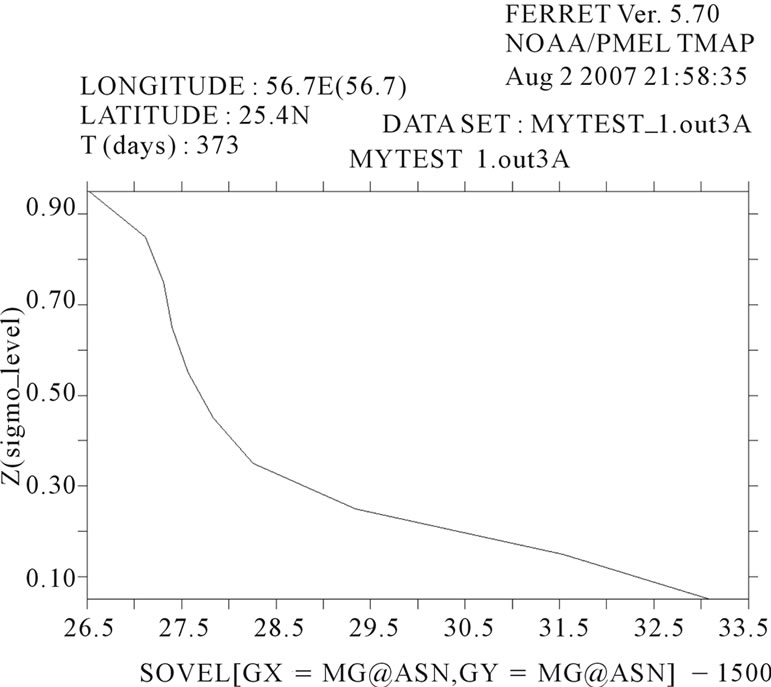
Figure 4. Sound speed profile of the Persian Gulf.
pendence of sound speed to salinity and temperature is incorporated into the Medwin formula. However, in this case, the sound speed versus depth is approximated by a 10th order polynomial.
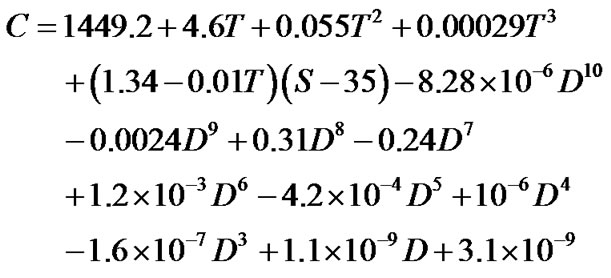 (9)
(9)
Figure 6 illustrates the output of the Medwin formula, the output of the obtained modified formula, and the ex-

Figure 5. Amount of measured loss at different frequencies in the Persian Gulf.
perimental data. In this figure, the approximation error (3%) for each point is well acceptable.
3.2. Loss Modeling
On the basis of extensive laboratory and field experiments [18,19], the attenuation due to the absorption effects of Boric acid (B(OH)3), Magnesium sulphate (MgSO4), and pure water (H2O) is considered. The total loss is the sum of individual losses due to each material. The experimental measurements and the resulting profile for each material as well as the total loss are shown in Figure 5.
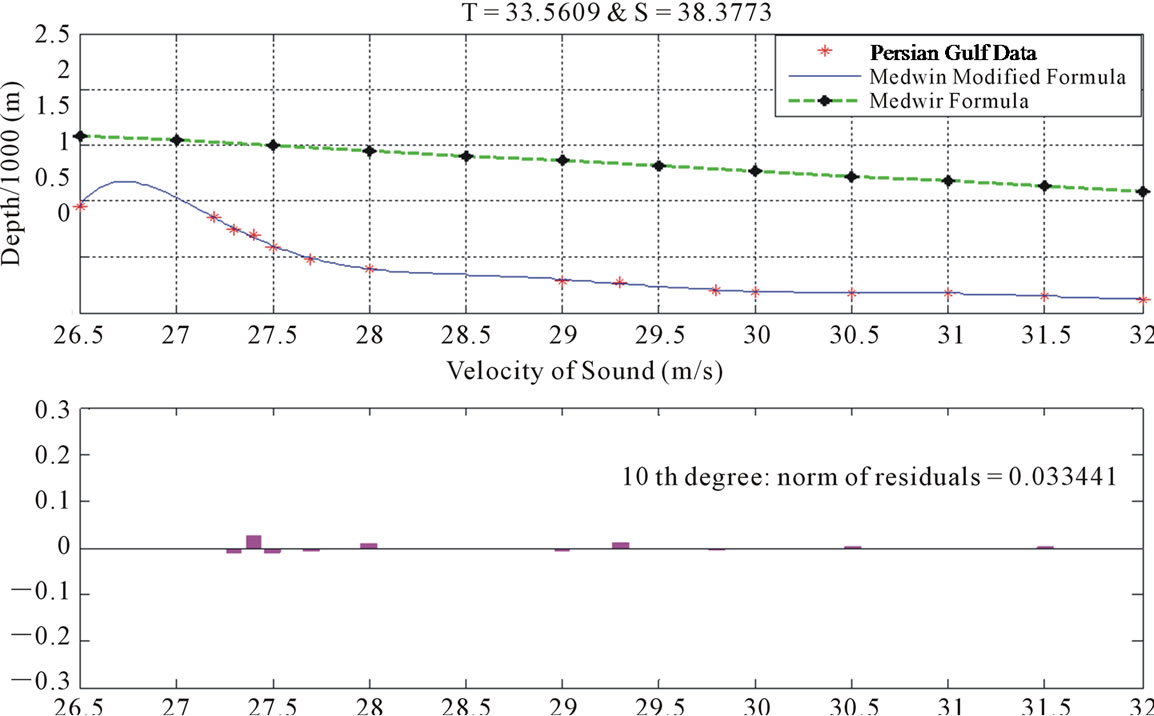
Figure 6. Obtained profiles from the Medwin formula, medwin modified formula, and real measured data; the difference between real data and the presented model.
3.3. Noise Modeling
The model considered for noise is the combination of the thermal noise, shipping noise sea state noise and turbulences [21,22]. Equation (10) depicts the general relation of the ambient noise. Also measured data of the Persian Gulf have been shown in Figure 7.
 (10)
(10)
3.4. Surface Scattering and Bottom Reflections
To calculate the loss due to wave scattering at the surface, we use the probability density function of the Gaussian Normal distribution for the surface displacement variable. In the simulation, the mean surface reflection coefficient is calculated from (11) [18,19,23].
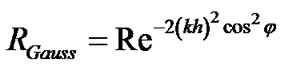 (11)
(11)
That k denotes the wave number. h is the effective value of the surface wave height. , is the angle of collision to the normal surface and R is the pressure reflection for the normal surface. We consider R = −1 and h is obtained from the spectral density of the water surface displacement. The most famous spectrum in this case is the Neumann-Pierson spectrum. For the calculation of wave bottom reflection coefficient, we use the Jackson pattern to select the bottom water type which is simulated based on the Strait of Hormuz conditions and the Hamilton-Bachman model [19].
3.5. Mathematical Modeling of Multipath Effect
In the performed simulation, the number of channel paths varies as a multiple of four. In the considered model, for the wave propagation from the transmitter to the receiver, we use four Eigen rays which are shown in Figure 8. The transmitted wave either follows one of the four Eigen rays or a multiple of them. In the case of multiple reflections, after several reflections, the wave reaches the receiver in one of the four ways shown in Figure 8.
In the image method, according to Figure 9, the surface and bottom are considered as two mirrors.
In the cylindrical coordinates, for a channel with depth D, the surface is at Z = 0 and the bottom is at Z = D. Assume that a transmitter is at (0, Zs) and a receiver is at (0, Z). Therefore, the first image of the transmitter, due to the mirror effect of the surface, is located at (0, –Zs). Then, the transmitter and this image, in relation to the bottom, are located at (0, 2D – Zs) and (0, 2D + Zs), making the second and third images, respectively. In general, the number of images or the sources of virtual transmitters equal infinity, and in each of the image repetitions, four new images are generated, each of which is related to one of the Eigen rays. According to this theory, the sound pressure field can be expressed largely through (12) [23,24].
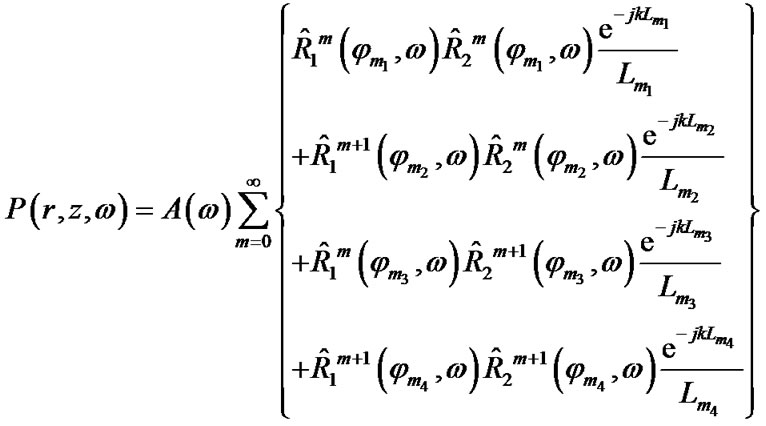
(12)
In this equation, A is the amplitude of the sound wave; R1 and R2 are the reflection coefficients of the surface
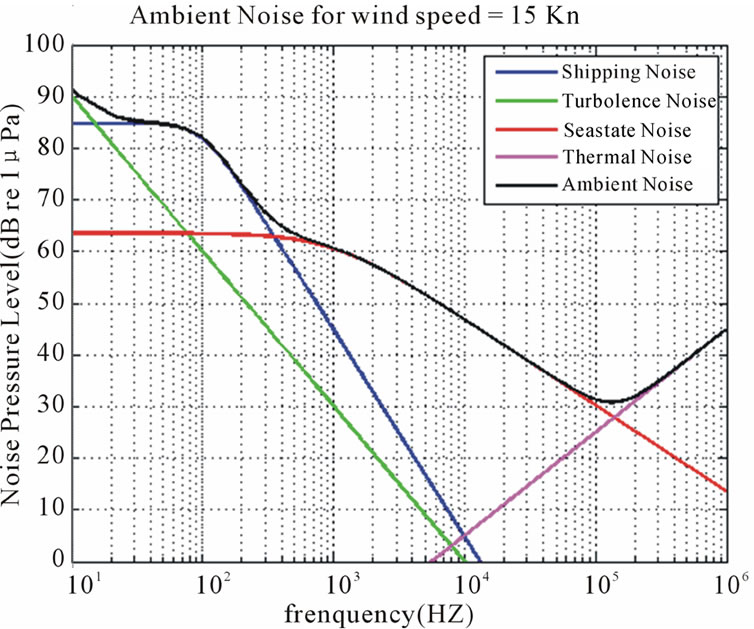
Figure 7. Ambient noise Level for different frequency domains.

Figure 8. Four eigen rays used in the simulation; Direct Path (DP) -Refracted Bottom Reflected (RBR)- refracted Surface Reflected (RSR)- Refracted Surface Reflected Bottom Reflected (RSRBR), the wave from the source follows one of these paths in reaching the receiver.

Figure 9. Schematic of a transmitter and its first three images in the image theory for a homogenous channel.
and bottom, respectively; are the reflection angles of the four Eigen rays; K is the wave number; and Lm1, Lm2, Lm3, Lm4 are the lengths of the displacement vectors of the Eigen rays RSRBR, RBR, RSR, DP in the (m + 1)th stage of the production cycle of virtual resources, respectively. Considering the location of the generated image in the mth stage, the displacement vector lengths of propagation paths are in accordance with (13) [23,24].
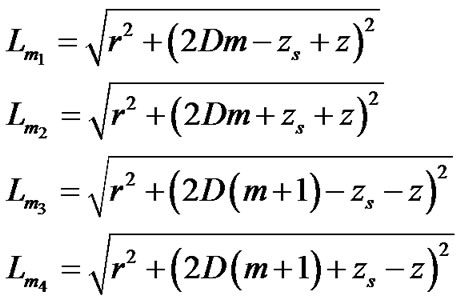 (13)
(13)
In the performed simulation, each of the reflection coefficients of the surface or bottom is calculated based on the introduced pattern of that section. For the Persian Gulf channel, considering m = 1 (i.e. eight paths), we concluded that from the sixth path on, due to strong attenuation of the transmitted wave, there was no signal reception. Hence, a five-path channel pattern is suitable for this region of the Persian Gulf [25].
4. Receiver
Compared to many other communication media, underwater acoustic channels are generally band-limited and so involve relatively low data rates. Despite this, the channel distortions commonly encountered require complex signal processing in the receiver, resulting in high computational loads and the need for power-hungry, high-speed hardware. Consequently, the design of a computationally-efficient receiver is crucial for practical implementations. Adaptive signal processing, in the form of adaptive equalization, has established itself as an integral part of nearly every digital communication receiver in use today. Digital acoustic communication is limited by severe ISI associated with shallow underwater channels. The ISI is caused by multipath propagation resulting from surface and bottom reflections [26,27]. To overcome the effects of inter-symbol interference; an adaptive equalization method employing a Mean Square Error (MSE) criterion is introduced. Computer simulations are carried out to verify the effectiveness of the equalization scheme for high data rate communication. In the selection of an equalizer we consider convergence rate, processing complexity and the ability to track changes in the channel characteristics. There are a variety of algorithms which have been investigated to be used in underwater acoustic communication. In this paper we have applied DFE equalizer for acoustic signal transmitting in the Persian Gulf channel. A decision feedback equalizer is a nonlinear equalizer that contains a forward filter and a feedback filter. The forward filter is fractionally spaced with spacing ; while the feedback filter contains a tapped delay line whose inputs are the decisions made on the equalized signal. The purpose of a DFE is to cancel inter symbol interference while minimizing noise enhancement. Figure 10(a). shows structure of decision feedback equalizer. The criterion used in the optimization of the equalizer coefficients is the minimization of the mean square error (MSE) by use of the least mean square (LMS) algorithm. The output of DFE at t = kT is given as [28-30]:
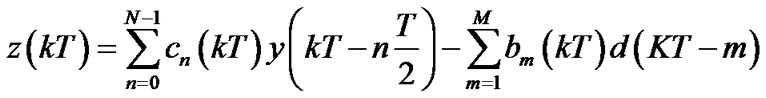 (14)
(14)
and error is:
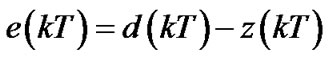 (15)
(15)
New set of coefficients is obtained iteratively as:
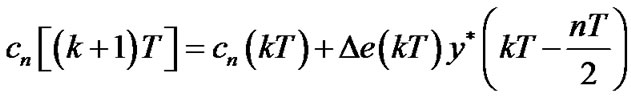 (16)
(16)
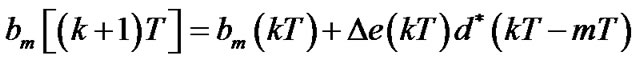 (17)
(17)
That Dis a positive adaptation constant which controls the rate of adaptation of the equalizer and stability of the stochastic gradient algorithm. Structure of the receiver has been shown in Figure 10(b). We can replace adaptive equalizer block with nonlinear equalizer (DFE). With respect to maximum delay in channel, DFE has 84 weights in forward filter, 42 weights in backward filter and D = 10–4.
 (a)
(a)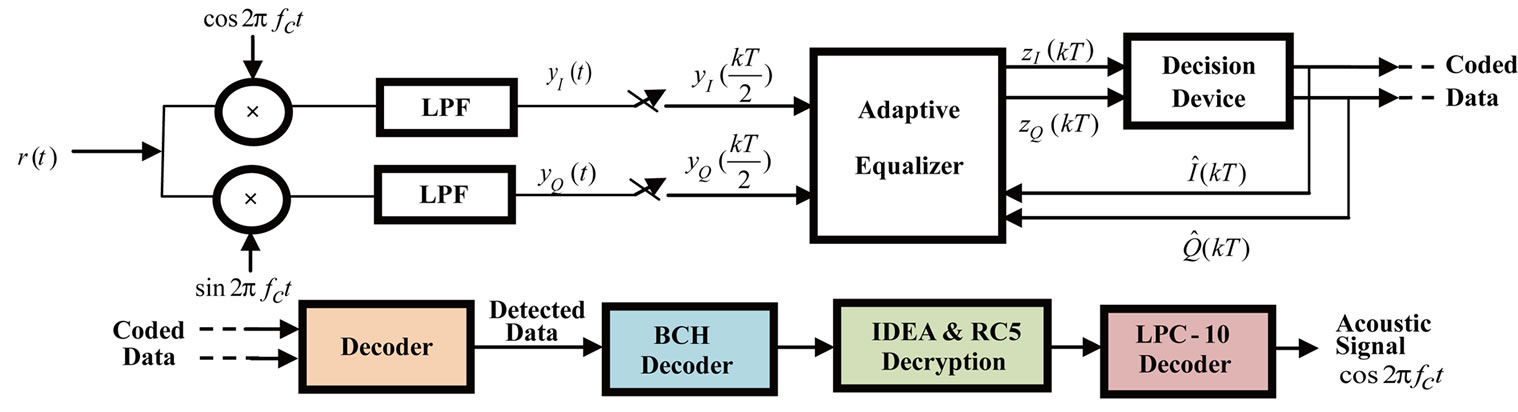 (b)
(b)
Figure 10. (a) Decision feedback equalizer. (b) Block diagram and structure of the receiver.
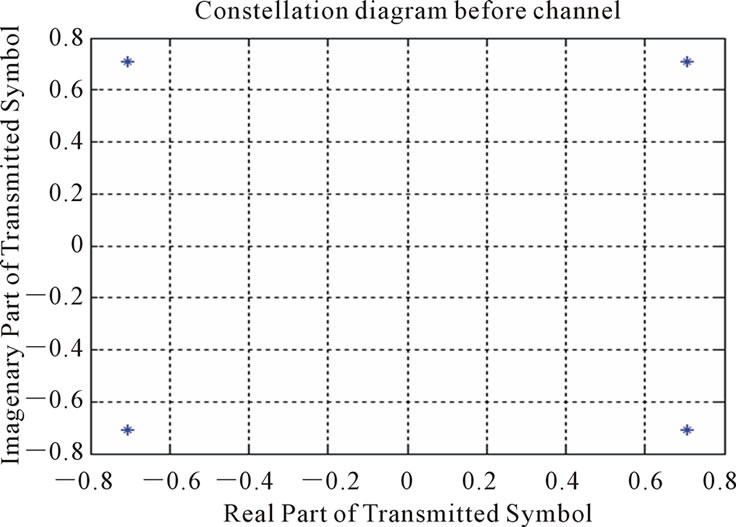
5. Simulation Results
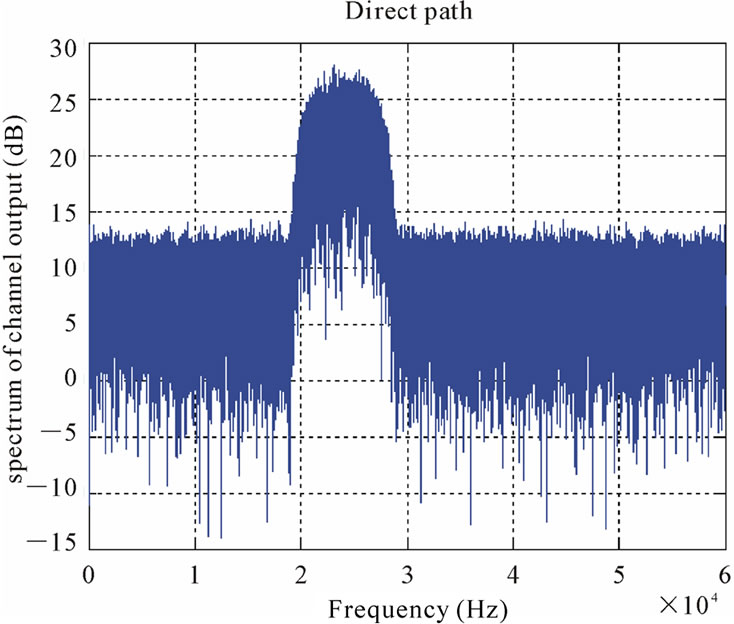
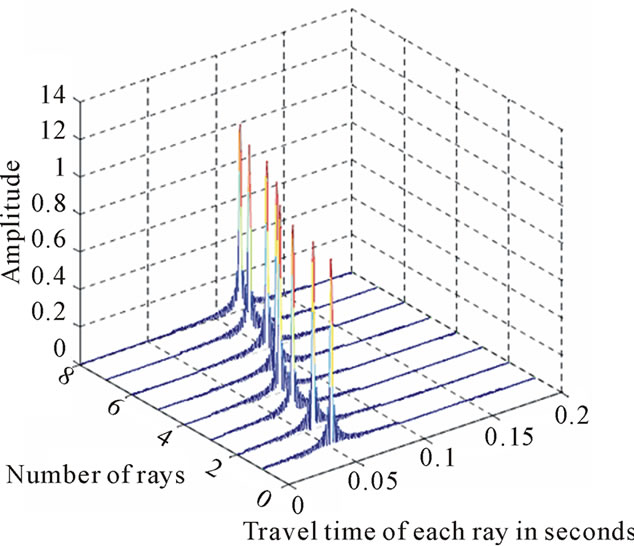
In this section, the simulation results for the channel whose speed profile was shown in Figure 4 are presented. The simulated channel characteristics are given in Table 1. In this case, the transmitter and receiver use the QPSK modulation with a bandwidth of 5 KHz and a carrier frequency of 27 KHz. Also, the transmitter and receiver are placed at a depth of 5 m and 70 m from the surface, respectively. Figure 11 illustrates the constellation diagram of QPSK symbols and the power spectrum density of the band-pass signal with a 27 KHz carrier frequency, before the transmission through the channel. The constellation diagram of the received QPSK symbols after entering the fading channel is obtained according to Figure 12. As shown, the amount of Inter Symbol Interference is high in this figure. Also, Figure 13 illustrates the power spectrum density of the transmitted signal in the channel for each of the special paths. As expected, in the RSRBR path (Figure 13(d)), the largest attenuation takes place, and the signal in this path experiences 23dB loss. Figure 14 shows the ensemble of channel response, for the fifth path and the remaining paths after it the signal is strongly attenuated, as can be seen from comparing Figure 14(a) and 14(b).
Figure 15 shows the delay spread of each ray in 2 dimensional views. For the 8th path, it is about 0.07 sec in comparison with the first (direct path).
In the following, two cases of multi-path propagation have been considered. One is at a mud bottom type (coarse silt) and lower wind speed (10 Knots) and the other is a bit higher wind speed (15 Knots) and very fine sand bottom type.
Figure 16 shows the bit error rate of the detected signals in different signal to noise ratio (SNR). From this fig it can observed that when there is higher wind speeds and rough bottom types, the strengths of all rays constituting multi-path propagation is getting minimized. This is due to much reflection at lower wind speeds as well as much absorption loss of softer bottom types.
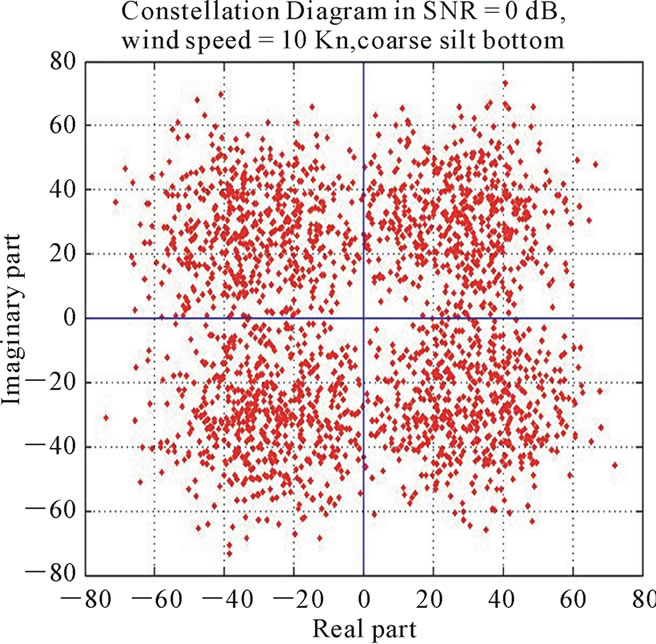
Figure 17 illustrates the constelation plots of detected symbols in deferent SNRs at the output of the receiver, as can be shown, in SNR = 3dB (Figures 17(e) and 17(f)), the scatter plot is well clear and the probability of error is on the order of 2 × 10⁻⁶. Therefore compared to the numer of transmitted symbols in each transmission which is 105, Pe becomes approximately zero. In addition, 2500 symbol is applied for equalizer training and for convergence, the equalizer requires over 85 iterations.
 (a)
(a)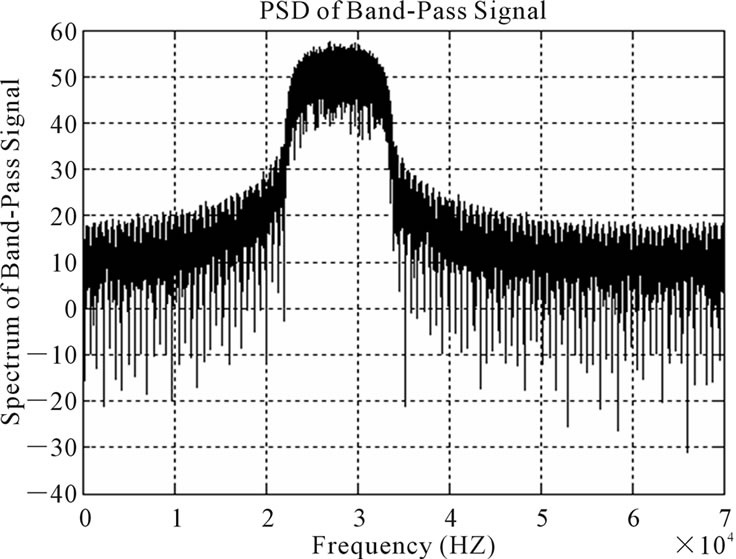 (b)
(b)
Figure 11. (a) Constellation diagram of QPSK symbols. (b) power spectrum density of band-pass signal before entering the channel.

Figure 12. Inference caused among QPSK symbols after passing the channel.
 (a)
(a)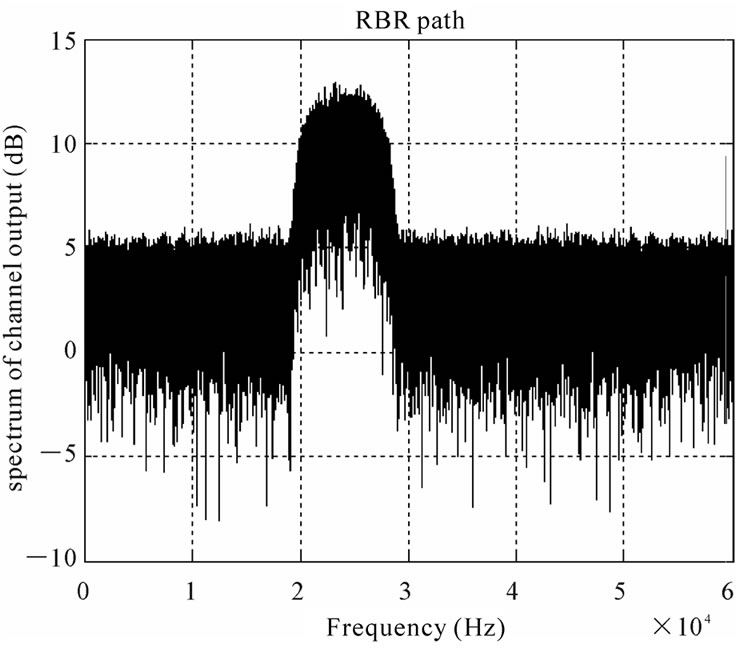 (b)
(b)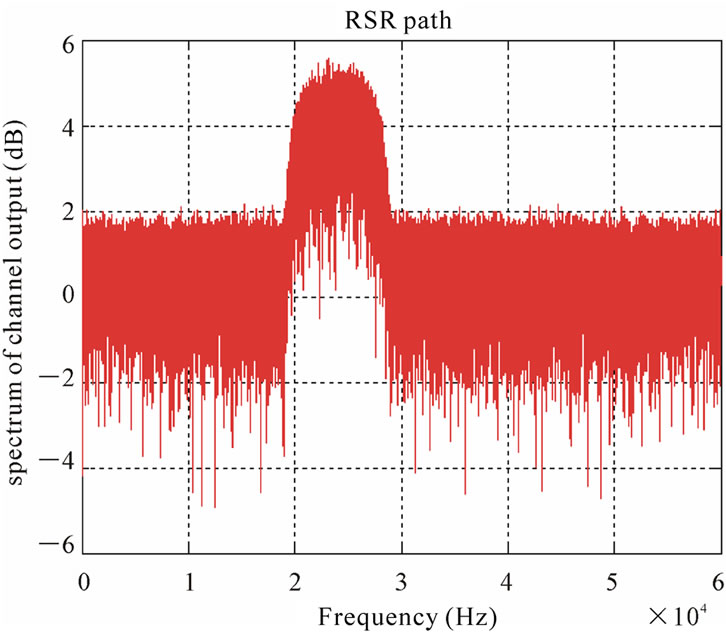 (c)
(c) (d)
(d)
Figure 13. Power spectrum density of the four special paths used in the simulation. (a) Direct Path (DP). (b) Refracted Bottom Reflected (RBR). (c) Refracted Surface Reflected (RSR). (d) Refracted Surface Reflected Bottom Reflected (RSRBR).
 (a)
(a)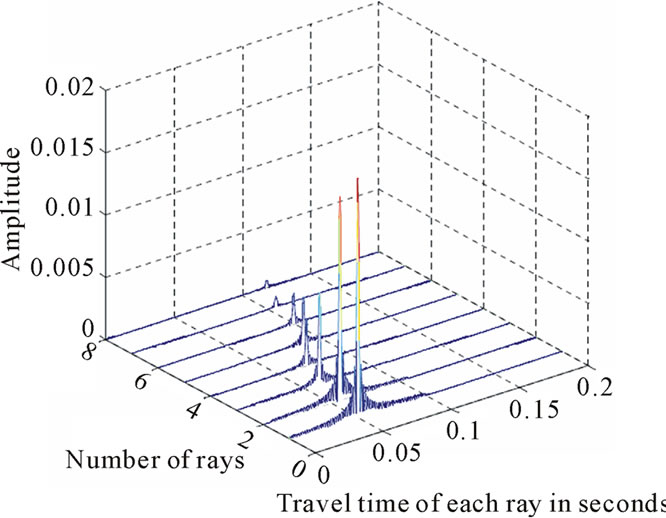 (b)
(b)
Figure 14. (a) Received signals from different paths of channel without considering multipath effects. (b) Received signals from different paths of channel by considering multipath effects. In this model, channel has 8 paths. The first signal is for the direct path and the delays of other paths are calculated based on the traveling time of the first path.
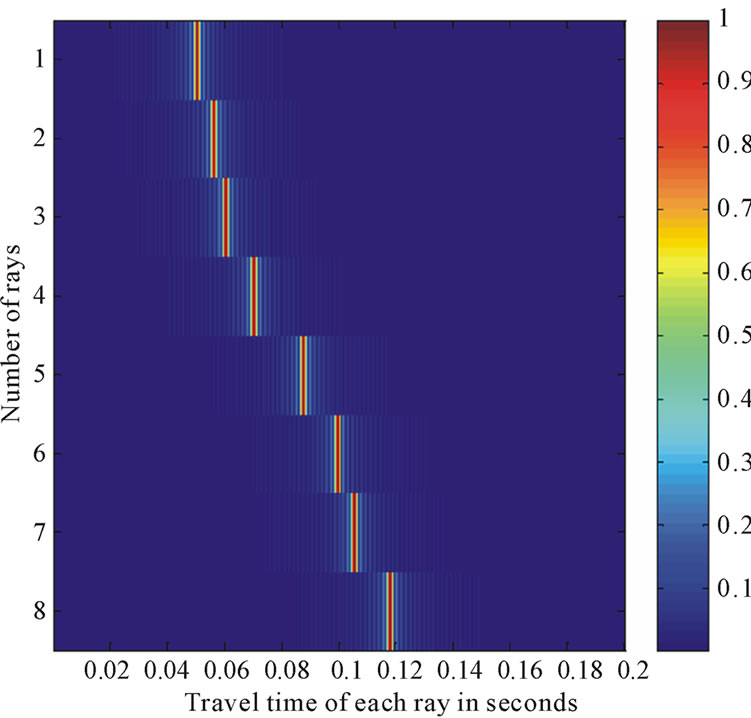
Figure 15. Multipath propagation depicting delays in 2Dview.
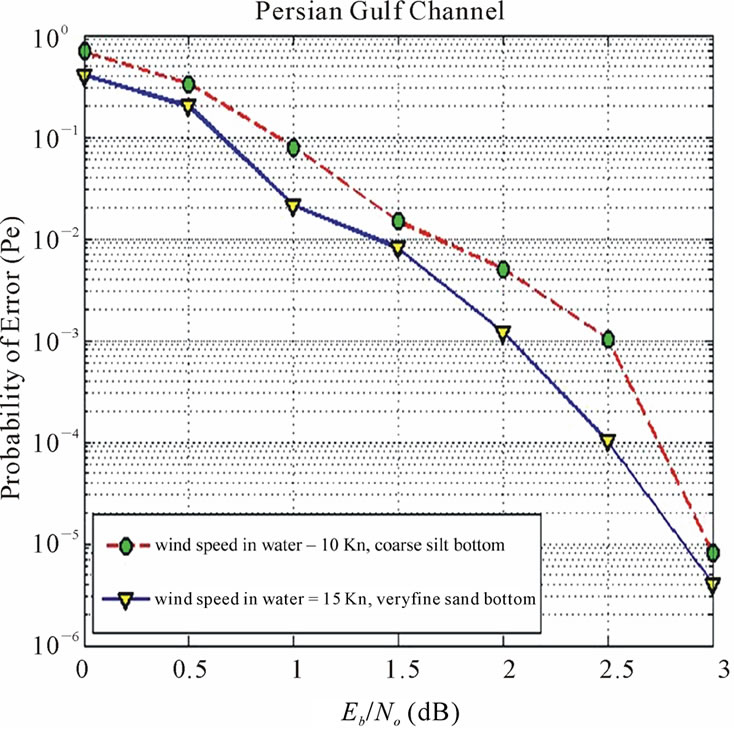
Figure 16. BER of detected symbols versuse SNR under the condition of two different wind speeds and bottom types.
6. Conclusions
According to the real data obtained from field measurements in the Persian Gulf and the simulations to which applied, at the first place, we present (9) as a suitable empirical formula describing the sound speed profile in the Strait of Hormuz. Secondly, on the basis of the presented patterns, considering a five-path channel is appropriate for mentioned region. Thirdly, in order to achieve reliable and band-width efficient communica-
 (a)
(a) (b)
(b)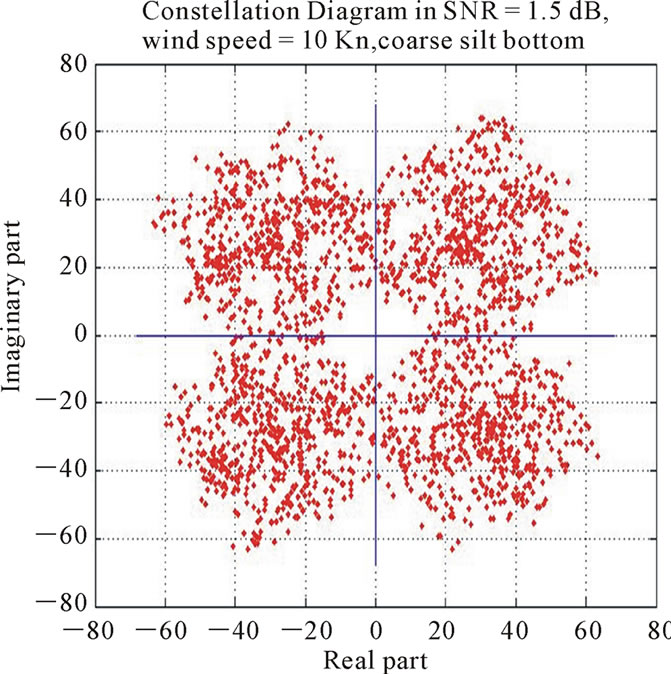 (c)
(c)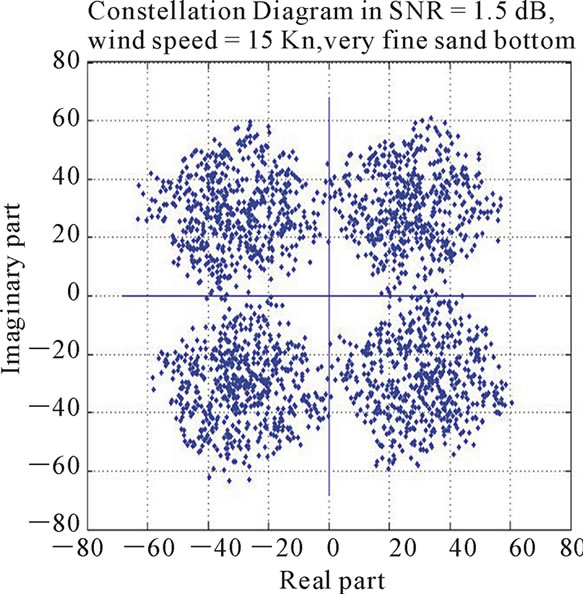 (d)
(d)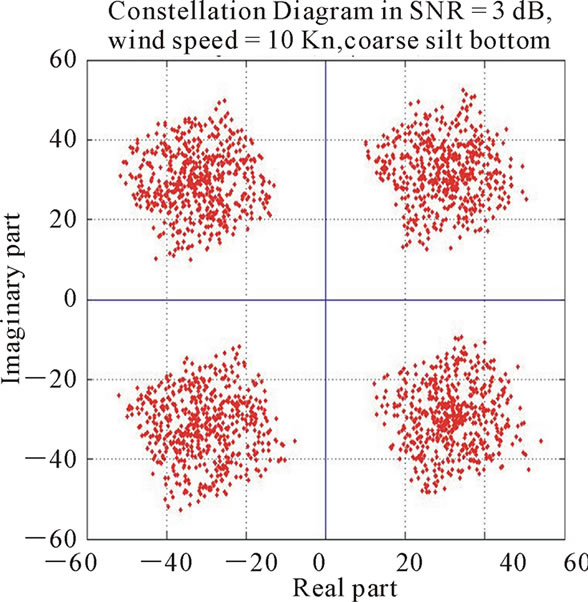 (e)
(e)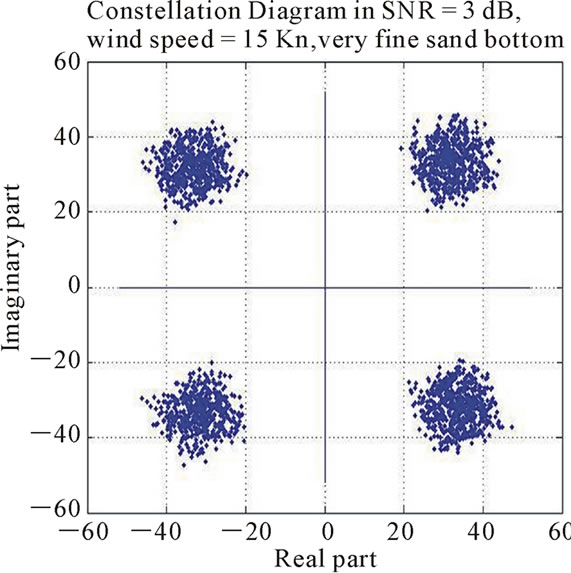 (f)
(f)
Figure 17. Output scatter comparison of detected symbols in various SNR, wind speed, and bottom type. In (a, c, e): SNR = dB, 1.5 dB, 3 dB, respectively and wind speed = 10Kn, for a coarse silt bottom. In (b, d, f): SNR = 0 dB, 1.5 dB, 3 dB, respectively and wind speed = 15 Kn, for a very fine sand bottom.
tions over an UWA short-range shallow water channel similar to the Persian Gulf, using linear prediction coding to compress acoustic signals and RC5 cryptography algorithm, because of the opportunity for great flexibility in both performance characteristics and the level of security, has a good performance. Finally, employing DFE successfully copes with ISI and phase variations due to multipath propagation in the Persian Gulf channel.
7. References
[1] M. Stojanovic, “Recent Advances in High-Speed Underwater Acoustic Communications,” IEEE Journal of Oceanic Engineering, Vol. 121, No. 2, 1996, pp. 125-136. doi:10.1109/48.486787
[2] M. Stojanovic, J. A. Catipovic and J. G. Proakis, “ReducedComplexity Multichannel Processing of Underwater Acoustic Communication Signals,” Journal of the Acoustical Society of America, Vo1. 98, No. 2, 1995, pp. 961-972.
[3] M. Johnson, L. Freitag and M. Stojanovic, “Efficient Equalizer Update Algorithms for Acoustic Communication Channels of Varying Complexity,” Proceedings of IEEE OCEANS197 Conference, Halifax, Nova Scotia, October 1997, pp. 580-585.
[4] P. Bragard and G. Jourdain, “A Fast Self-Optimized LMS Algorithm For Nonstationary Identification Application to Underwater Equalization,” Proceedings of ICASSP’90, Albuquerque, 3-6 April, 1990, pp. 1425-1428.
[5] B. Geller, V. Capellano, J. M. Brossier, A. Essebar and G. Jourdain, “Equalizer for Video Rate Transmission in Multipath Underwater Communications,” IEEE Journal of Oceanic Engineering, Vol. 21, No. 2, 1996, pp. 150- 155. doi:10.1109/48.486790
[6] M. Kocic, D. Brady and M. Stojanovic, “Sparse Equalization for Real-Time Digital Underwater Acoustic Communications,” Proceedings of IEEE Oceans’95, San Diego, 9-12 October 1995, pp. 1417-1421.
[7] A. S. Spanias, “Speech Coding: Tutorial Review,” Proceedings of IEEE, Vol. 82, No. 10, 1994, pp. 1541-1582. doi:10.1109/5.326413
[8] T. Painter and A. S. Spanias, “Perceptual Coding of Digital Audio,” Proceedings of IEEE, Vol. 88, No. 4, 2002, pp. 451-515. doi:10.1109/5.842996
[9] M. Y. Rhee, “Internet Security,’’ John Wiley & Sons Ltd, New York, 2003.
[10] B. Stephen, “Error Control Systems for Digital Communication and Storage,’’ Prentice Hall, Upper Saddle River, 1995.
[11] M. C. Jeruchim, P. Balaban and K. S. Shanmugan, “Simulation of Communication Systems,’’ Plenum Press, New York, 1992.
[12] K. O. Emery, “Sediments and Water of the Persian Gulf,” AAPG Bull, Vol. 40, 1956, pp. 2354-2383.
[13] E. Seibold and J. Ulrich, “Zur Bodengestalt des Nordwestlichen Gulfs von Oman,” Meteor Forsch Ergebnisses, Reihe C, Vol. 3, 1970, pp. 1-14.
[14] R. M. Reynolds, “Physical Oceanography of the Gulf, Strait of Hormuz, and the Gulf of Oman,” Results from the Mt Mitchell Expedition, Marin Pollution Bulltin, Vol. 27, 1993, pp. 35-59.
[15] W. E. Johns, F. Yao, D. B. Olson, S. A. Josey, J. P Grist, and D. A. Smeed, “Observations of Seasonal Exchange through the Straits of Hormuz and the Inferred Freshwater Budgets of the Persian Gulf,” Journal of Geophysical Research, Vol. 108, No. 12, 2003, p. 3391. doi:10.1029/2003JC001881
[16] S. A. Swift and A. S. Bower, “Formation and Circulation of Dense Water in the Persian/Arabian Gulf,” Journal of Geophysical Research, Vol. 108, No. 1, 2003, p. 3004. doi:10.1029/2002JC001360
[17] M. Sadrinasab and K. Ampf, “Three-Dimensional Flushing Times of the Persian Gulf,” Geophysical Research Letters, Vo. 31, No. L24301, 2004, pp. 252-263.
[18] M. Sadrinasab and K. Kenarkoohi, “Numerical Modelling of Sound Velocity Profile in Different Layers in the Persian Gulf,” Asian Journal of Applied Sciences, Vol. 25, No. L65255, 2009, pp. 232-239.
[19] A. D. Aref, “Survey Underwater Acoustic Communication with Design and Simulation of an Underwater Acoustic Communication System in the Persian Gulf,” MSc Thesis, Malek-e Ashtar Industrial University, Tehran, 2010.
[20] H. Medwin and C. S. Clay, “Fundamentals of Acoustical Oceanography,” Academic Press, San Diego, 1998, pp. 220-228.
[21] A. Falahati, B. Woodward and S. C. Bateman, “Underwater Acoustic Channel Models For 4800 b/s QPSK Signals,” IEEE Journal of Oceanic Engineering, Vol. 16, No. 1, 1991, pp. 12-20. doi:10.1109/48.64881
[22] R. J. Urick, “Ambient Noise in the Sea,” 3rd Edition, Eninsula Publishing, Newport Beach, 1984, pp. 155-205.
[23] L. M. Brekhovskikh and Yu. P. Lysanov, “ Fundamentals of Ocean Acoustics,” 2nd Edition, Springer-Verlag, Berlin, 1999, pp. 130-155.
[24] K. C. Hegewisch, N. R. Cerruti and S. Tomsovic, “Ocean Acoustic Wave Propagation and Ray Method CorRespondence: Internal Wave Fine Structure,” The Journal of the Acoustical Society of America, Vol. 114, No. 4, 2003, p. 2428.
[25] A. D. Are and B. A. Arand, “Design and Simulation of a New Model for Shallow Water Multipath Acoustic Channel in the Persian Gulf,” In: 5th International Symposium on Telecommunications, Kish Island, 4-6 December, 2010.
[26] J. P. Gomes and V. Barroso, “SDR Underwater Acoustic Modem,” Ph.D Thesis, Instituto de Sistemas e Robotica, Lisboa, April 2005.
[27] J. G. Proakis, M. Stojanovic and J. Catipovic, “Phase Coherent Digital Communications for Underwater Acoustic Communications,” IEEE Journal of Oceanic Engineering, Vol. 19, No. 1, January 1994, pp. 100-111. doi:10.1109/48.289455
[28] A. Masoomzadeh-Fard and S. Pasupathy, “Nonlinear Equalization of Multipath Fading Channels with NoncoHerent Demodulation,” IEEE Journal on Selected Areas in Communications, Vol. 14, No. 3, 1996, pp. 512-520. doi:10.1109/49.490236
[29] M. Stojanovic, J. A. Catipovic and J. G. Proakis, “Phase Coherent Digital Communications for Underwater Acoustic Channels,” IEEE Journal of Oceanic Engineering, Vol. 19, No. 1, 1994, pp. 100-111. doi:10.1109/48.289455
[30] J. G. Proakis, “Digital Communications,” 3rd Edition, McGraw Hill, Boston, 1995.