Journal of Water Resource and Protection
Vol. 2 No. 1 (2010) , Article ID: 1188 , 13 pages DOI:10.4236/jwarp.2010.21006
Studying Heavy Metals in Sediments Layers along Selected Sites on the Lebanese Coast
Department of Environment, Agricultural Engineer, Lebanese University, Dekwanek, Lebanon
E-mail: nadinenassif3@hotmail.com
Received October 28, 2009; revised November 18, 2009; accepted November 26, 2009
Keywords: Pollution, Sediments, Heavy metals, Coast, Lebanon
ABSTRACT
Ensuring the environmental protection of the Lebanese coast requires a continues monitoring system. For this purpose, four heavy metals (Fe, Mn, Cu and Pb in the marine sediments along the Lebanese coast were selected for analysis Sampling was carried out from two sites: Beirut and Batroun. Thus, 1g of dried sample is used for digestion by wet mineralization in order to determine the concentration of the four heavy metals by atomic absorption spectrometry. The results showed that Beirut area is polluted, by Fe and Mn as well as the station Bat 2 of Batroun. For Cu and Pb, Batroun region is more polluted in the superficial layers. The analysis also showed significant difference between the sites except for Cu. A difference between depths and between particles size fractions are observed for all the parameters studied. There is no a significant difference in layer sequence except for the Pb, and neither between the repetitions of the same sample. Results showed that the values of the four metals studied do not exceed the maximum limits at both sites, but they showed increase in comparison with the analyses obtained before July 2006 conflict, which was caused by the release of large quantity of fuel-oil from Jiyeh Power Station.
1. Introduction
The Lebanese coast has been threatened by a severe environmental disaster in its history due to the existed conflict in July 2006, which caused the release of 15,000 tones of fuel-oil after the destruction of oil tanks of the Jiyeh Electrical Power Station (30km south Beirut) [1].
This resulted a serious marine pollution, including a large portion of the marine ecology. This, in turn added a new aspect of pollution to the existing industrial, agricultural and urban ones, which cause complications on the aquatic environment that covers about 18,000 hectares (or 16% of the Lebanese territory), at a length of about 220km along the coast [2].
Among the contaminants brought about by human activities, heavy metals play a crucial role. Unlike most organic pollutants, heavy metals are natural constituents of the earth’s crust, which are naturally released as a result of rock and soil weathering and erosion. The rapid population growth, is accompanied with several human activities, notably the industrial exploitation of natural resources, as well as sewage and refuse dumping into the sea without any treatment. They are often convoyed to the marine environment along rivers and perennial stream. Heavy metals are at low concentrations in aquatic ecosystems where they tend to accumulate in marine sediments to reach toxic levels [3,4]. The difficulties in collecting valid samples for heavy metals analysis in marine water, made several researches focuses primarily on marine sediments where heavy metals are located at higher concentrations. Sediment is a compartment integrator of contaminants and can keep heavy metals among their layers and give an entire chronology of deposition mechanism.
Recent studies on marine sediments, conducted in Lebanon before the 2006 conflict, showed different heavy metal concentrations in different sites to the known concentration of heavy metals along the Mediterranean coasts [5,6].
In order to determine heavy metal content along the Lebanese coast, two representative sites were selected; Beirut (along the middle Lebanese coast) and Batroun to the north coastline. They are major ports, and then they contain a number of industrial activities. This study aims to evaluate the contents of four metals: lead, copper, iron and manganese. These elements are among the main elements released by industries effluents and different factories along the Lebanese coast.
The study aims also to carry out a comparative analysis of heavy metals at different sediments depth for each site, and even a comparison between the different depths in the same site that has not been addressed in the previous studies. The difference between repetitions made for the same sample (duplicate) was measured.
On the other hand, the results will help evaluating, for the first time in Lebanon, the influence of the size fraction to determine the most appropriate fraction containing the highest concentration of metals.
According to the concentration of heavy metals found in sediments in each region, we would be able to compare the degree of contamination before and after the 2006 conflict and then identify which of the two regions was more influenced by pollution.
2. Methodology
2.1. Sampling
The samples were selected from sediments cored from the two sites (Figure 1):
Site 1: Beirut (Ramlet el Bayda)
Site 2: Batroun (Selaata region)
In order to assess the detailed concentration of pollution, three stations were selected in each site. They diverse by the depth of sediment (Table 1).
Samples were taken by carrots, made of plastic material to avoid contamination, with 40cm length and 10cm diameter, these carrots were previously washed with HCL and HNO3.
From each station, a spacing of 2 levies distant from each other by 30cm was done. The quantity of sediment samples was different from one place to another because of the granulometric so we had different amounts of sediment in the carrot (Figures 2 and 3).

Figure 1. Localization of the selected samples.
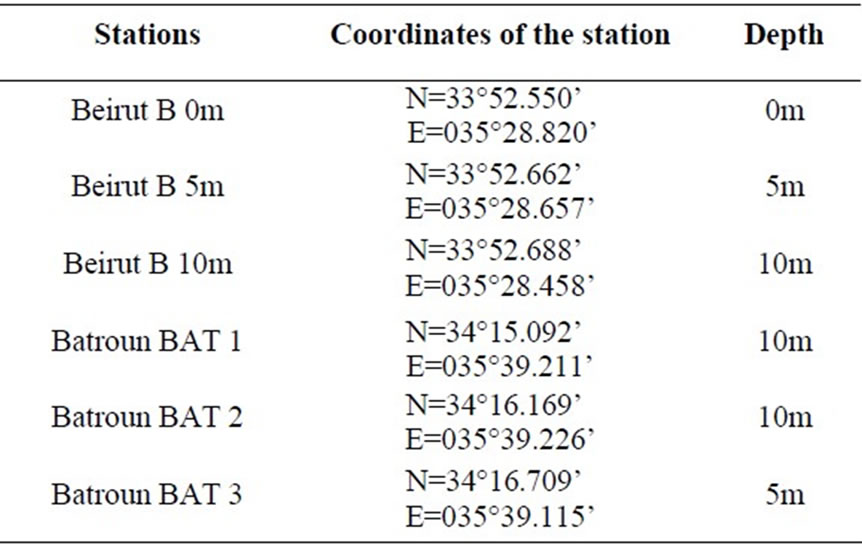
Table 1. Location and depths of each station.
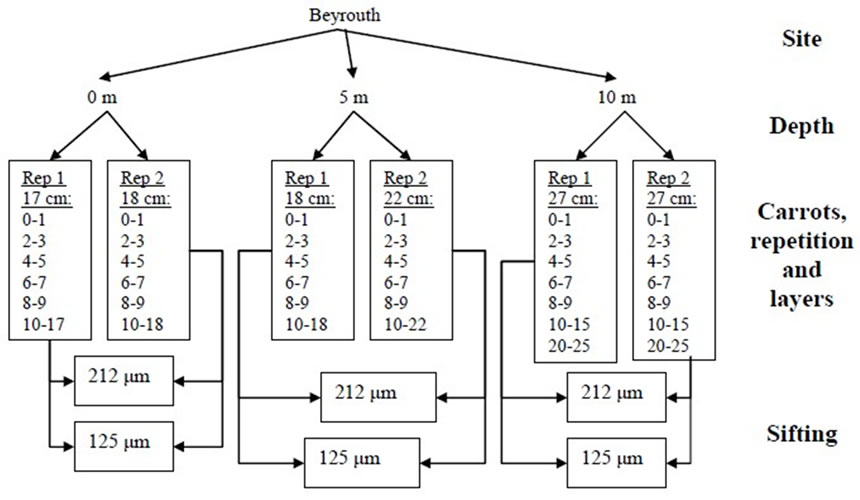
Figure 2. Schematic presentation of the sampling characteristics in Beirut.
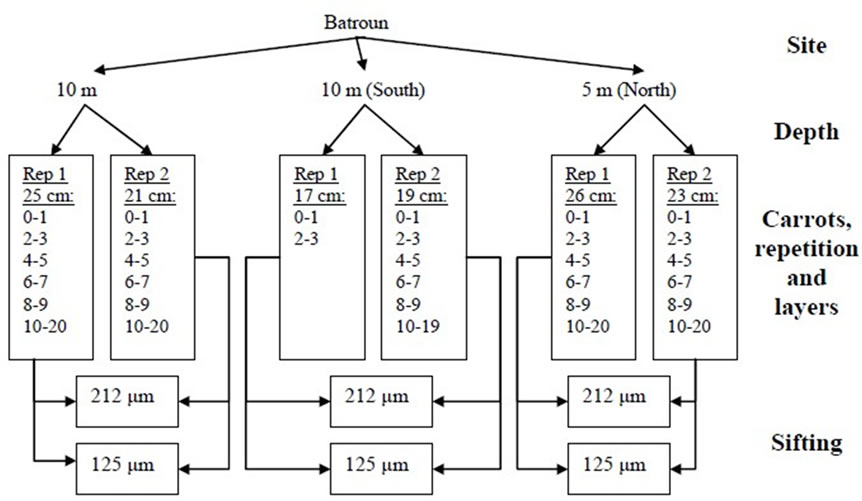
Figure 3. Schematic presentation of the sampling characteristics in Batroun.
2.2. Laboratory Analysis
1) Sampling equipments used in the field or the laboratory were maintained in safe condition and clean and had no trace of corrosion. They were handled and stored with the necessary precautions to avoid any aspect of contamination. All glassware used were previously soaked in 5% HCl, then 5% HNO3 for 24 hours each, and then rinsed with double deionized water. All bottles used for transport and storage of samples were of polyethylene and cap perfectly sealed.
2) For the drying samples, we had cut carrots each 1 cm, and each 1cm of sediment was transferred and preserved separately in a plastic bag placed at room temperature for 8 days until we had a constant mass. This step, drying samples, is essential in order to improve the efficiency of mineralization acid, because the homogenization of dry samples is required other than wet samples. Once dried, the sediment is transferred separately in containers polypropylene previously labeled.
3) Grinding of sediments was carried out to increase the homogenization of samples.
4) Sifting was also applied to study the influence of particle size on the concentration of heavy metals. Sediments were sifted through sieves whose pores were respectively 212 μm, 125 μm and 38 μm [7].
5) Determining the size of the sample of sediments was the aim of this step to reduce the mass of an object without altering its other properties, and also to reduce the error to the least. The composition of the laboratory sample should be identical as possible to that of the initial sample [8]. For that, we had chosen randomly six samples from the three regions. For each sample, we crushed a small part of the sample, and then weighed four different mass: 0.25g, 0.5g, 1g and 2.5g. Then there will be 24 solutions which to mineralize, similar to the same way to determinate their concentrations by Atomic Absorption Spectrometry (AAS).
6) Mineralization: is an essential step for the solution before analysis. To mineralize samples, the wet method was used, according to the following procedure, which was added to the test weighing, 20ml of HNO3 (65%), on a hotplate, with magnetic agitation without boiling and evaporation. After six to seven hours, 5 ml of HCl (37%) were added every 30 minutes to three times until the total digestion. The acid then evaporated and the dry residue was recovered with 50ml of HNO3, then we followed centrifuge and filtered in order to analyze them [9–11].
7) Analysis by Atomic Absorption Spectrometry allowed determining the levels of heavy metals by using a high temperature, the atomization, according to the case with a flame (for major elements like Fe and Mn) or an oven (for minor elements Cu and Pb). Consequently, all samples were measured with an Atomic Absorption Spectrometer (ZEEnit - 700) equipped with a system of correction Zeeman. A mixture of air-acetylene was used for (AAS) flame and argon for (AAS) oven. The curve of standard range with several known concentrations was primarily prepared. To analyze samples by (AAS), we need 1/7 dilution by HNO3 (0.5N). Each sample was passed by a beam of light wavelength and intensity defined (λFe=248.5 nm, λMn=279.5 nm, λCu=324.8 nm, λPb=283.3nm) to measure their absorbance, then the concentration of each sample was identified, according to the curve of range standard of the metal [9,10,12].
8) After determining the size of sediment sample; however, all samples were mineralized, which were sifted. The mineralization was made for samples with the two fraction sizes 38-125 μm and 125-212 μm (since fraction <38μm is negligible). When the mineralization of theses samples has been done, the concentration was determined of every sample for each metal separately (for the two fraction sizes) by (AAS) with the same procedure followed in the determination of the size of sediment sample.
3. Results
Five major findings were identified in this study, and then they were assessed to evaluate the degree of heavy metal contamination in the marine environment of Lebanon, as follows:
3.1. Percentage of Different Fraction Size in the Sediments Samples
Similar size fractions of different samples in each carrot were mixed to determine the percentages of each size fractions studied in each carrot of the two sites (Table 2). Results were plotted graphically (Figures 4 and 5).

Table 2. Percentage of size fraction.
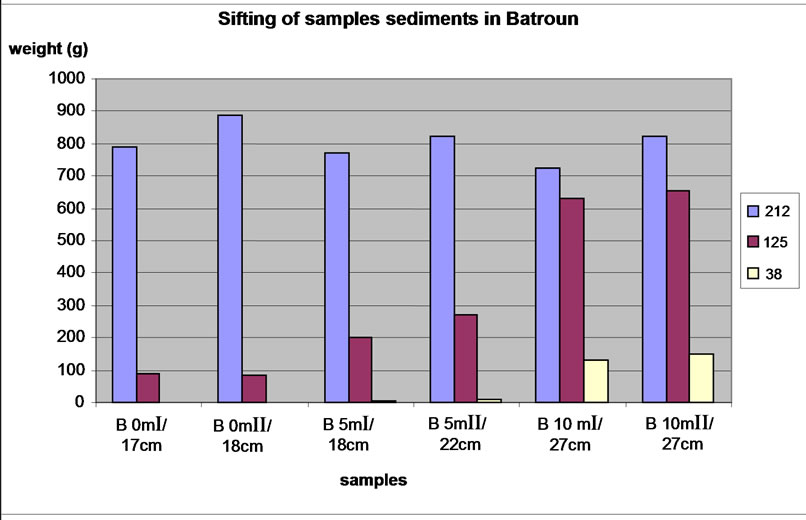
Figure 4. Distribution of the three fractions size in each carrot in Beirut site.
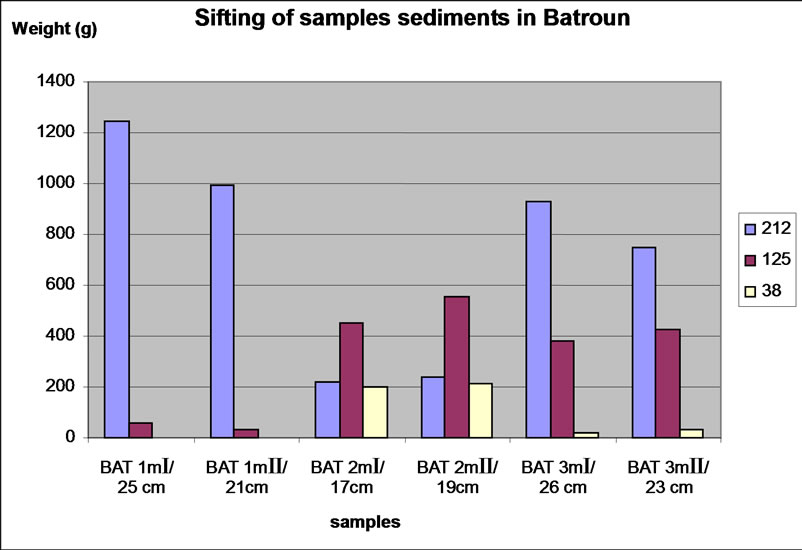
Figure 5. Distribution of the three fractions size in each carrot in Batroun site.
We note, similarly, that with increasing depth in Beirut site, the size fraction 125-212 μm was declined and the proportions of fractions <38 μm and 38-125 μm gradually increased. For the sample of Batroun site, the nature of rocks differs widely between depths, samples with the same depth Bat 1 and Bat 2 have a different composition. Comparing to the classification of sedimentary rocks in geology, the size fraction <38 μm is composed of silt and clay. The size fraction 38-125 μm was composed by fine sand and less silt, and the size fraction 125-212 μm was composed by fine sand and some sand.
3.2. Determination of the Size of Sediment Sample
The majority of concentrations on the three tests taken:
0.25g, 0.5g and 1g, treated in the same way, were proportional to the increase in weight of these three tests taken. However, this proportionality would no longer be applicable for most concentrations on the test 2.5g. The test sample of 2.5g requires a long period of mineralization and a high quantity of acid. In this study we used 1g as the size of sediment sample [13].
3.3. Concentrations of Heavy Metals
It was deduced that concentrations analyzed of Fe, Mn, Cu and Pb found in sediments of the two Lebanese sites (Table 3) were below the standards [14,15], and therefore they were acceptable, with the exception for some concentrations concerning the heavy metal Fe of the levies B 0m1 and the station Bat 2, which contain several values that transcend the limit and are polluted.
It is clear that in the two sites, samples from two levies of the same depth have the same proportions for each size fractions. The repeatability of samples was acceptable.
3.3.1. Analyses of Variance (SPSS)
The analyses of variance (SPSS) made for each site and for each heavy metal (Tables 4 and 5) showed a significant difference between the results for each studied setting.
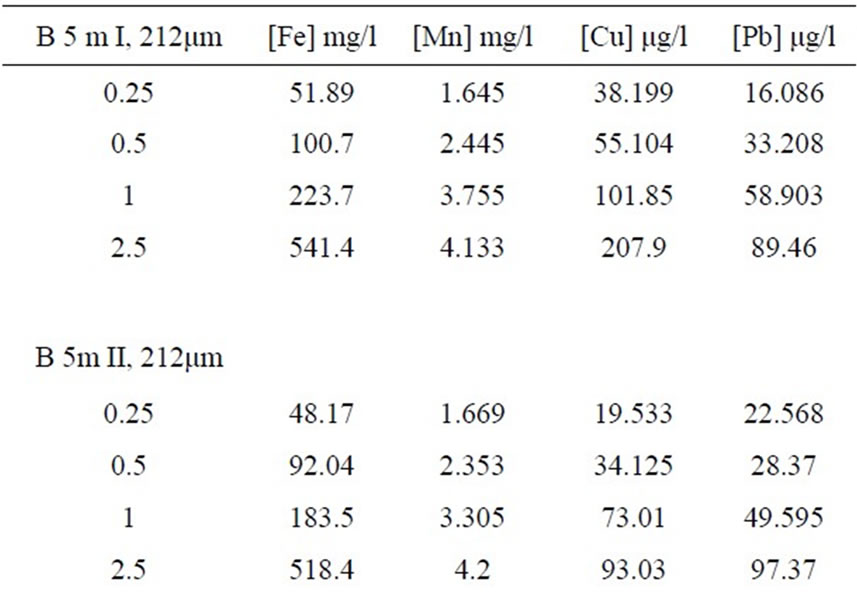

Table 3. Concentrations of Fe, Mn, Cu and Pb to six randomly sample for 4 different sizes of sediment sample.
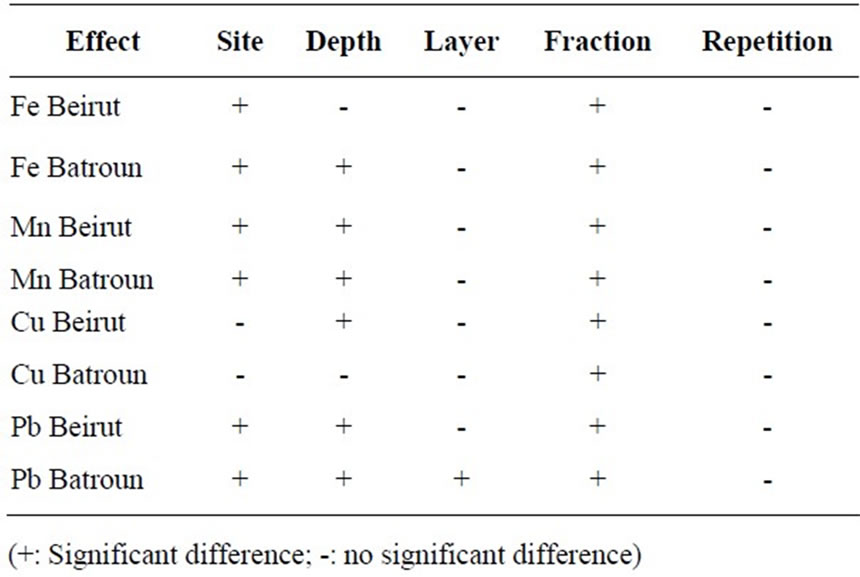
Table 4. The effects of different settings for the Fe, Mn, Cu and Pb.
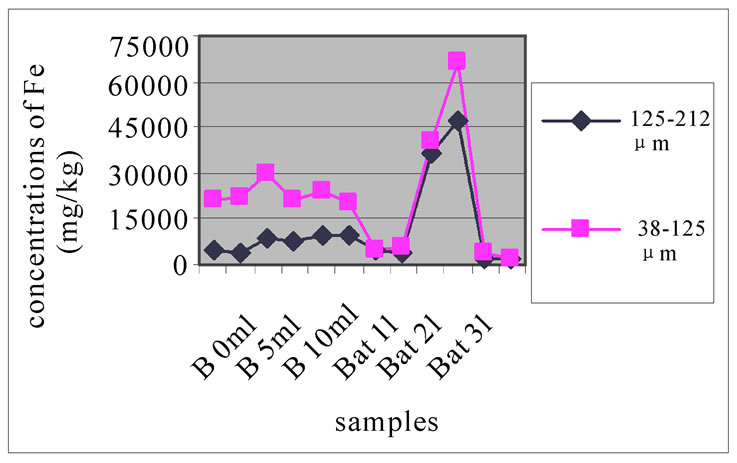
3.3.2. Concentration of Fe
Compared with the concentration of Fe samples (with a diameter <200 µm) taken from the pit of Beirut in 2004 (41.87mg/l) [13], it was found that concentrations of Fe are largely higher due the impact from the conflict of July 2006.
Figure 6(a), (b) and (c) were studying the change in the concentration of Fe, each one concerned a specific layer, between the different sampling made in the two sites and for the two size fractions selected before. In these three layers, for both studied size fractions, the station Bat 2 site was the most concentrated in Fe. The three stations of Beirut had close concentrations of Fe, lower than Bat 2, but higher than those Bat 1 and Bat 3, which had very low concentration of Fe. In the site of Beirut and for the size fraction 125-212 µm, the concentration of Fe in station B 10m is slightly higher than in B 5m which was in turn slightly higher than B 0m. For the size fraction 38-125 µm, the concentrations of Fe in the three depths were very close to each other.
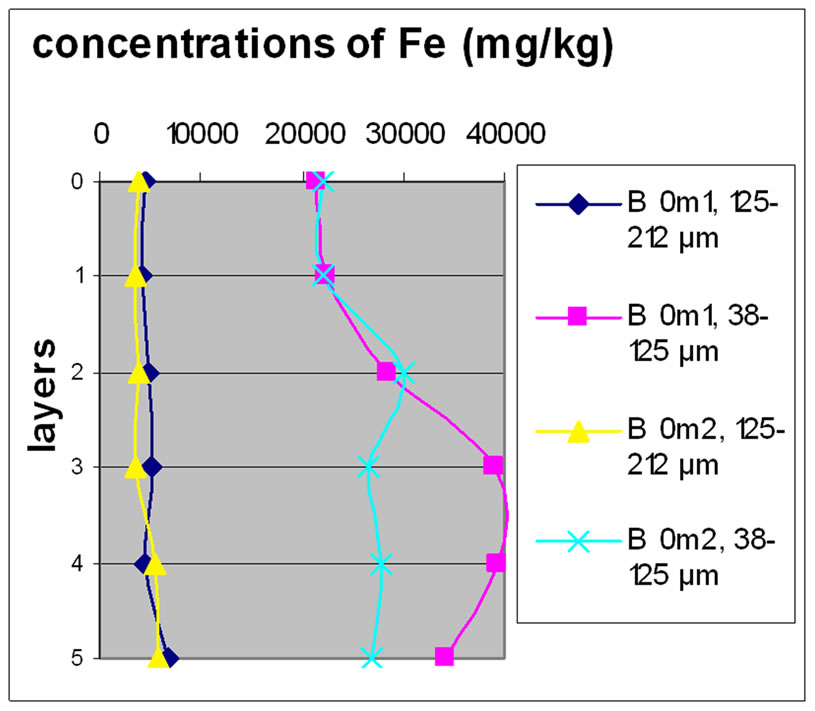
Figure 7 shows the change in the concentration of Fe according to the different layers of a levy. The various points 0, 1, 2, 3, 4 and 5 of the y-axis represent; respectively the first, third, fifth, seventh, ninth and eleventh layers.
The charts in Figure 7 show that there was no significant difference between layers of the same depth, except for Bat 2, which shows some variation between layers because of the heavy concentration of Fe.
Almost all charts show that repetition did not make a significant difference for the concentration of Fe with the exception of Bat 2 for the same reason cited above. It was also observable that the samples with the finer size fraction (38-125 μm) are those who generally greater concentrations of Fe compared to the other fractions, this effect was also observable to the samples of Beirut.
3.3.3. Concentration of Mn
Figure 8(a), (b) and (c) shows the change in the concentration of Mn, each one concerned a specific layer, between the different sampling made in the two sites and for the two size fractions selected before. The results show the difference between the two sites. The station Bat 3 is the least concentrated among all others and for both size fractions. The two stations B 10m and Bat 2 are most concentrated for the two size fractions. In Beirut, B10m had the most concentrated in Mn, then B 5m and then B 0m.
The results for Mn show that samples of Beirut and Batroun did not differ significantly according to the layers.
It is obvious from Figures 8 and 9 that there was no significant difference for the repetition of the samples. Moreover, the results show that in the site of Beirut the size finer fractions contain a high concentration of Mn. While samples of Batroun did not show a difference between the two size fractions, with the exception of Bat 2, which contained a high concentration of Mn.
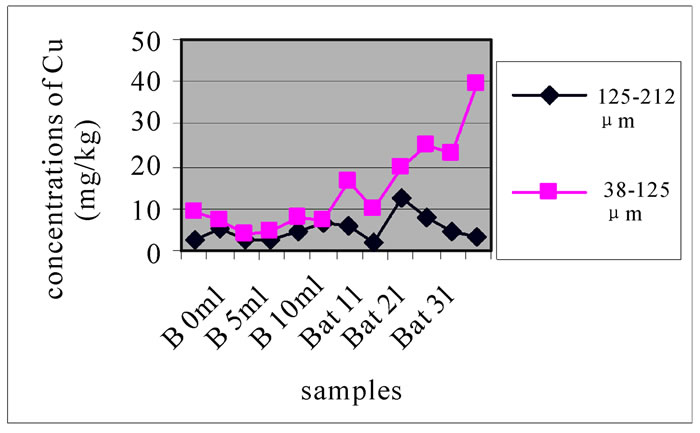
3.3.4. Concentration of Cu
Compared with the concentration of Cu samples (samples with a diameter < 200 µm) taken from the pit of Beirut in 2004 (33.67 µg/l) (13), hence, the concentration of Cu far exceeded the previous values after the conflict of July 2006. Figure 10-a, 10-b and 10-c reveals change in the concentration of Mn, each one concerned a specific layer, between the different sampling made in the two sites and for the two size fractions selected before. For the size fraction 125-212 µm, results show that both sites were highly concentrated and had almost the same concentrations. While, Bat 2 and B10m presented slightly higher concentrations than the other stations.
 (a)
(a) (b)
(b)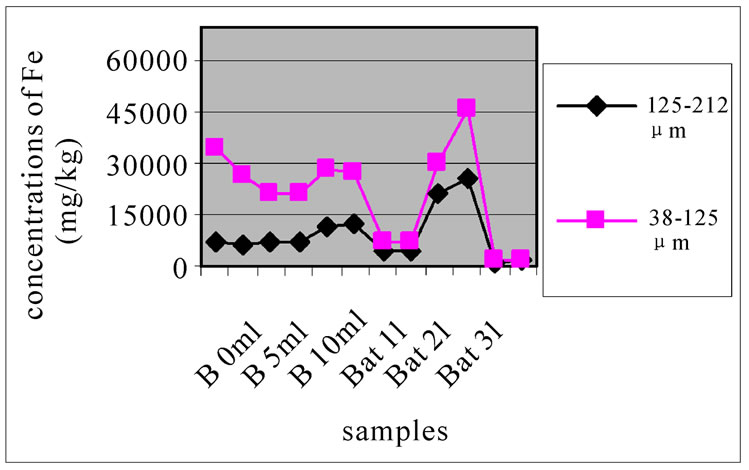 (c)
(c)
Figure 6. Change in the concentration of Fe for the both size fractions of the first layer (a), the seventh layer (b) and the eleventh layer (c), in the different levies of the two sites.
 (a)
(a)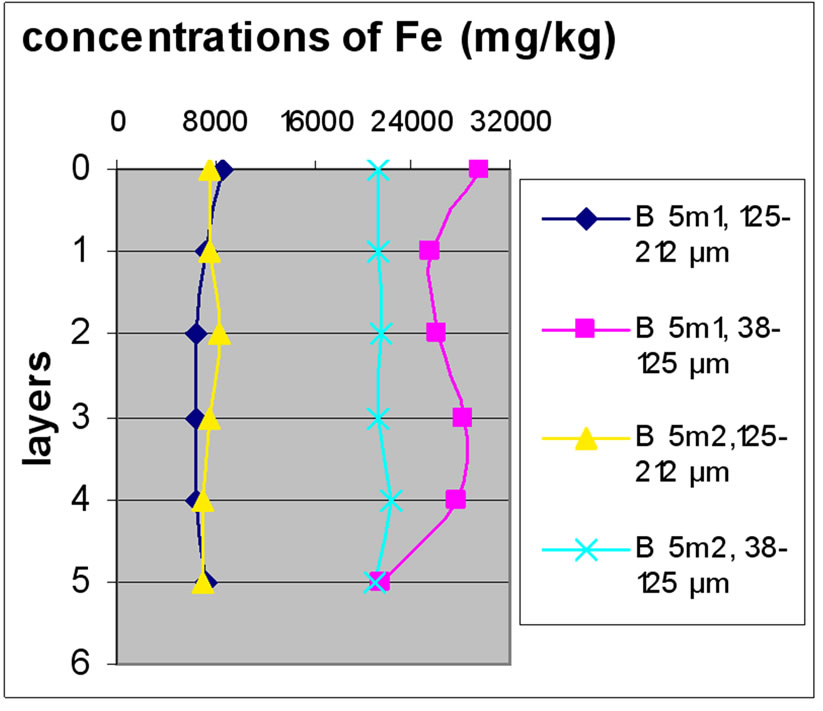 (b)
(b)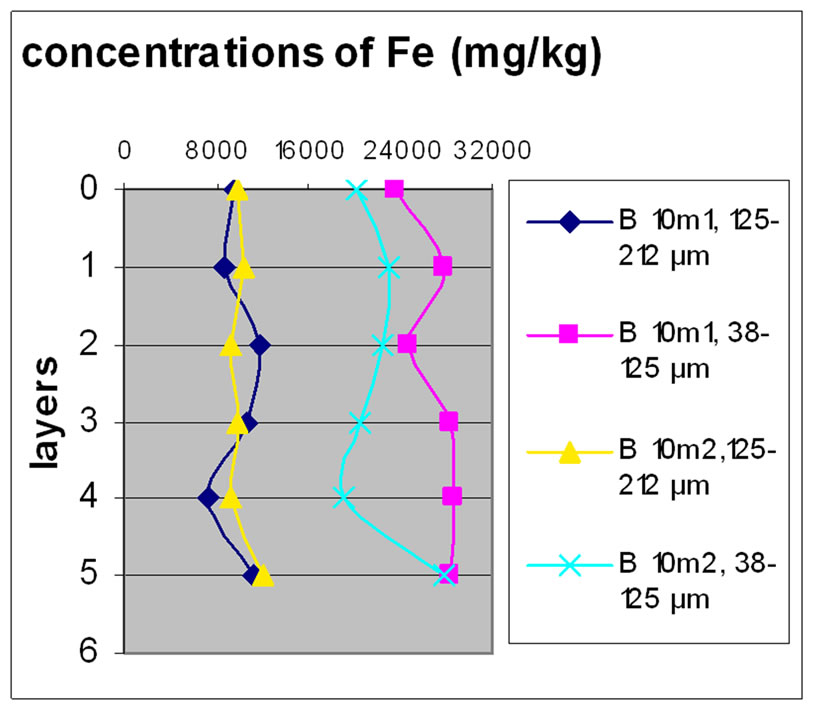 (c)
(c)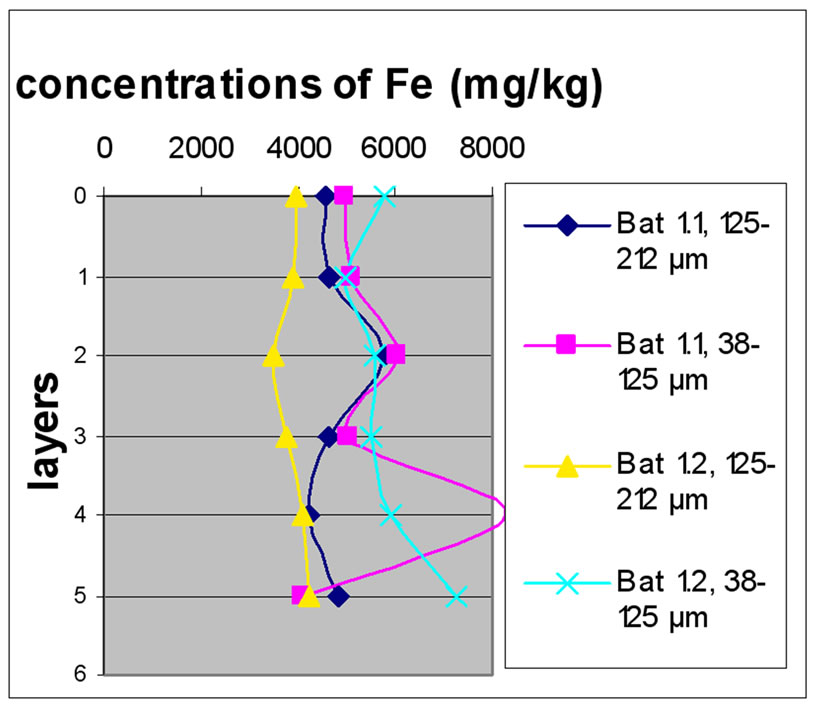 (d)
(d)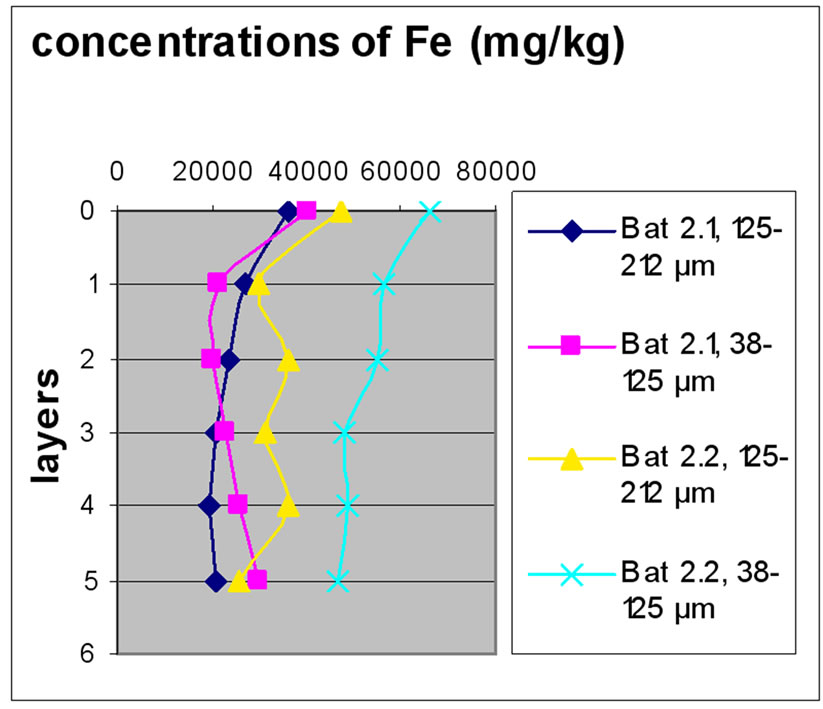 (e)
(e) (f)
(f)
Figure 7. Change in the concentration of Fe (mg/kg) according to the layers for both size fractions in the two sites Beirut and Batroun in B 0m (a), B 5m (b), B 10m (c), Bat 1 (d), Bat 2 (e), et Bat 3 (f).
 (a)
(a) (b)
(b)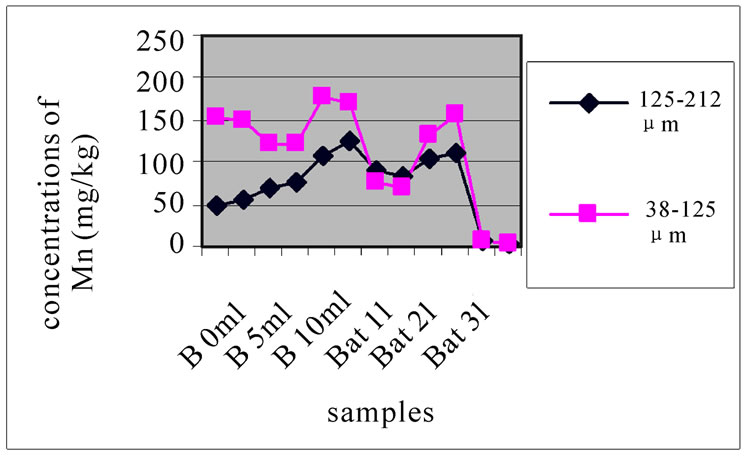 (c)
(c)
Figure 8. Change in the concentration of Mn for the both size fractions of the first layer (a), the seventh layer (b) and the eleventh layer (c), in the different levies of the two sites.
For the size fraction 38-125 µm, Figure 10 shows that the site of Batroun was most concentrated; this was the current state of contamination of the study area. In Figure 10-b and 10-c, both sites were polluted, but pollution in Beirut is merely higher than in Batroun. These two figures represent the state of contamination and temporal evolution of the sites. Bat 3, B 0m and B 10m were most polluted in Cu than the other station.
Figure 11 shows the change in the concentration of Cu according to the different layers of a levy. The different figures show that there was no a large difference according to different layers. It is clear from Figure 10 and 11 that there was no significant difference for the repetition of the majorities of the samples. Samples with the size fraction finer (38-125 µm) had higher concentrations compared to the other portion size of 125-212 µm.
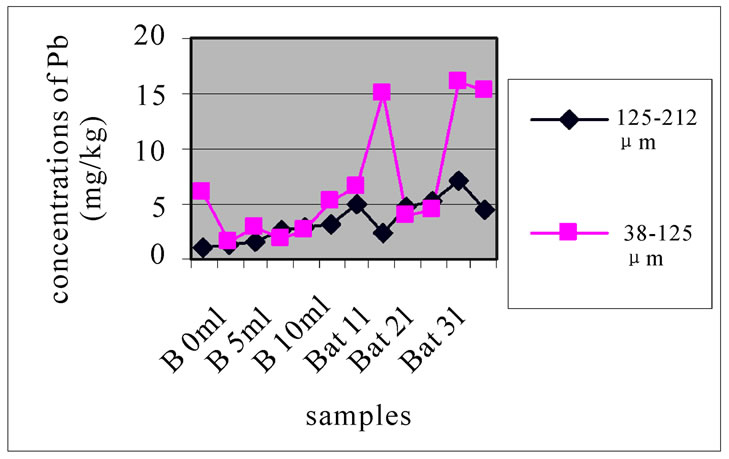
3.3.5. Concentration of Pb
Compared with the concentration of Pb in samples taken from Jiyeh (17 μg/l) [5,6], from Zouk and Selaata (2μg/l), it was resulted that the concentration of lead has increased.
Figures 12(a), (b) and (c) reveal the change in the concentration of Mn, each one concerned a specific layer, between the different sampling made in the two sites and for the two size fractions selected before. Different fig ures show that Batroun site was more concentrated in Pb than Beirut site. This difference was more appreciable in the first layer, which was represented the state of a current and recent contamination. Bat 3 and B 10 and B0m were more concentrated in Pb than the other one.
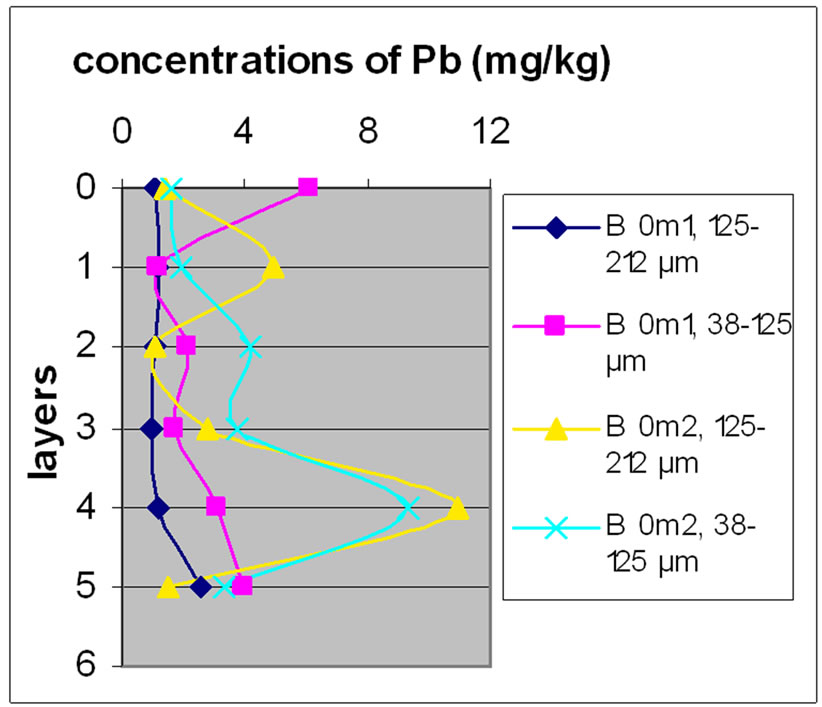
Figure 13 shows the change in the concentration of Cu according to the different layers of a levy. Figures 12 and 13 show that for the site of Beirut, there was no significant difference between layers for the same depth, while for the site of Batroun, there was some difference between layers of the same depth.
 (a)
(a)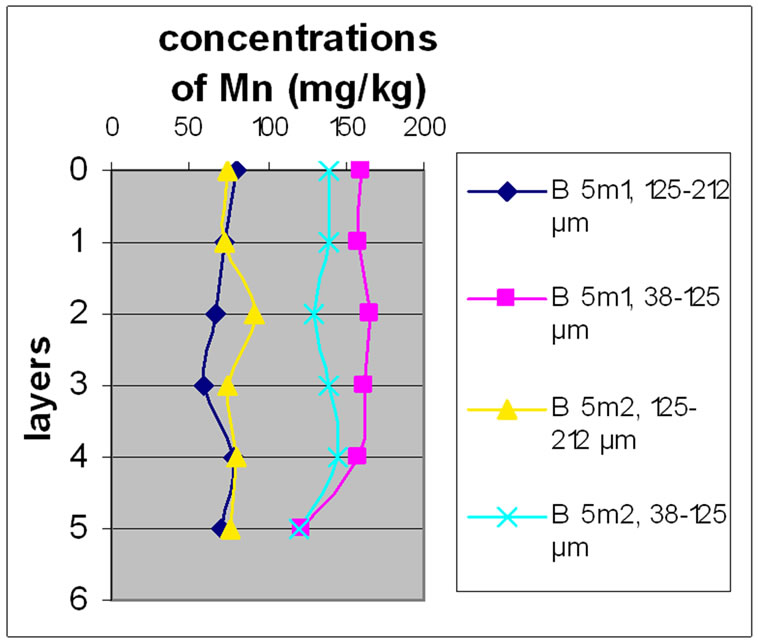 (b)
(b)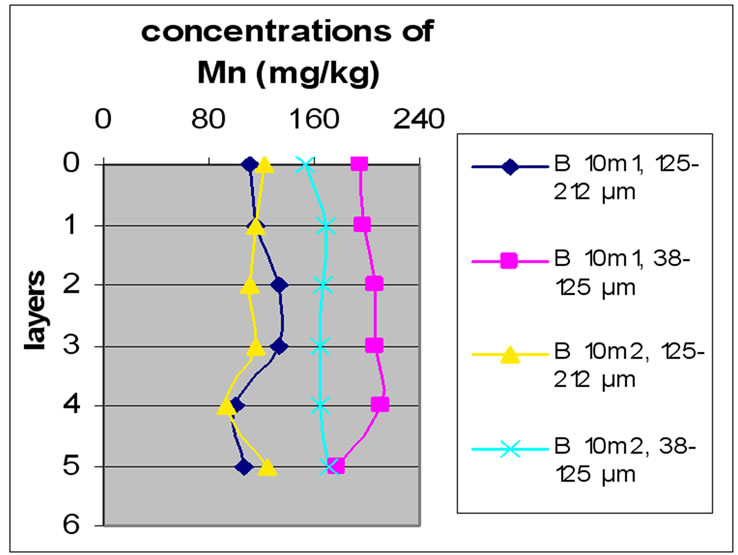 (c)
(c) (d)
(d)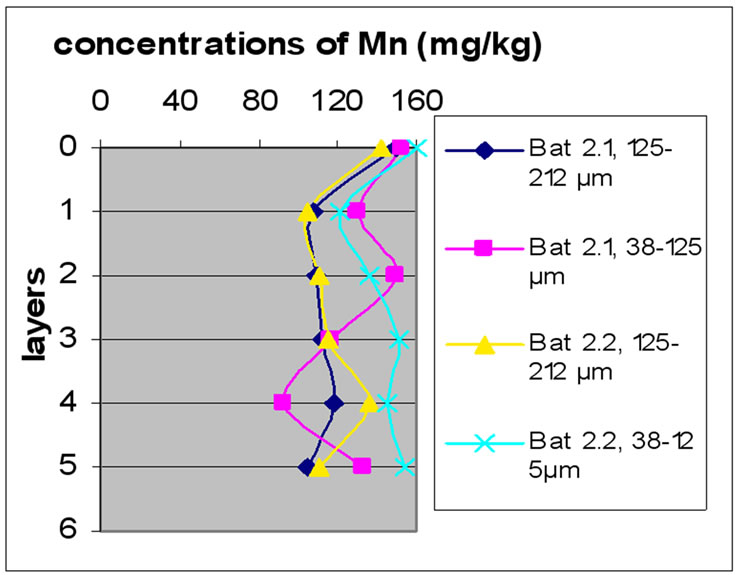 (e)
(e) (f)
(f)
Figure 9. Change in the concentration of Fe (mg/kg) according to the layers for both size fractions in the two sites Beirut and Batroun in B 0m (a), B 5m (b), B 10m (c), Bat 1 (d), Bat 2 (e), et Bat 3 (f).
 (a)
(a)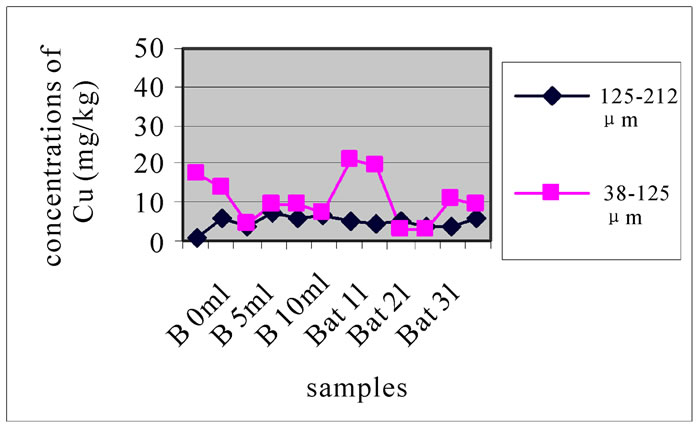 (b)
(b)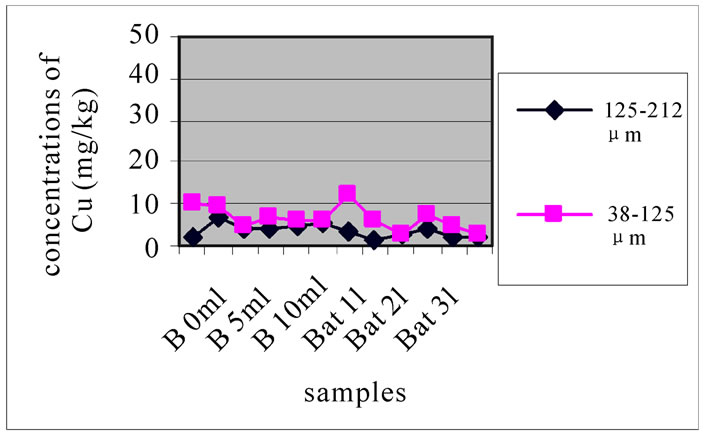 (c)
(c)
Figure 10. Change in the concentration of Cu for the both size fractions of the first layer (a), the seventh layer (b) and the eleventh layer (c), in the different levies of the two sites.
 (a)
(a) (b)
(b)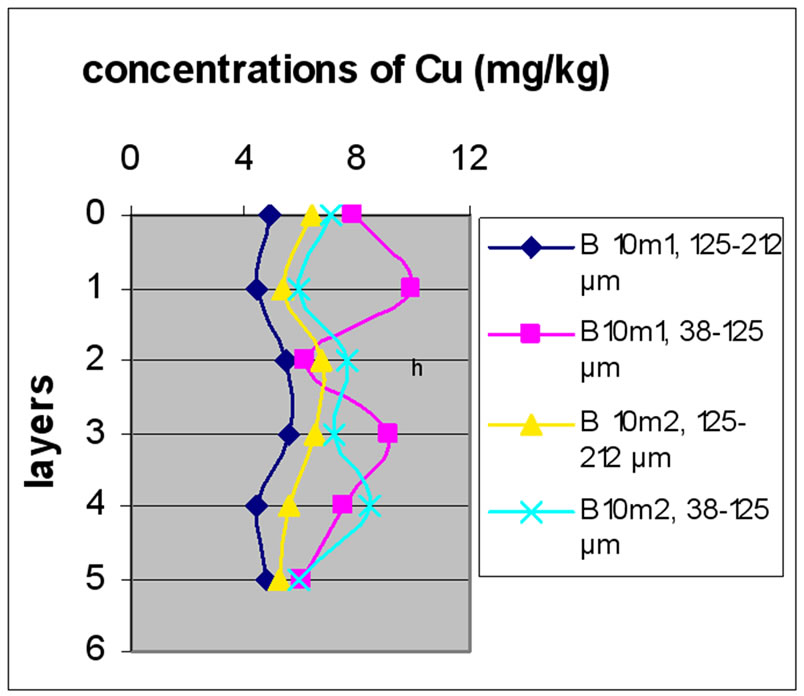 (c)
(c)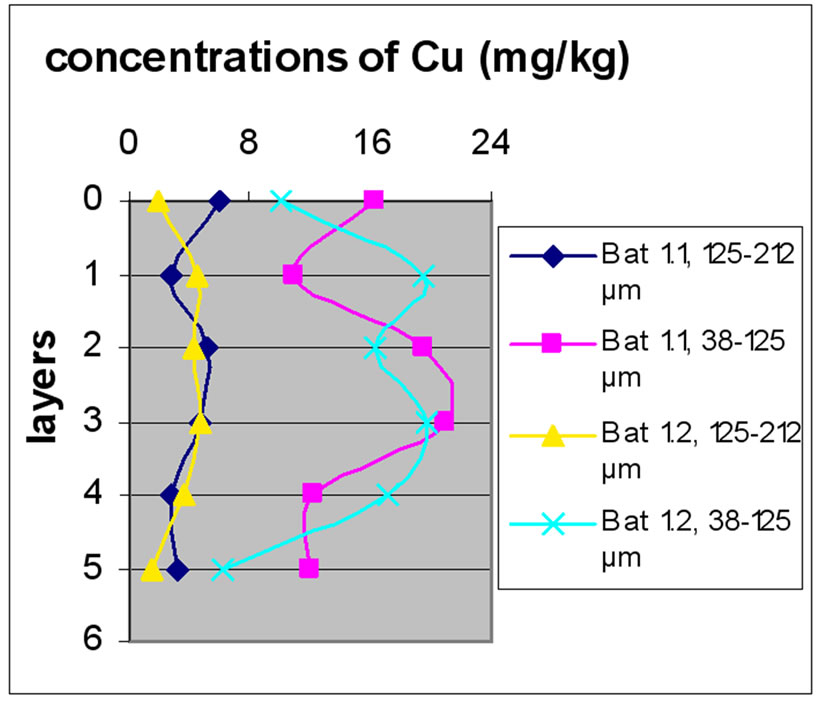 (d)
(d) (e)
(e)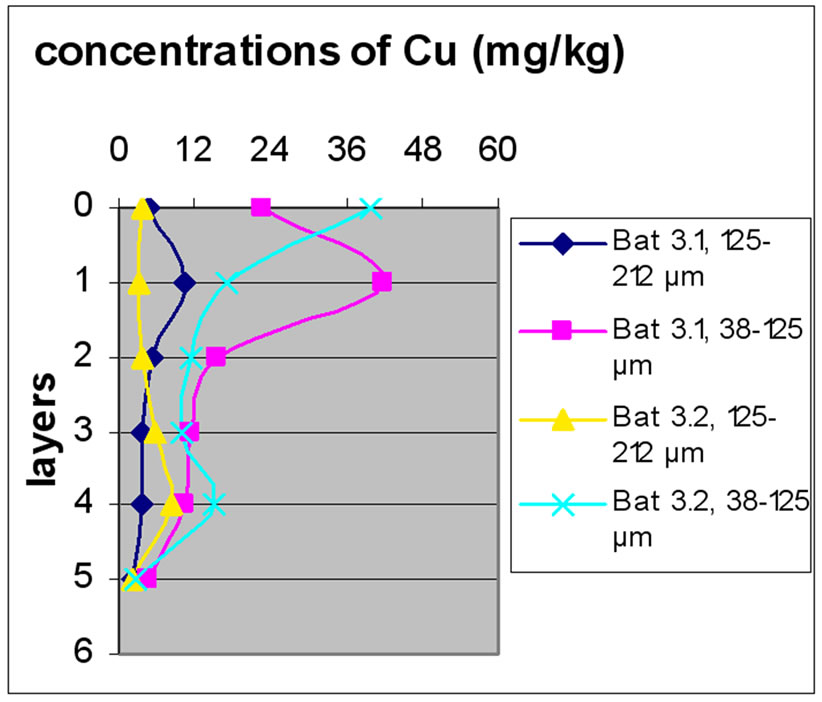 (f)
(f)
Figure 11. Change in the concentration of Fe (mg/kg) according to the layers for both size fractions in the two sites Beirut and Batroun in B 0m (a), B 5m (b), B 10m (c), Bat 1 (d), Bat 2 (e), et Bat 3 (f).
 (a)
(a)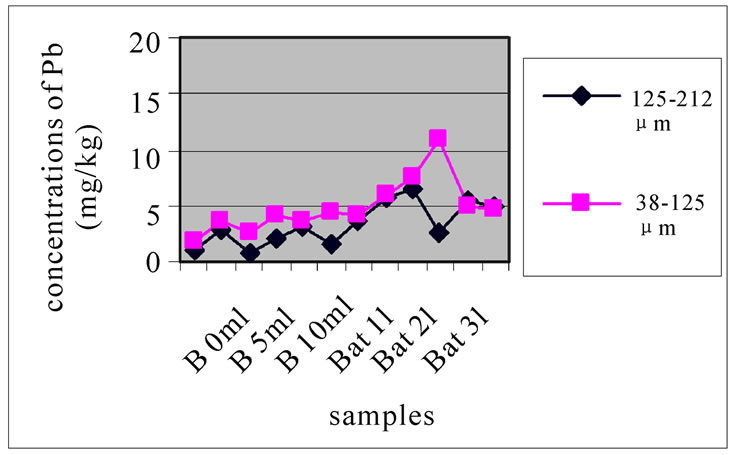 (b)
(b) (c)
(c)
Figure 12. Change in the concentration of Cu for the both size fractions of the first layer (a), the seventh layer (b) and the eleventh layer (c), in the different levies of the two sites.
The difference between the layers in the site of Batroun can be attributed to the lack of disruption during the accumulation of pollutants over time, allowing mixing contaminants.
Almost all charts in Figure 13 show that repetition did not make a significant difference. The analyses also show that samples with finer size fraction show slightly higher concentration of Pb over the other portion size.
3.3.6. Analysis of Principal Component (A C P)
All parameters in this study show that the axis F1 (which represent 45% of the variance) was mainly influenced by Fe and Mn, and the axis F2 (which represents 37% of the variance) was primarily influenced by Cu and Pb (Figure 14). This analysis also shows that Fe and Mn are perfectly correlated with each other positively and negatively with Cu and Pb, allows dividing the two heavy metal Cu and Pb one the one hand and the two other metal Fe and Mn on the other hand to evaluate the sites.
This is widely visible in the table of Person correlation (Table 5). This correlation indicates the presence of a linear relationship between Fe and Mn, and another linear relationship between Cu and Pb, because Fe and Mn were considered as “Siderophile” element, but Cu and Pb were considered as “Chalcophile” element. For a longterm monitoring, the study can focus on a single parameter instead of two.
A C P made on both parameters (Pb and Cu) in Figures 14 and 15 shows that the correlation between Cu and Pb is significant and there was a significant difference between the two selected sites.
4. Conclusions
The comparison of the concentrations of Fe, Mn, Cu and Pb, obtained in this study, according to standards [3,15, 16] indicated that they did not exceed the maximum limit with the exception of a few values of Fe.
However, the values are far greater than those existed before the conflict of 2006, due to the release of fuel oil into the sea. The comparison with the studies done before the conflict is limited since no studies have addressed different layers of sediment. This is because the values given in these studies return to sediment sample with diameters of less than 63 or 80 μm [6,18].
It was noticeable that there is no correlation between Fe and Mn and between the Cu and Pb, thus the parameters are divided in two groups: a-Cu and Pb, bFe and Mn.
For Fe and Mn, sediments of Beirut site (B 10 m station is the most concentrated), are more concentrated than in Batroun site with the exception of Bat 2, which contained a high concentration of Fe and Mn. For Cu and Pb, Batroun site had higher concentration than Beirut site in the surface layers. These results are opposed to those found before the conflict of 2006. The high concentration in Beirut site is probably due to human activities and the conflict of 2006 (oil spill in the sea).
The high concentration in Batroun site was attributed to the impact of wind carried pollutants from different

Table 5. Correlation of pearson between the heavy metals studied
 (a)
(a)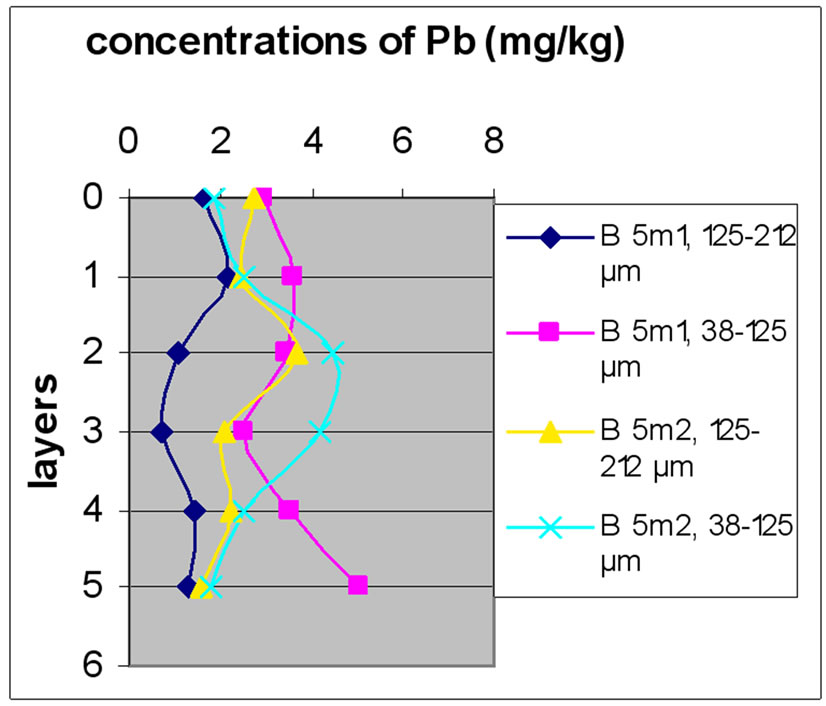 (b)
(b)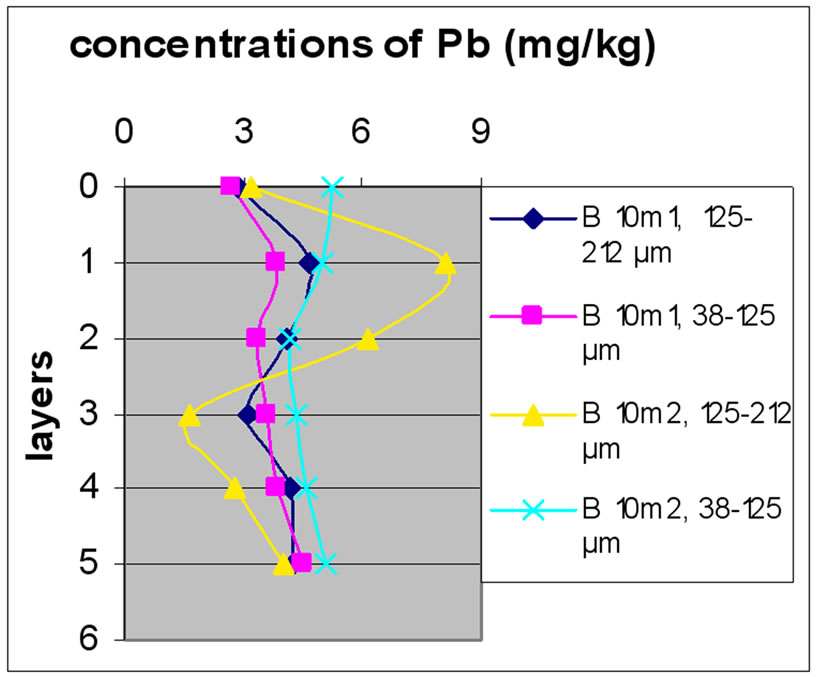 (c)
(c)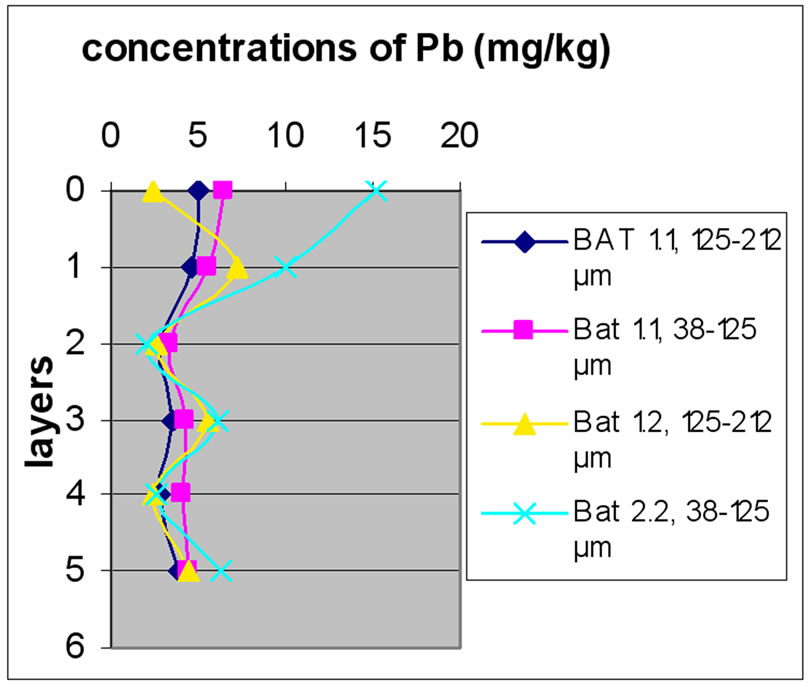 (d)
(d) (e)
(e)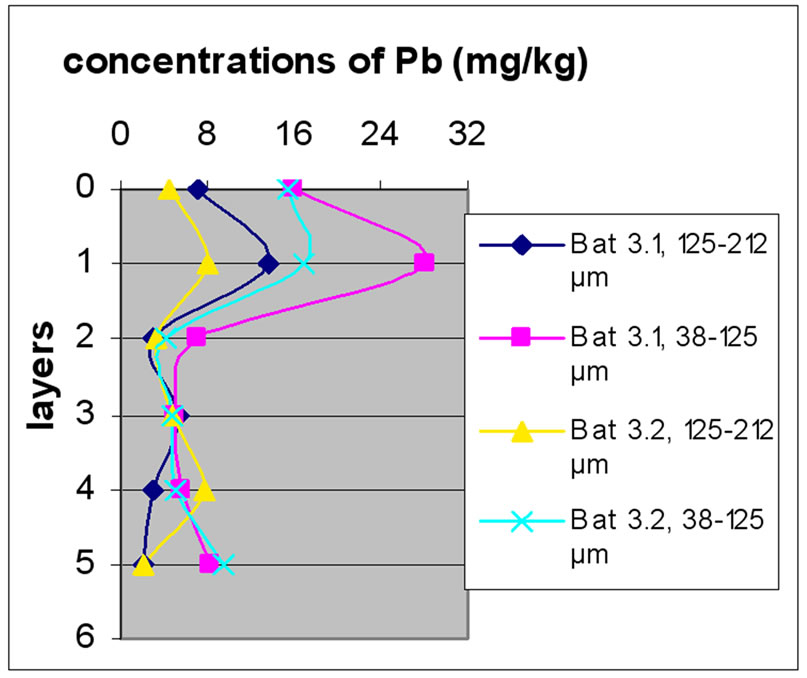 (f)
(f)
Figure 13. Change in the concentration of Fe (mg/kg) according to the layers for both size fractions in the two sites Beirut and Batroun in B 0m (a), B 5m (b), B 10m (c), Bat 1 (d), Bat 2 (e), et Bat 3 (f).
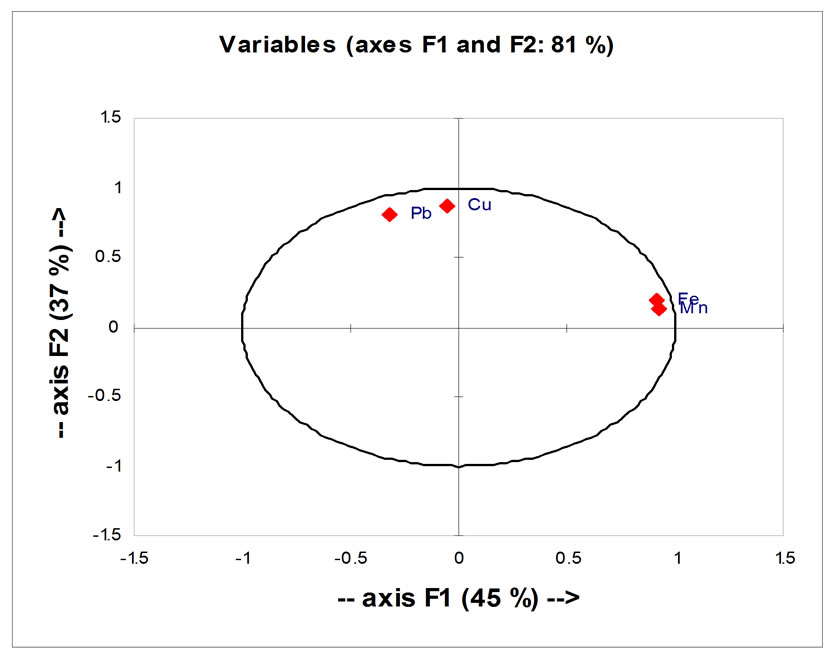
Figure 14. Analysis of principal component (ACP) to all parameters studied (in Beirut and Batroun): correlations between concentrations of different heavy elements traces in all samples studied.
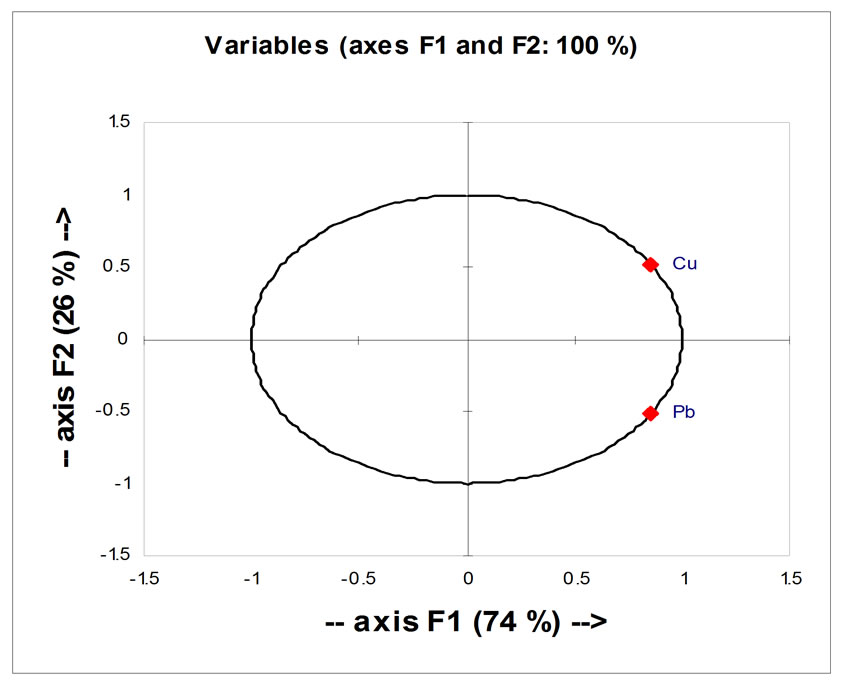
Figure 15. Analysis of principal component (ACP) to all parameters studied (in Beirut and Batroun) : correlations between concentrations of Cu and Pb in all samples studied.
regions, and the correlation between heavy metals and hydrocarbons, was attributed to the industry of chemical products at Selaata factory near Batroun, as well as due to the conflict of 2006.
For the investigated parameters, the effect of size fraction is significant, because the samples with the finer size fraction 38-125 μm had higher concentration than the other fraction 125 – 212 μm. The mineralogical composition was also involved in significant proportions.
Thus, the silty clay minerals were more richer in metals that silica sand. This is the case with stations B 10m, Bat 2 and Bat 3 which contained quantities exceeding of fine fractions, because results showed higher concentrations of metals (especially Fe and Mn) compared to other stations [18–20].
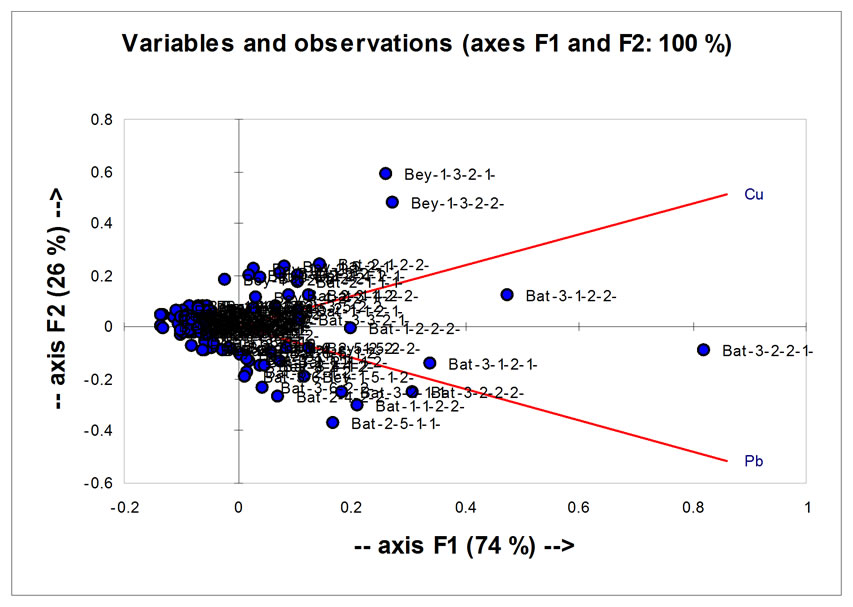
Figure 16. Analysis of principal component (ACP) concerning the concentration of Cu and Pb to all parameters studied (in Beirut and Batroun).
For all studied parameters the effect of depth wassignificant, and it shows that pollution is growing more; especially with depth at a distance from the coast, but also at the coast which was close to industries, traffic and various sources of pollution.
Similarly, the effect of repetition (2 levies distant from one another by 30 cm) was not significant for different studied metals; proving that for the same sample taken on the same depth, there was no difference, which also shows that the variance linked to the analysis, is void.
For the investigated parameters, there was no effect between layers except for Pb. This is in accordance with the results of the variance analysis, while in the future we can study a single layer for daily analysis in the same region.
It sought to continue this research on much more sites and on time series in order to confirm the effect of layers in other regions along the Lebanese coast.
REFERENCES
- R. Steiner, “Lebanon oil spill rapid assessment and response mission,” pp. 1–30, 2006.
- E. Iaurif, “Regional environmental assessment, report on the coastal zone of Lebanon,” Government of Lebanon, Council for Development and Reconstruction, pp. 46–56, 1997.
- R. Kantin and G. et Pergent, “Gestion des écosystemes littoraux méditérranées,” IFREMER et Université de CORSE, pp. 15–45, 2007.
- S. Casas, “Modélisation de la bioaccumulation de métaux traces (Hg, Cd, Pb, Cu et Zn) chez la moule Myitlis Galloprovinciallis, en milieu méditerranéen,” Sud Toulon VAR. France, pp. 10–19, 2005.
- K. Nakhle and Le Mercure, “le Cadmium et le Plomb dans les eaux littorales libanaises: apports et suivi au moyen de bioindicateurs quantitatifs (éponges, bivalves, et gastropodes),” Paris 7. France, pp. 7–14, 32–41, 99–101, 2003.
- N. Nassif, “Pollutions chimiques en milieu marin : Essai de modélisation et approche réglementaire,” Edition: GG/F. Janvier, Institut National Agronomique. Paris-
- Grignon. Paris-France. ISBN: 2–35040–000–X, pp. 9–42, 81, 203–210, annexes 13, 14, 2006.
- J. C. Amiard, “Les problèmes liés à l' échantillonnnage et à la détection des élements traces en écotoxicologie,” Vol. 1, pp. 172–195, 1994.
- M. Castrec-Rouelle, N. Nassif, and A. M. et DeKersabiec, “Prélèvements préparation et traitement d'échantillons environnementaux: Approches statistiques,” Dossier Environnement, Vol. 32, pp. 23–28, 2003.
- C. Biney, A. T. Amuzu, D. Calamari, N. Kaba, I. L. Mbome, H. Naeve, O. Ochumba, O. Osibanjo, V. Radegonde, and M. A. H. et Saad, “Etude des métaux lourds,” Revue de la pollution dans l'environnement aquatique africain, FAO, Vol. 25, pp. 1–6, 1994.
- B. Boutier, D. Claisse, D. Auger, E. Rozuel, J. Breteau-
- deau, and I. Truquet, “Surveillance du milieu marin. Les métaux dans les sédiments du Golfe de Gascogne,” RNO (IFREMER), pp. 17–34, 2005.
- E. Bastarache, “Toxicologie, céramique, verrerie et métallurgie,” Smart. Conseil, 2006.
- PNUE, “Meilleurs méthodes de gestion pour les sources agricoles non ponctuelles de pollution,” Rapport techni-
- que du PEC, Programme pour l'environnement des caraibes, pp. 150, 1998.
- R. Mebazaa, “Détermination de la taille de l'échantillon des sédiments marins par étude de la variance,” L'Institut National Agronomique Paris-Grignon - Centre National des Sciences Marines de Jounieh. Agence Universitaire de la Francophonie (AUF). Mémoire de Diplôme d'études approfondies, Contrôle et gestion de la qualité, pp. 12–22, 2004.
- PNUE, “Etat du milieu marin et littoral de la région méditérranéene,” MAP Technical Reports-Series, pp. 3–11, 29–48, 1996.
- UNEP, “Etat de l'environnement et politiques suivies de 1972 A 2002, la mer et les côtes. GEO 3,” Le passé, le présent et les perspectives d'avenir, pp. 180–209, 2002.
- B. Boutier and D. et Claisse, “Surveillance du milieu marin. Les contaminants chimiques dans les sédiments du littoral méditérranéen,” RNO (IFREMER), pp. 9–52, 1998.
- B. Boutier and D. et Claisse, Surveillance du milieu marin. Les carottes sédimentaires, mémoire de la contamination,” RNO (IFREMER) , pp. 21–40, 2001.
- J. F. Chiffoleau, D. Auger, B. Boutier, E. Rozuel, and I. et Truquet, “Dosage de certains métaux dans les sédiments et les matières en suspension par absorption atomique,” IFREMER, pp. 6–16. 2003.
- Y. Gueguen, “Réalisation d'un système expert pour le bilan de la contamination métallique du réseau hydrographique de la Seine,” Université Pierre et Marie Curie, Université Paris-Sud, et Ecole Nationale du Génie Rural des Eaux et des Forêts. France, pp. 5–6, 2003.
- B. Boutier, D. et Claisse, “Surveillance du milieu marin. Les métaux lourds dans les sédiments de la Baie de Seine (campagne 1993),” RNO (IFREMER), pp. 25–32, 1995.