World Journal of Mechanics
Vol.06 No.04(2016), Article ID:66147,11 pages
10.4236/wjm.2016.64014
Fluid Vibration Induced in T-Junction with Double Side Branches
Ryuhei Yamaguchi1*, Gaku Tanaka1, Hao Liu1, Toshiyuki Hayase2
1Graduate School of Engineering, Chiba University, Chiba, Japan
2Institute of Fluid Science, Tohoku University, Sendai, Japan

Copyright © 2016 by authors and Scientific Research Publishing Inc.
This work is licensed under the Creative Commons Attribution International License (CC BY).
http://creativecommons.org/licenses/by/4.0/


Received 29 January 2016; accepted 26 April 2016; published 29 April 2016
ABSTRACT
A T-junction is a fundamental fluid element prevalent in pipe networks of water supplies and power plants. In the present study, a double T-junction was investigated for flow instability and fluid vibration. Both axi-aligned and skewed double T-junctions are examined from viewpoint of flow instability. With single-phase flow in an open-ended double T-junction, fluid vibration is induced in both side branches because of a high shear rate with a point of inflection. The frequency of vibration in the downstream branch is higher than that in the upstream branch. Except for the upstream branch in the skewed double T-junction, the frequency is higher than that in a single T-junction. The fluid vibrations are closely associated with the fluid interference created by the presence of the two side branches.
Keywords:
Fluid Vibration, Flow Instability, Shear Rate, Double T-Junction, Particle Image Velocimetry, Laser Doppler Anemometry

1. Introduction
An incident involving the rupture of a tube in a steam generator incident occurred unexpectedly in 1991 at the Mihama Nuclear Electric Power Plant, Unit 2, in Japan. A small 22-mm-diameter tube with wall thickness of 1.3 mm was fractured by a vibration arising from fluid elastic interaction related to Karman vortex generation. Radioactive primary coolant from the reactor flowed out into ocean [1] . There are several possible arguments why this unpredictable occurrence may occur in other fluid power plants and pipeline networks. However, the prediction of vibration through fluid interference is difficult. Flows with high shear rate will definitely induce flow instabilities and fluid vibrations.
With respect to external flows, Brown & Roshko [2] and Tani [3] demonstrated that high shear rates will induce flow instability and this phenomenon is universal. This phenomenon is associated with the fluid oscillation and fluid vibration in fluid dynamics. With respect to flows past cavities [4] [5] and flows through axisymmetric stenosed channels [6] , the self-sustaining oscillation and instability have been studied experimentally and numerically. For incompressible turbulent flow over a rectangular cavity, Mori & Naganuma [7] have experimentally investigated the appearance of organized oscillations. Recently, from the viewpoint of hemodynamics, many researchers have investigated flow behavior around a cerebral aneurysm to see whether flow instability might promote its progress and rupture [8] - [13] . Also, flow instability appears in the nasal channel [14] [15] , but may not necessarily produce periodic oscillations. This flow instability appears temporarily associated with weak oscillations.
An arterial branch from the abdominal aorta to the renal artery is basically similar to a single T-junction. Over the past three decades, Karino et al. [16] and Liepsch et al. [17] experimentally investigated the laminar flow structure within the single T-junction for its relevance in hemodynamics. Karino et al. [16] visualized the flow pattern around the sharp square-edged corner, and showed that helical flow in the side branch results in recirculation. However, none of these studies had indicated the presence of flow instability or flow oscillation in the side branch. In the previous study of a single T-junction [18] , we have clarified that the fluid vibration was induced by two flow mechanisms; the flow instability with a high shear rate at the vortex boundary immediately downstream of the inlet in the side branch and along the shearing separation layer in the side branch. Qualitatively, we concluded that the mechanism of fluid-induced vibration is strongly related to a local flow structure.
For a double T-junction, there are several studies concerning flow induced pressure pulsations in a gas transport system [19] , aeroacoustic pulsations in pipe networks [20] , and acoustic- and flow-induced vibration in boiling water reactors of nuclear power plant in steam flow [21] . In these T-junctions, the spacing between two side branches was long and the ends of the side branches were closed.
The present experimental study deals with an open-ended double T-junction. We aimed to clarify the mechanism underlying the fluid-induced vibration in these double T-junctions for single-phase flow. Flow visualization was carried out by two dimensional particle image velocimetry (2D-PIV) and the velocity measurement obtained by two dimensional laser Doppler anemometry (2D-LDA).
The shearing separation layer is produced at the median plane in the side branches between the low-velocity flow along the near wall and the main flow associated with the high-velocity along the distant wall. The flow vibration was investigated along the shearing separation layer where the shear rate is larger than that at tube wall sufficiently downstream of the side branch; the velocity profile has an obvious point of inflection. Furthermore, the point of inflection in high-shear-rate flow between two vortices immediately downstream of the inlet in the side branch was also examined. Consequently, in two side branches, the frequency in the downstream side branch is higher than that in the upstream side branch. Except for the upstream side branch of the skewed T-junction, the Strouhal numbers for these branches are higher than that of a single T-junction.
2. Methods
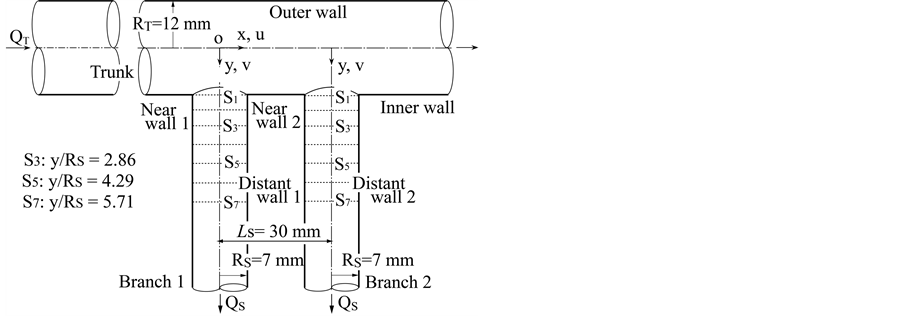
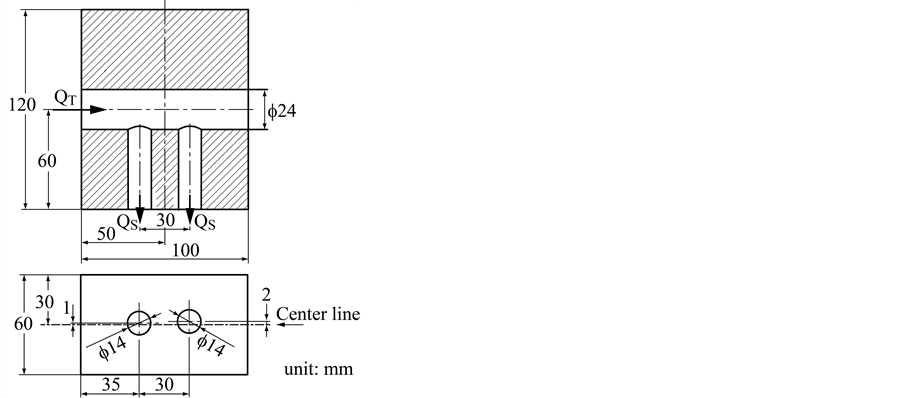
For the axi-aligned and skewed T-junctions in Figure 1(a) and Figure 1(b), respectively, each side branch bifurcates from the trunk at a right angle. The T-junction models were made from silicone resin. For the present study, we selected RT = 12.2 mm and RS = 7 mm as a representative of the radii of the trunk and side branches [18] , respectively. The flow rates through the trunk and side branch are denoted as QT and QS, respectively. The same flow ratio of QS/QT = 0.25 is maintained for both side branches. A spacing of Ls = 30 mm between the two side branches is set for the experiment. This is the minimum distance for which the fluid interference is extremely expected between the side branches because the outer diameter of the side branch is 20 mm. Both the upstream and downstream corners of both side branches are square-edged. For the axi-aligned double T-junction in Figure 1(a), the plane is determined by the axes of both side branches through the axis of the trunk; this is called the median plane. For the skewed double T-Junction, the centers of the two branches have a radial offset of 1 and 2 mm in Figure 1(b), and hence this plane is tilted away from the trunk axis. The offset was chosen as one arbitrary case.
The velocity components and the flow visualization of cross-sections for the velocity field are also given in Figure 1(a). In the side branch, v and u represent the axial and transverse velocity components, respectively.
 (a) (b)
Figure 1. (a) Schematic and labeling of axi-alinged side branches cross-section in a double T-junction; (b) Schematic of side and top views of skewed branches in a double T-junction.
Cross-sections in the side branch where flow visualizations of velocity vector fields were performed are marked as sections S3, S5 and S7. The line of shearing separation layer in the side branch is decided by operators based on PIV results. Details of the measurement procedure for LDA are described in the previous study [18] . In PIV measurement, the interrogation window size is 16 pixels × 16 pixels, with 50% overlapping. In LDA measurement, the velocity is measured in data sampling rate of 1 μs, during total 40-second every 2 ms, i.e. a 20-k data set.
The working fluid is 53% aqueous glycerin with a refractive index of 1.41 (identical to that of silicone resin), a density of ρ = 1.13 g/cm3, and a kinematic viscosity of ν = 7.00 × 10⁻⁶ m2/s at 293 K (20˚C). The working fluid flows into the T-junction model through the 2000-mm-long inlet from the constant head tank. The working fluid then flows through an ultrasonic flow meter (TS410, Transonic System Co. Ltd., Ithaca, NY).
3. Results
The measurements were primarily carried out with ReT = 2RTUT/ν = 800 at a laminar steady flow in the trunk for both axi-aligned and skewed T-junctions. UT denotes the mean velocity in the upstream trunk [18] .
3.1. Concentric Double Side Branches
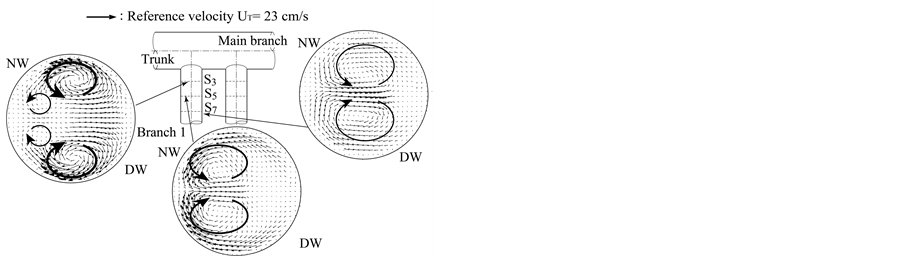
For the axi-aligned T-junction, the velocity vector field over the median plane that included all tube axes is shown in Figure 2. As enclosed by bold circle, the core fluid from the upstream trunk has high-velocity as it enters into the downstream side branch (Branch 2). In contrast, the fluid enclosed by fine circle has low-velocity as it enters the upstream side branch (Branch 1). Although the flow rate through both branches is the same, the core fluid of Poiseuille flow enters into at section S3 in Branch 2 maintaining large momentum. This flow behavior might be related to the high-shear-rate and the high frequency vibration associated with Branch 2, as described below.
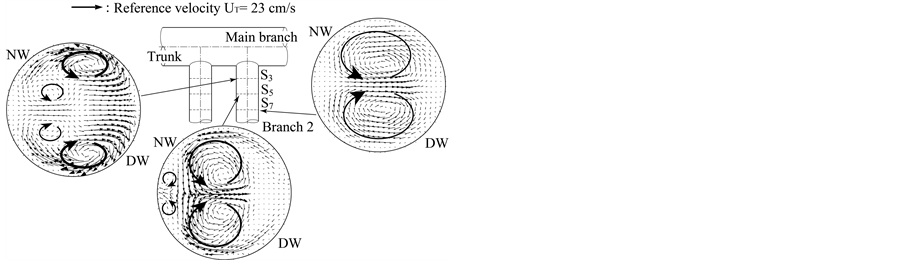
Secondary vortices are seen in Figure 3(a) and Figure 3(b). Two pairs of vortices have formed in a symmetrical arrangement at section S3 in Branches 1 and 2.
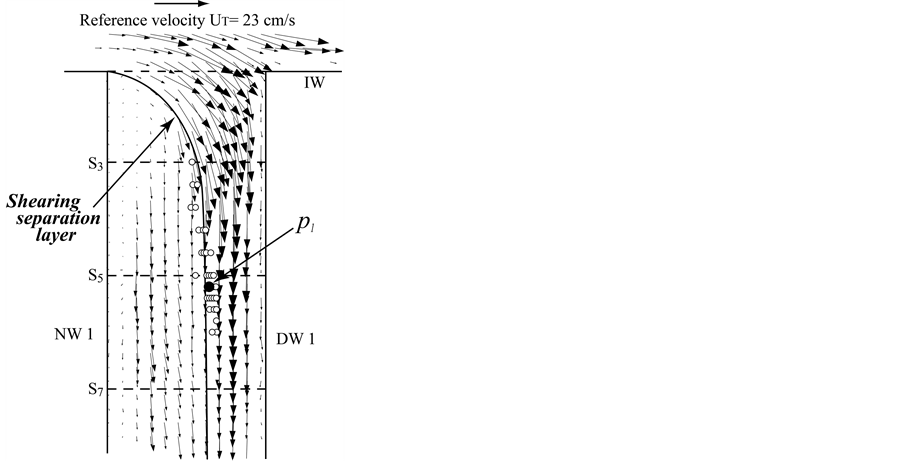
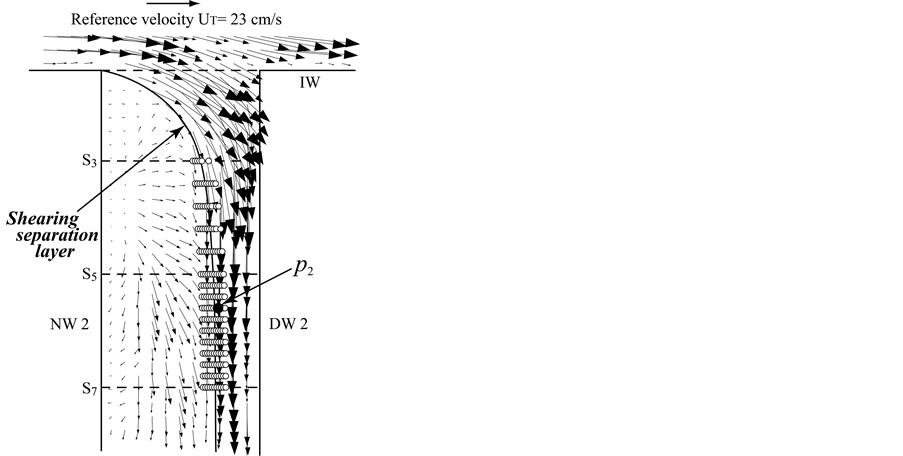
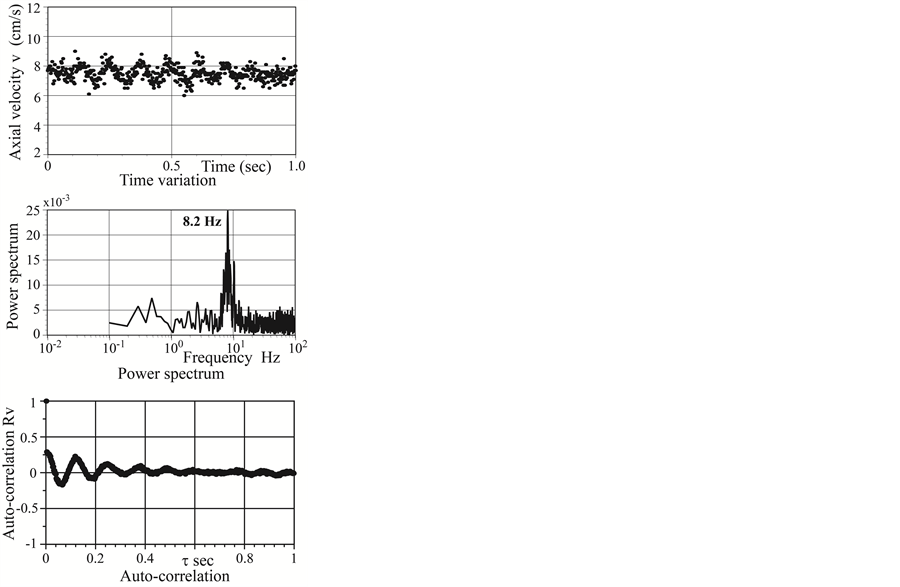
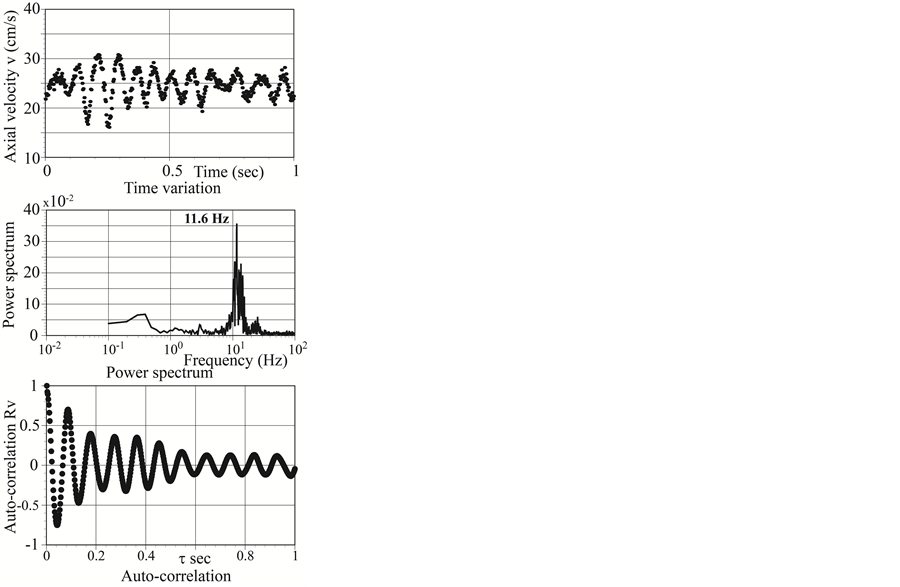
The position of vibration marked by dot in Figure 4(a) and Figure 4(b) spreads along the shearing separation layer. The periodic vibration extensively appears in Branch 2. From spectral analysis of the axial velocity at typical points p1 and p2 in both side branches in Figure 5(a) and Figure 5(b), respectively, the frequency of f = 11.6 Hz at p2 in Branch 2 is 40% higher than that of f = 8.2 Hz at p1in Branch 1. This difference is strongly associated with the movement of core fluid upstream in the trunk flowing into Branch 2. Furthermore, the auto-correlation in Branch 2 is much clearer than that in Branch 1.
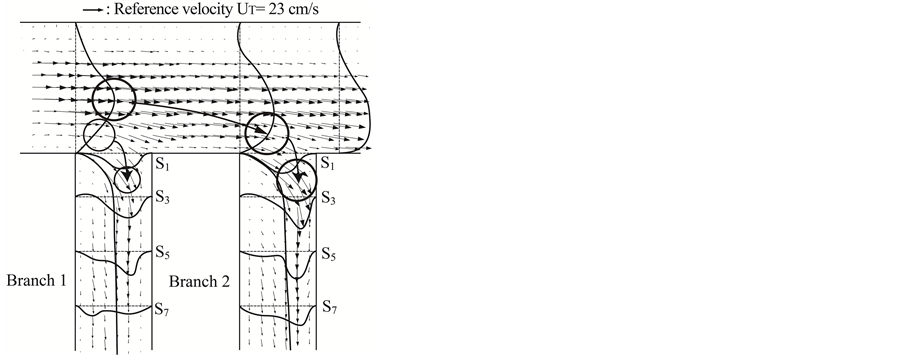
Figure 2. Velocity vector field at median plane including movement of core fluid into axi-aligned side branches of a double axi-aligned T-junction.
 (a) (b)
Figure 3. Secondary velocity at specified cross-sections in the side branches (IW: inner, NW: near, DW: distinct walls). (a) Branch 1; (b) Branch 2.
 (a) (b)
Figure 4. Velocity vector at median plane of the side branches. (a) Branch 1; (b) Branch 2.
 (a) (b)
Figure 5. Spectral analysis of axial velocity component at point with vibration. (a) At p1 near section S5 in Branch 1; (b) At p2 near section S5 in Branch 2.
In the secondary velocity profiles at the vortex boundary formed in cross-section S3 of both side branches in Figure 6(a) and Figure 6(b), each have a point of inflection denoted by P. This means that the flow instability is induced along the vortex boundary. Given the reference shear rate of 96.6 s−1, which is the value obtained along the tube wall sufficiently downstream of the side branch, the shear rate of 140.6 s−1 in Branch 2 is 1.5 times larger. In contrast, the shear rate of 58.0 s−1 in Branch 1 is one half of the reference shear rate. The shear rate in Branch 2 is clearly higher than that in Branch 1.
The tangential velocity profile for Branches 1 and 2 in Figure 7(a) and Figure 7(b) also shows points of inflection along the shearing separation layer. The shear rates in Branches 1 and 2 are 79.5 s−1 and 143.9 s−1, respectively, with Branch 2 being 1.5 times larger than the reference shear rate. This indicates that a high-shear- rate flow with a point of inflection vibrates at higher frequency.
For both double T-junctions, the relationship between Reynolds and Strouhal numbers is plotted in Figure 8 for both branches and compared with result for a single T-junction [18] . The Reynolds and Strouhal numbers are defined as ReS = 2RSUS/ν and StS = 2fRS/US, respectively, where US is the mean velocity in the side branch. Finally, the Strouhal numbers of 0.66 and 0.93 at the Reynolds number of 370 in Branches 1 and 2 are approximately 10% and 55%, respectively, both larger than that of 0.60 at corresponding Reynolds in a single T-junc- tion in the previous study [18] .
3.2. Skewed Double T-Junctions
In skewed side branches, the velocity vector field across the median planes for side branches and trunk are shown in Figure 9. High-velocity core fluid in the trunk flows into Branch 2, whereas low-velocity fluid passing through inner wall flows into Branch 1. The velocity vectors marked in red arrow either side of shearing separation layer in Branch 2 vibrate to be described below. In Branch 1, there is little flow instability around the shearing separation layer, as described below.
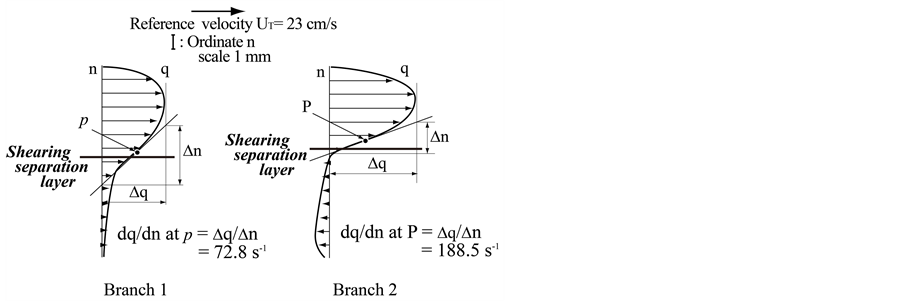
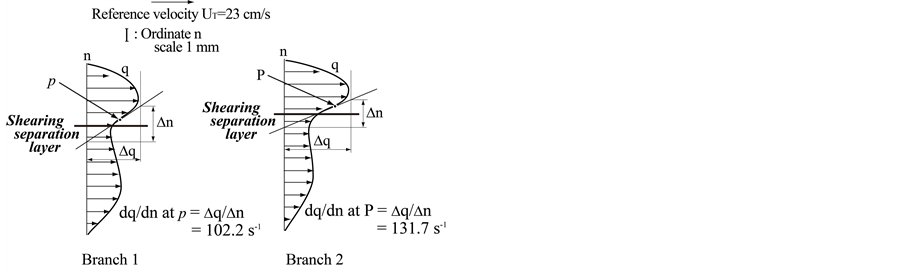
The tangential velocity profile along the shearing separation layer in Figures 10(a)-(c) for cross-sections S3, S5 and S7 in Branch 2 has distinctly the point of inflection P, and the shear rates are 188.5 s−1, 195.0 s−1 and
 (a) (b)
Figure 6. Secondary velocity profile including point of inflection P and shear rate between two vortices near section S3 inaxi-aligned side branches: velocity gradient dv/dx at tube wall (x = RS) of side branch = 96.6 s−1. (a) Branch 1; (b) Branch 2.
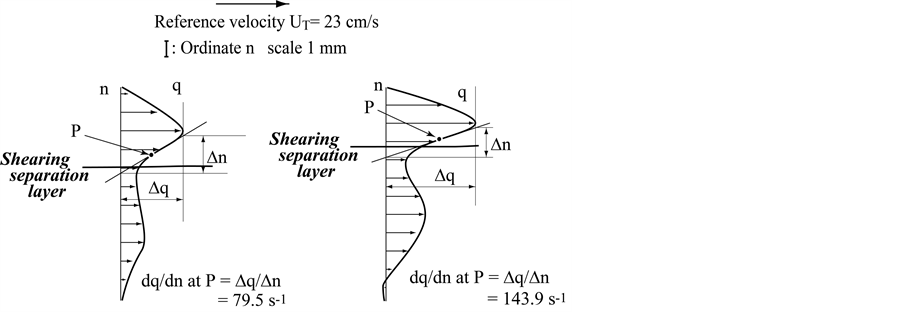 (a) (b)
Figure 7. Tangential velocity profile and shear rate across the shearing separation layer near section S7 in axi- aligned side branches: velocity gradient dv/dx at tube wall (x = RS) of side branch = 96.6 s−1. (a) Branch 1; (b) Branch 2.
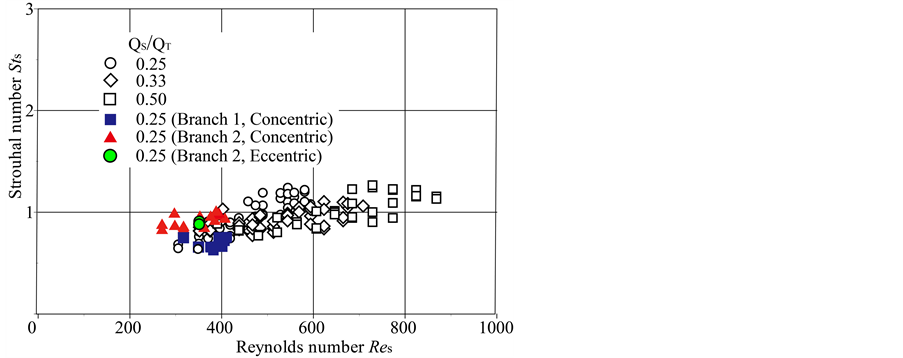
Figure 8. Side-branch Strouhal number StS, versus side-branch Reynolds number ReS for both side-branches. (ReS = 2RSUS/ν and StS = 2fRSUS. Open symbol is T-junction with single side branch.  and
and  denote Branch 1 and Branch 2 in concentric T-junction, respectively, and
  indicates Branch 2 in eccentric T-junction).
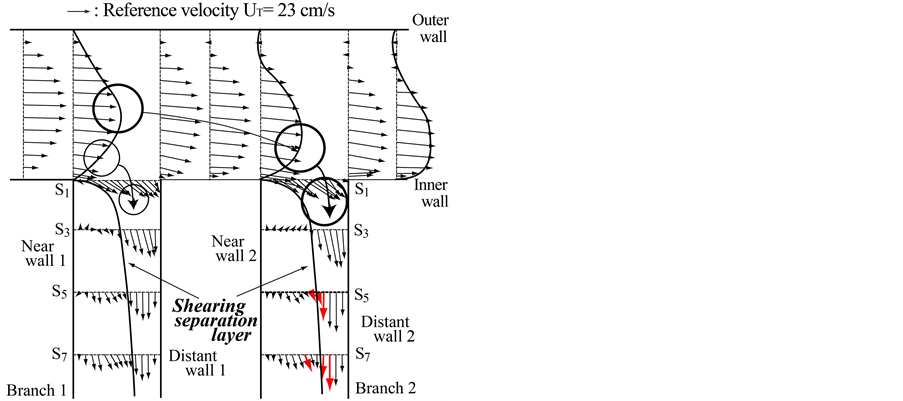
Figure 9. Velocity vector field at median plane in skewed double T-junction.
 (a)
(a)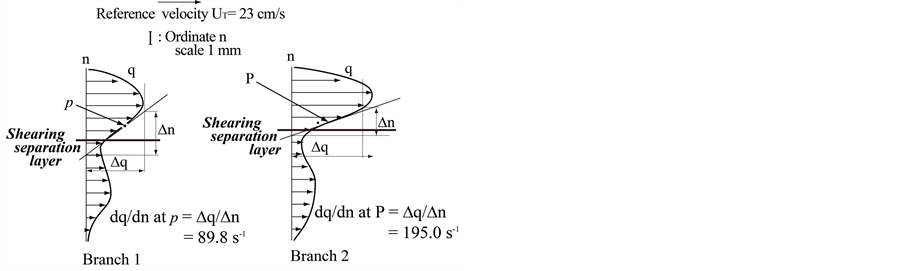
 (b) (c)
Figure 10. Tangential velocity profile including point of inflection P and shear rate across the shearing separation layer in specified cross-sections through skewed side branches: velocity gradient dv/dx at wall (x = Rs) of side-branch= 97.9 s−1.
131.7 s−1, respectively. These shear rates are higher than the reference shear rate of 97.9 s−1. For Branch 1, the shear rate at each section is approximately comparable or slightly smaller than the reference shear rate, and the points of inflection are not clearly defined, as described below.
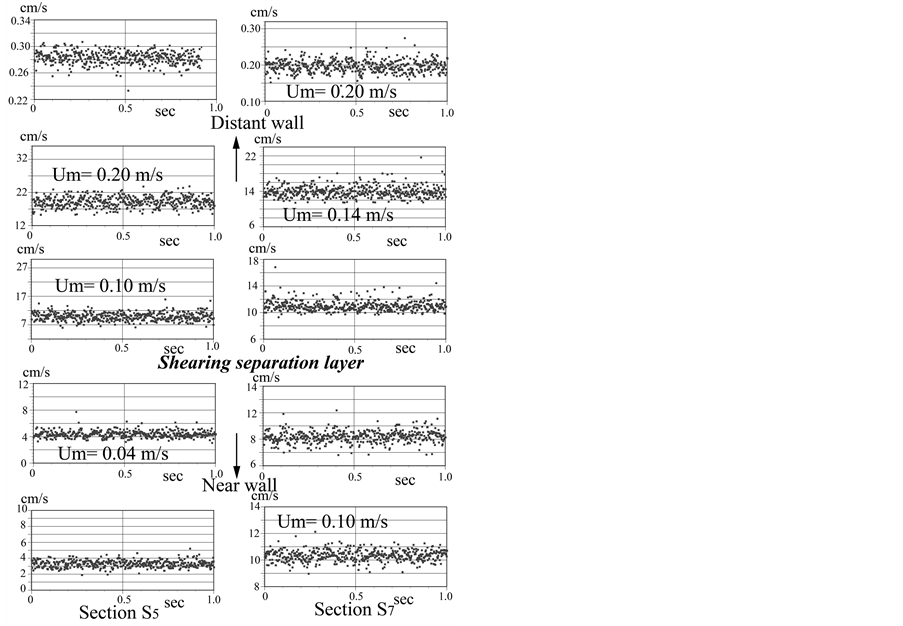
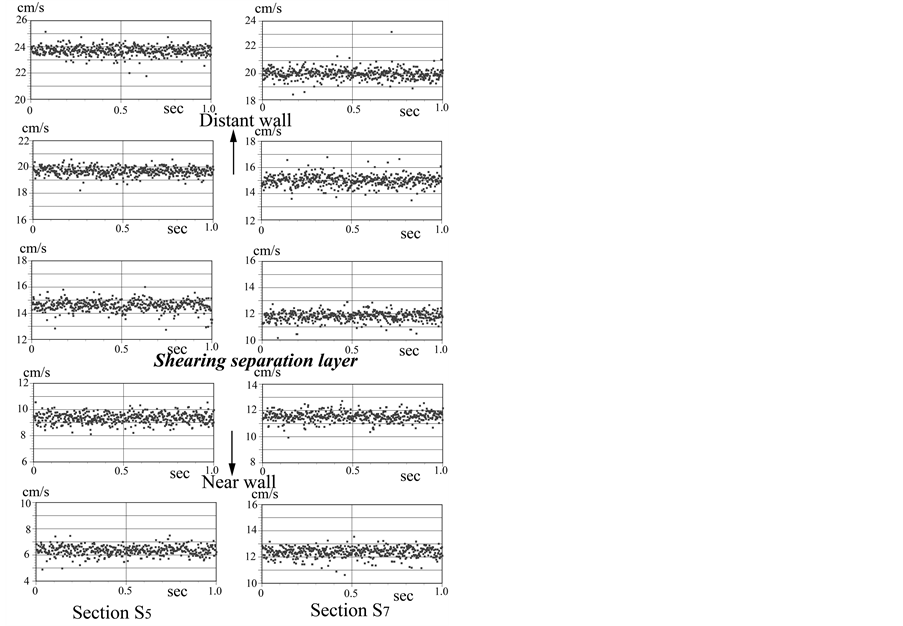
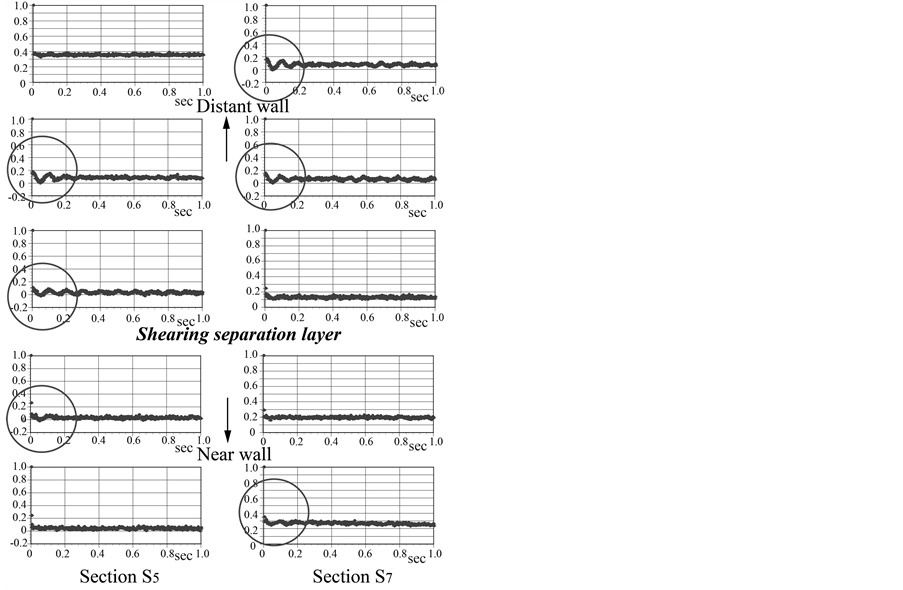
The temporal variation of the axial velocity component in both side branches was obtained in Figure 11(a) and Figure 11(b). The data corresponds to a one-second interval from a total 40 second of data measured at median plane at sections S5 and S7. Um in Branch 2 in Figure 11(b) denotes the mean velocity at the point where
 (a) (b)
Figure 11. Time variation of axial velocity. (a) Branch 1; (b) Branch 2.
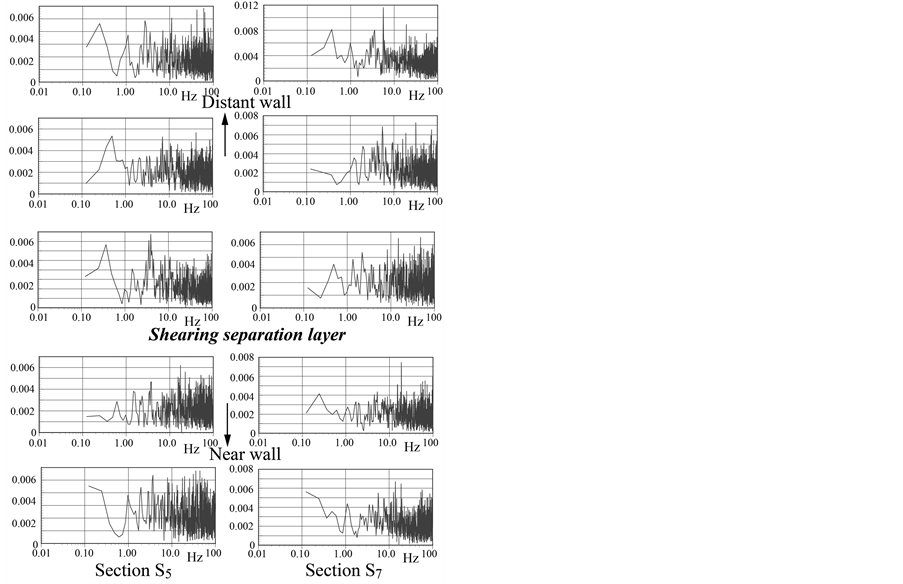
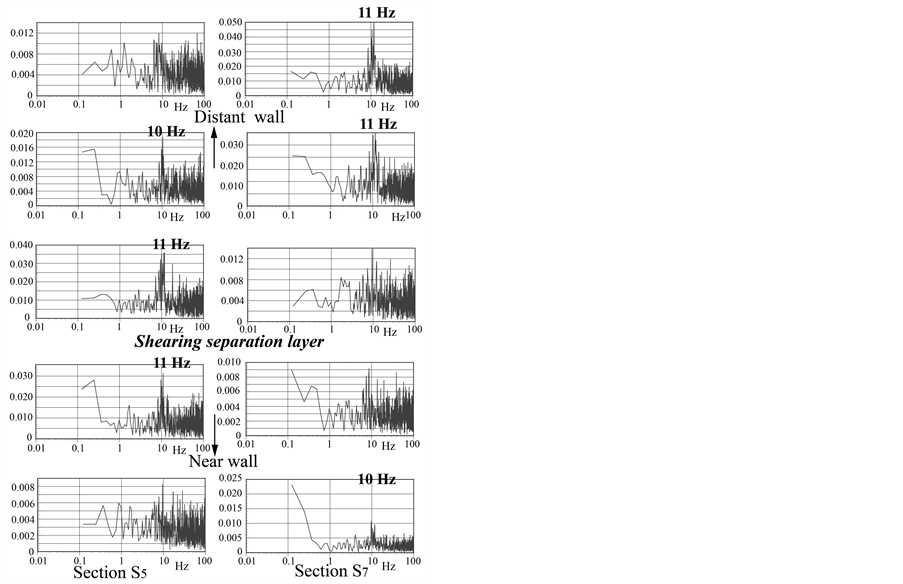
the fluid vibration appears. The power spectra corresponding to these temporal variations are plotted in Figure 12. The frequency is not as distinct compared with that for axi-aligned branches. However, the frequencies from 10 to 11 Hz in Figure 12(b) are prominent at several points near the shearing separation layer. Therefore, it is suggestive of a high-shear-rate flow with points of inflection vibrating with the periodic frequency.
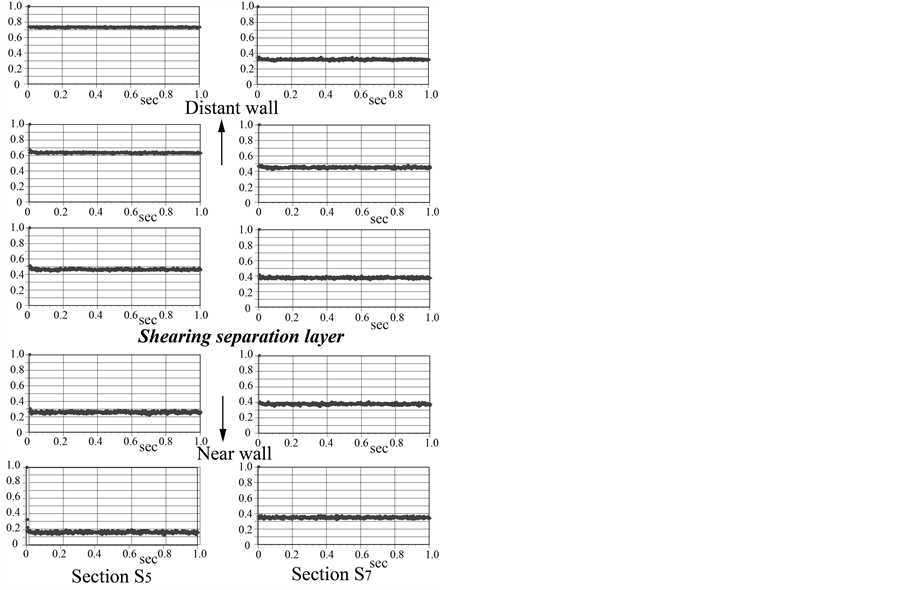
Whether the fluctuation is noise or vibration, it is identifiable by an auto-correlation analysis, which we have reformed on the above results in Figure 13. As denoted by encircled segment, the auto-correlation for Branch 2 indicates the presence of fluid vibration. The frequency is comparable with that in Branch 2 of the axi-aligned T-junction branches. In contrast, there is no obvious oscillation in Branch 1.
The tangential velocity profile along the shearing separation layer in Figures 10(a)-(c) for cross-sections S3, S5 and S7 in Branch 2 has distinctly the point of inflection P, and the shear rates are 188.5 s−1, 195.0 s−1 and 131.7 s−1, respectively. These shear rates are higher than the reference shear rate of 97.9 s−1. For Branch 1, the shear rate at each section is approximately comparable or slightly smaller than the reference shear rate, and the points of inflection are not clearly defined, as described above.
The temporal variation of the axial velocity component in both side branches was obtained in Figure 11(a) and Figure 11(b). The data corresponds to a one-second interval from a total 40 second of data measured at median plane at sections S5 and S7. Um in Branch 2 in Figure 11(b) denotes the mean velocity at the point where the fluid vibration appears. The power spectra corresponding to these temporal variations are plotted in Figure 12. The frequency is not as distinct compared with that for axi-aligned branches. However, the frequencies from 10 to 11 Hz in Figure 12(b) are prominent at several points near the shearing separation layer. Therefore, it is suggestive of a high-shear-rate flow with points of inflection vibrating with the periodic frequency.
4. Discussion
First, we have expected that the frequency in Branch 1 of the double T-junction would be higher than that in Branch 2, because the flow rate through the trunk in Branch 1 is higher than that in Branch 2. Contrary to
 (a) (b)
Figure 12. Power spectrum of axial velocity. (a) Branch 1; (b) Branch 2.
 (a) (b)
Figure 13. Auto-correlation of axial velocity. (a) Branch 1; (b) Branch 2.
expectation, the frequency of 11.6 Hz in Branch 2 is higher than that of 8.2 Hz in Branch 1 for the axi-aligned double T-junction. Even the frequency in Branch 2 for a skewed double T-junction is a little higher than that of 7.5 Hz corresponding to in the single T-junction [18] . Prior to performing the experiment, this behavior was not foreseen. Second, the point with vibration in the skewed double T-junction with axis offsets of 1 mm and 2 mm would be fewer than that in the axi-aligned double T-junction. There is no obvious vibration in Branch 1 for a skewed double T-junction. This difference of point with the fluid vibration might be related to the twist of well-regulated shear flow owing to the skewness of fluid flowing into the side branch.
In the axi-aligned double T-junction, the shear rate of 140.6 s−1 at the vortex boundary in section S3of Branch 2 as shown in Figure 6(b) is 1.5 times as large as the reference shear rate. In contrast, the shear rate of 58.0 s−1 in Branch 1 is one half of the reference shear rate. Obviously, the shear rate in Branch 2 is much higher than that in Branch 1. The shear rate of 143.9 s−1 along the shearing separation layer in Branch 2 in Figure 7(b) is 1.5 times as large as the reference shear rate. The Strouhal numbers of 0.66 in Branch 1 and 0.93 in Branch 2 are approximately 10% and 55%, respectively, both larger than that of 0.60 in a single side branch. In the skewed double T-junction, these shear rates in Branch 2 in Figure 7(b) are higher than the reference shear rate of 97.9 s−1. In Figure 12(b), the frequency from 10 to 11 Hz is indicated in several points near the shearing separation layer, which is comparable with that in Branch 2 of the axi-aligned double T-junction. The Strouhal number of 0.88 corresponds to f = 11 Hz. Therefore, it indicates that a high-shear-rate flow with a point of inflection vibrates at higher frequency.
This behavior suggests that there is a great possibility that a high frequency vibration can be induced in pipeline network and fluid power plant. This vibration is a consequence of interference in fluid mechanism between two side branches. The spacing of the branches was Ls = 30 mm. When this spacing is reduced to an ideal minimum length, e.g. Ls = 14 mm, the frequency in Branch 2 might be quite higher because of fluid interference.
Generally, fluid dynamics involves non-linear phenomena for which predictions remain hard to extract from the past results, and unexpected flow behavior is the norm. Furthermore, the flow rate in fluid power plants and pipeline networks is quite large. In the present study, the order of Reynolds number is less than 103. However, in a fluid power plant, the Reynolds number is much larger, e.g. 105 or 106. We cannot confirm the phenomenon at higher Reynolds number with the current double T-junctions. In the current LDA system used, the data sampling rate is 1 μs and the data rate is comparable to 3 kHz. If the Reynolds number is 106, much higher data sampling rate and higher data rates will be required: at least 10 ns and 300 kHz, respectively.
5. Conclusion
In the present study, the aim was to experimentally clarify the mechanism underlying the fluid-induced vibration in double T-junction using flow visualization and velocity measurement. Single phase flows with local high- shear-rates were established in both an axi-aligned and a skewed double T-junctions. The Strouhal numbers of 0.66 in Branch 1 and 0.93 in Branch 2 for axi-aligned branches were 10% and 55%, respectively, both larger than that the Strouhal numbers of 0.60 at corresponding condition in a single side branch. For skewed branches, Branch 2 had a Strouhal numbers of 0.88, which is only 45% larger than that in a single side branch but still comparable with that of Branch 2 for axi-aligned side branches. These results are closely associated with the inflection point for high-shear-rate arising as consequence of the fluid interference between the two side branches.
Acknowledgements
Part of this study was supported by a Grant-in-Aid for Scientific Research (B) (15H03914). With respect to the present study, the authors declare no conflicts of interest.
Cite this paper
Ryuhei Yamaguchi,Gaku Tanaka,Hao Liu,Toshiyuki Hayase, (2016) Fluid Vibration Induced in T-Junction with Double Side Branches. World Journal of Mechanics,06,169-179. doi: 10.4236/wjm.2016.64014
References
- 1. Kondo, S. (1991) Lessons Learned for PSA from the SGTR Incident at Mihama, Unit 2. Reliability Engineering & System Safety, 45, 57-65.
- 2. Brown, G.L. and Roshko, A. (1974) On Density Effects and Large Structure in Turbulence Mixing Layers. Journal of Fluid Mechanics, 64, 775-816.
http://dx.doi.org/10.1017/S002211207400190X - 3. Tani, I. (1964) Low-Speed Flows Involving Bubble Separation. Progress in Aeronautical Sciences, 5, 79-103.
http://dx.doi.org/10.1016/0376-0421(64)90004-1 - 4. Sarohia, V. (1977) Experimental Investigation of Oscillations Flows over Shallow Cavities. AIAA Journal, 15, 984-991.
- 5. Rockwell, D. and Naudascher, E. (1978) Review-Self-Sustaining Oscillations of Flow past Cavities. Journal of Fluids Engineering, 100, 152-165.
http://dx.doi.org/10.1115/1.3448624 - 6. Sherwin, S.J. and Blackburn, H.M. (2005) Three-Dimensional Instabilities and Transition of steady and Pulsatile Axisymmetric Stenotic Flows. Journal of Fluid Mechanics, 533, 297-327.
http://dx.doi.org/10.1017/S0022112005004271 - 7. Mori, T. and Nagamura, K. (2010) LDV and PIV Measurements of the Organized Oscillations of Turbulent Flow over a Rectangular Cavity. Journal of Fluid Science and Technology, 5, 370-383.
http://dx.doi.org/10.1299/jfst.5.370 - 8. Yagi, T., Sato, A., Shinke, M., et al., 2013.Experimental Insights into Flow Impingement in Cerebral Aneurysm by Stereoscopic Particle Image Velocimetry: Transition from a Laminar Regime. Journal of the Royal Society Interface, 10.
http://dx.doi.org/10.1098/rsif.2012.1031 - 9. Valen-Sendstad, K., Mardal, K-A., Mortensen, M., et al. (2011) Direct Numerical Simulation of Transitional Flow in a Patient-Specific Intracranial Aneurysm. Journal of Biomechanics, 44, 2826-2832.
http://dx.doi.org/10.1016/j.jbiomech.2011.08.015 - 10. Valen-Sendstad, K., Mardal, K.-A. and Steinman, D.A. (2013) High-Resolution CFD Detects High-Frequency Velocity Fluctuations in Bifurcation, but not Sidewall Aneurysms. Journal of Biomechanics, 46, 402-407.
http://dx.doi.org/10.1016/j.jbiomech.2012.10.042 - 11. Valen-Sendstad, K., Piccinelli, M. and Steinman, D.A. (2014) High-Resolution Computational Fluid Dynamics Detects Flow Instabilities in the Carotid Siphon: Implications for Aneurysm Initiation and Rupture? Journal of Biomechanics, 47, 3210-3216.
http://dx.doi.org/10.1016/j.jbiomech.2014.04.018 - 12. Il’ichev, A.T., Fu, Y-B, 2012. Stability of Aneurysm Solutions in a Fluid-Filled Elastic Membrane Tube. Acta Mechanica Sinica, 28, 1209-1218.
http://dx.doi.org/10.1007/s10409-012-0135-2 - 13. Baek, H., Jayaraman M.V., Richardson, P.D., et al. (2010) Flow Instability and Wall Shear Stress Variation in Intracranial Aneurysms. Journal of the Royal Society Interface, 7, 967-988.
http://dx.doi.org/10.1098/rsif.2009.0476 - 14. Bates, A.J., Dooly, D.J., Schroter, R.C., et al. (2015) Dynamics of Airflow in a Short Inhalation. Journal of the Royal Society Interface, 12, 20140880.
http://dx.doi.org/10.1098/rsif.2014.0880 - 15. Dooly, D., Taylor, D.J., Franke, P., et al. (2008) Experimental Investigation of Nasal Airflow. The New England Journal of Medicine, 222, 439-453.
http://dx.doi.org/10.1243/09544119JEIM330 - 16. Karino, T., Kwong, H.H.M. and Goldsmith, H.L. (1979) Particle Flow Behavior in Models of Branching Vessels: I Vortices in 90° T-Junctions. Biorheology, 16, 231-248.
- 17. Liepsch, D., Poll, A., Strigberger, J., et al. (1989) Flow Visualization Studies in a Mold of the Normal Human Aorta and Renal Arteries. Journal of Biomechanical Engineering, 111, 222-227.
http://dx.doi.org/10.1115/1.3168369 - 18. Yamaguchi, R., Mashima, T., Amagai, H., et al. (2005) Variation of Wall Shear Stress and Periodic Oscillations Induced in the Right-Angle Branch during Laminar Steady Flow. Journal of Fluids Engineering, 127, 1013-1020.
http://dx.doi.org/10.1115/1.1852480 - 19. Bruggeman, J.V., Hirschberg, A., Van Dongen, M.E.H., et al. (1989) Flow Induced Pulsation in Gas Transport System: Analysis of the Influence of Closed Side Branch. Journal of Fluids Engineering, 111, 484-491.
http://dx.doi.org/10.1115/1.3243672 - 20. Tonon, D., Willems, J.F.H. and Hirschberg, A. (2010) Flow-Induced Pulsations in Double Branch Systems with Closed Side Branches: Study of the Effectiveness of Detuning as Remedial Measure. Proceedings of 20th International Congress on Acoustics, ICA, Sydney, 23-27 August 2010, 1-9.
- 21. Morita, R., Takahashi, S., Okuyama, et al. (2011) Evaluation of Acoustic-and Flow-Induced Vibration of the BWR Main Steam Lines and Dryer. Journal of Nuclear Science and Technology, 48, 759-776.
http://dx.doi.org/10.1080/18811248.2011.9711759
NOTES

*Corresponding author.