Journal of Diabetes Mellitus
Vol.3 No.1(2013), Article ID:28115,5 pages DOI:10.4236/jdm.2013.31006
Childhood diabetes in a Bangladeshi population
![]()
1Community Medicine, Ibrahim Medical College, Dhaka, Bangladesh; *Corresponding Author: sayeedma@dab-bd.org
2Epidemiology and Biostatistics, Bangladesh Institute of Research and Rehabilitation in Diabetes, Endocrine and Metabolic Disorders, Dhaka, Bangladesh
3Institute of Nutrition and Food Science, University of Dhaka, Dhaka, Bangladesh
Received 4 December 2012; revised 6 January 2013; accepted 15 January 2013
Keywords: Type 2 Diabetes Mellitus; Impaired Fasting Glucose; Family Income; Geographical Area
ABSTRACT
Backgrounds and Aims: Several epidemiological investigations revealed that the prevalence of Type 2 Diabetes Mellitus (T2DM) has been increasing in the adult population of Bangladesh. But the prevalence of diabetes among the children and adolescents in Bangladesh has not been reported. This study addressed the prevalence of diabetes among the younger people in Bangladesh. Subjects and Methods: We investigated school children of age group 10 - 18 years in rural, suburban and urban communities. Investigations included socio-demographic information, height, weight, mid-upper-arm circumference (MUAC), blood pressure (SBP, DBP) and fasting plasma glucose (FPG). We used WHO criteria (1999) for impaired fasting glucose (IFG) and diabetes mellitus (T2DM). Results: A total of 2152 students (boys/girls: 1064/1088) volunteered the study. Their mean (SD) age was 13.3 (2.0) y, BMI was 18.5 (3.1) and MUAC was 21.2 (3.4) cm. The mean (SD) of FPG was 4.6 (0.87) mmol/l. The prevalence of IFG (95% CI) was 3.4% (2.63 - 4.17) and T2DM was 1.8% (1.23 - 2.37). BMI showed no association with FPG in either sex. In assessing risk for hyperglycemia (FPG > = 5.6 mmol/l), logistic regression showed [odds ratio (OR) with 95% CI] that compared with lower age (<12 vs >16 y) higher age had excess risk (OR 5.2, 2.92 - 9.23). Compared with the rural the urban children had higher risk (OR 14.7, 6.41 - 33.78). Higher family income was also found to have higher risk (BDT <5000 vs >8000: OR 2.03, 1.30 - 3.18); whereas, higher BMI and MUAC were proved to be not significant. Conclusions: The prevalence of IFG and T2DM in Bangladeshi children and adolescents appears to be high. The urban children from the higher family income are the most vulnerable for developing diabetes, obesity and hypertension. A prospective cohort including other variables like physical activities, waist-girth, insulin or macro-/micronutrients may explain which risk factors are significant for developing diabetes among children and adolescents in Bangladesh.
1. BACKGROUND
So far Bangladesh has the highest population density (1007/sq km) in the world with a total population of 165 million [1]. Of this total, 61 million people are in the age <18 years. It is also known that Bangladesh is one of the least developing countries [2] with its ethnicity most vulnerable for developing diabetes [2]. According to some estimate, in 2004, children of South Asian origin were more than 13 times more likely to have type 2 diabetes than white children [3-5]. Type 2 diabetes is up to six times more common in people of South Asian descent and up to three times more common among people of African and African-Caribbean origin [6]. According to the Health Survey for England 2004, doctor-diagnosed diabetes is almost four times as prevalent in Bangladeshi men, and almost three times as prevalent in Pakistani and Indian men compared with men in the general population [6]. Among women, diabetes is more than five times as likely among Pakistani women, at least three times as likely in Bangladeshi and Black Caribbean women, and two-and-a-half times as likely in Indian women, compared with women in the general population [6]. The above-mentioned reports and the reports related to childhood diabetes [3-5] indicate that Bangladeshis are more prone to develop diabetes from its early age. Possibly, the Bangladeshis are genetically more susceptible for developing diabetes or the rapid transition with faster urbanizing environment affecting the lifestyle of the native population or both may attribute to the increased prevalence of childhood diabetes. Unfortunately, there has been no such study that addressed the prevalence of diabetes among Bangladeshi children. This study has been undertaken to estimate the prevalence of diabetes among Bangladeshi children and adolescents.
2. STUDY DESIGN
The study protocol was duly submitted to the “Ethical Review Committee” of the Diabetic Association of Bangladesh (DAB) and the committee approved the protocol. According to the study proposal, all the students aged 10 - 18 years, enrolled in the secondary schools, were considered eligible participants. The secondary schools were selected purposively-eight in rural, two in suburban and five in urban areas. All students of age group 10 to 18 years were enlisted from each school. Systematic randomized sample based on class role number was accepted. To include participants we considered the proportion of area population (rural, urban and suburban) [1] and maintained an equal ratio of male and female participants. We discussed with the Headmasters and teachers of each school about the investigation procedures and objectives. We sought help from teaching staff and got the list of participants. Informed consent was taken from each selected individual and his/her parents or guardians following discussion about the objectives and procedural details before Registration of the eligible participants.
2.1. Investigation Procedure
After registration, each student was advised to attend the school at 8 AM with about 12-h overnight fast accompanying parents. The participant and parents were interviewed about annual family income. The participants were then categorized as poor, middle and rich class according to low, middle and high tertile of income, respectively. Following interview, the measurements of height, weight and mid-upper arm circumference (MU AC) were taken. Body mass index (BMI = wt in kg/ht in m.sq.) was calculated. Allowing ten minutes rest, BP was taken in the right arm in sitting position. A mean of three measurements of BP was accepted. For the female students, a female physician and female associates took anthropometry and blood pressure (BP). Each participant was explained and given a practical demonstration on phlebotomy for blood sample collection. Then, if agreed, five ml of fasting blood sample was drawn for estimation of fasting plasma glucose (FPG), total cholesterol (Tchol), triglycerides (TG) and high-density lipoproteins (HDL-c).
2.2. Biochemical Analyses
Plasma was separated after centrifugation in the field within 2 hours of collection. Then plasma was transported through iced chamber that maintains temperature –40 to 0 Celsius for 8 hs, an adequate time to reach BIRDEM for storage in refrigerator that maintains temp at –280 C. Biochemical tests were carried out in BIRDEM central Lab. The measurement of plasma glucose was done after enzymatic oxidation in the presence of glucose-oxidase. The formed hydrogen peroxide reacts under catalysis of peroxidase with phenol and 4-aminophenazone to form a red-violet quinoneimine dye as an indicator. Glucose was stable in plasma for 24 hours as it was separated just after collection. Plasma glucose was measured by glucose oxidase-peroxidase method using Technicon M-II auto-analyzer. The estimation of Chol, TG and HDL was done by auto-analyzer (Hitachi-704) using enzymatic method. The coefficient of variation (CV) was allowed <3%. We used WHO diagnostic criteria (1999) for IFG and T2DM [7].
2.3. Data Analysis
The mean values with standard deviation (SD) of biophysical characteristics (ht, wt, BMI, MUAC, SBP DBP, FPG, TG, t-Chol, HDL-c) of boys and girls were given separately for comparison. We used “unpaired t-test” for comparison of characteristics between boys and girls. The prevalence rates for both IFG and T2DM were given according to age, sex, area (rural, suburban & urban) and family income (poor, middle, rich social class). The prevalence rates of abnormal fasting glucose (AFG = FPG > 5.6 mmol/l) were also shown. The increasing risk (OR with 95% CI) for AFG were estimated for different age groups, area and family income (social class). “Chi-sq” tests estimated increasing trend with age and social class and determined the association between variables. The probability less than 0.05 was considered significant. All statistical analyses were performed using SPSS 12.0 software.
3. RESULTS
A total of 2152 (1064 boys, 1088 girls) students volunteered. The participants from rural area were 800 (m/f = 376/424); urban were 949 (m/f = 502/447) and suburban were 402 (m/f = 185/217). Of these participants, 53% were from the middle class, 25.5% from the poor and 21.5% from the rich social class. The mean (SD) age of all participants was 13.3 (2.0) y, BMI was 18.5 (3.1) and MUAC was 21.2 (3.4) cm. The mean (SD) of FPG, TG and HDL were 4.6 (0.87) mmol/l, 107 (44) mg/dl and 45.0 (10.6) mg/dl, respectively. These variables were not shown for total participants but each of these was shown and compared between boys and girls in Table 1. Compared with the boys the girls had significantly higher age (p < 0.05), BMI (p < 0.01) and TG (0.05); whereas, FPG, SBP, DBP, t-chol and HDL-c did not differ. The means with SD and 95% CI of FPG in different age groups are shown in Table 2. ANOVA estimated the difference of FPG level across age groups and found that only the highest age-group (16.1 - 18.0 y) had significantly higher values than that of the lower age-groups. Again, one-way ANOVA compared the mean values of BMI, SBP, DBP and FPG among the poor, middle and rich social classes (Table 3). It was found that none of these variables (BMI, SBP, DBP and FPG) differed between the poor and the middle class, whereas, the rich class had significantly higher values than both poor and middle class. Likewise, ANOVA compared these variables among rural, suburban and urban students and there were no significant differences except FPG which was significantly higher (p < 0.001) in the urban students than rural and suburban counterparts. Controlling for sex, FPG showed significant positive correlation with age, income, t-chol, TG and HDL (for all, p < 0.01) but not with BMI and MUAC (data not shown).
Table 1. The comparison of biophysical variables between boys and girls.
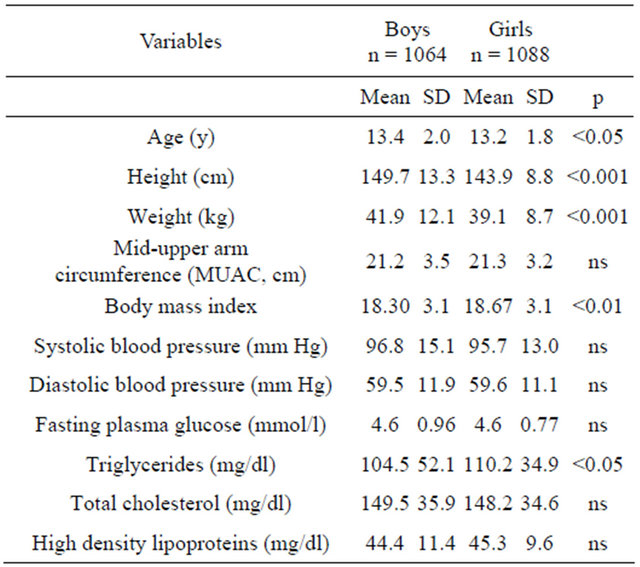
SD-standard deviation; p-probability after comparison between boys and girls using unpaired t-test.
Table 2. Level of fasting plasma glucose (mmol/l) according to age groups.
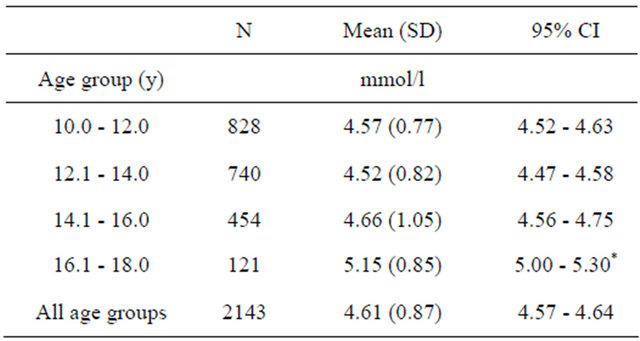
*only the highest age group (16.1 - 18.0 y) showed significant difference from all other age groups, whereas, all the other age groups did not differ.
Table 3. The comparison of mean (SD) of BMI, SBP, DBP and FPG according to poor, middle and rich family-income groups estimated by ANOVA.
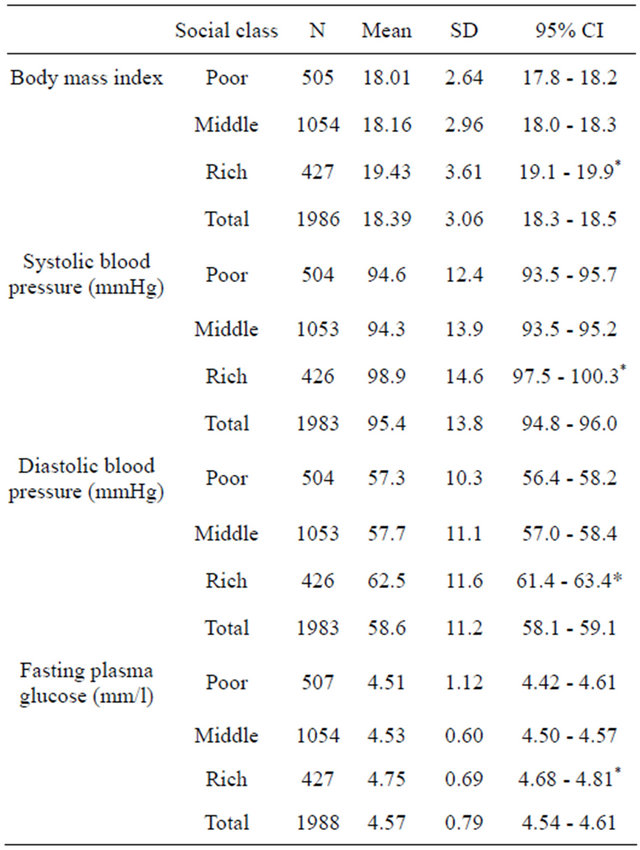
SD—standard deviation, CI—confidence interval; *BMI, SBP, DBP and FPG of the poor and the middle class did not differ, whereas, the rich class significantly differed from both the poor and the middle.
The prevalence of T2DM (95% CI) was 1.8% (1.23 - 2.37) and IFG was 3.4% (2.63 - 4.17) (Table 4). Compared with the girls the boys had significantly higher prevalence of T2DM (1.0% vs 2.6%, p < 0.01) but not of IFG. Both the prevalence of IFG and T2DM increased with age and income (social class) (for both p < 0001; Table 4). As regards area, the prevalence of IFG and T2DM were significantly higher (for both, p < 0.001) in the urban students as compared with their suburban and rural counterparts.
We used logistic regression to determine the risk factors for AFG (FPG > 5.6 mmol/l). Taking AFG as a dependent variable and age, sex, area, social class and BMI as covariates we found that only higher age and urban area were proved to have independent risk. This analysis indicated that irrespective of sex, social class and obesity these children had equal risk for developing diabetes.
4. DISCUSSION
This study was unique in the sense that it investigated the children and adolescents (10 - 18 y) of three geographical sites (rural, suburban and urban) representing
Table 4. The prevalence of IFG and T2DM by age, sex, area and family income. ORs are estimated for AFG.
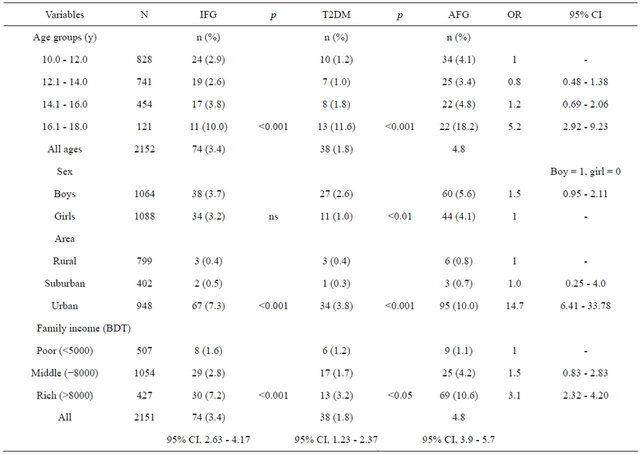
Note: for IFG estimate T2DM subjects excluded; likewise for T2DM, IFG subjects excluded. Percentages are given in parenthesis. p = probability estimated after chi sq test. AFG (Abnormal Fasting Glucose) = IFG + DM; OR = odds ratio.
different stages of socio-cultural development in Bangladesh. It is first of its kind to assess the magnitude of T2DM and related risk factors in this younger age group.
Overall, the participation was satisfactory and almost proportional representation of the national population [1]. The prevalence of IFG and T2DM (3.4% & 1.8%) found in the study population indicates a very high prevalence among the Bangladeshi children and adolescents. As there was no previous report on diabetes prevalence in this age group in Bangladesh or in neighboring countries, it is difficult to comment whether the rates are high or low. However, several studies conducted in migrant Bangladeshis in UK and Indian Americans in USA indicate that our findings are very much consistent with them [8-10]. Again, the comparison of biophysical characteristics of boys and girls shown in Table 1, also could not be compared with any other study findings in the study population. The girls had significantly higher BMI than the boys. This is possibly due to restricted outdoor physical activities and cultural confinement of the adolescent girls in Bangladesh.
An increasing prevalence of IFG and T2DM with advancing age was significant and very high prevalence was found in the age group 16 - 18 y (Table 2). It is not clear why there was an excessively high prevalence in this particular age group. Possibly, this may be associated with increased sex-hormone globulin and testosterone at this stage [11]. The steroids have known anti-insulin effect and may be explained as why the males had higher prevalence of T2DM.
As regards the area and family income, the urban children had significantly higher IFG and T2DM than the suburban and rural children. Obviously, this is due to lesser physical activities among the urban children. Higher family income (the rich) had the highest prevalence of both IFG and T2DM and this finding was found significant. It may be explained that the students from the rich class had significantly higher BMI, higher SBP & DBP and higher FPG, whereas, there was no significant difference between middle and lower (poor) income groups. On the contrary, logistic regression discarded the effect of sex, higher income and obesity as risk factors for diabetes. This means that all children irrespective of sex, social class and obesity had equal risk for AFG. However, logistic regression unequivocally proved that the urban children had excess risk with advancing age. Possibly, the excess risk for urban children may be due urbanized lifestyle like less physical activities and passing leisure with sedentary games or may be some other factors that remained unidentified.
5. CONCLUSIONS
The study revealed that the prevalence of IFG and T2DM in Bangladeshi children and adolescents, which appears to be high. The urban children from the higher family income are the most vulnerable for developing diabetes, obesity and hypertension. More study at a larger scale with more risk variables like physical activities, nutritional status and psychosocial stress may confirm the prevalence of IFG and T2DM and may identify the risk factors for the non-communicable metabolic diseases.
6. ACKNOWLEDGEMENTS
We are very much grateful to WHO for funding the project. We are also grateful to authorities of BIRDEM for their active cooperation in providing laboratory facilities for biochemical investigations. We must acknowledge the cooperation extended by the Headmasters, teachers, parents and students of the participating schools.
REFERENCES
- Singh, A.C. (2000) Bangladesh Bureau of Statistics. Statistical pocket book of Bangladesh 2000. In: Singha, A.C., Ed., Statistical Division, Ministry of Planning, Government of the People’s Republic of Bangladesh, Dhaka.
- International Diabetes Federation (2009) Diabetes atlas. 4th Edition.
- Ehtisham, S., Hattersley, A.T., Dunger, D.B., et al. (2004) First UK survey of paediatric type 2 diabetes and MODY. Archives of Disease in Childhood, 89, 526-529. doi:10.1136/adc.2003.027821
- Ehitisham, S., Barrett, T.G. and Shaw, N.J. (2000) Type 2 diabetes mellitus in UK children and emerging problem. Diabetic Medicine, 17, 867-871. doi:10.1046/j.1464-5491.2000.00409.x
- Drake, A.J., Smith, A. and Betts, P.R., et al. (2002) Type 2 diabetes in obese white children. Archives of Disease in Childhood, 86, 207-208. doi:10.1136/adc.86.3.207
- Department of Health (2001) National service framework for diabetes. www.dh.gov.uk/en/Publicationsandstatistics/Publications/PublicationsPolicyAndGuidance/Browsable/DH_4096591
- World Health Organization (1999) Report of a WHO consultation, definition, diagnosis and classification of diabetes mellitus and its complications. WHO/NCD/NCS/ 99.2, Geneva.
- London Health Commission Awards. Maslaha wins award at City Hal. www.london.gvt.uk/llhcawards
- Bloomgarden, Z.T. (2004) Type 2 diabetes in the young: The evolving epidemic. Diabetes Care, 27, 998-1010. doi:10.2337/diacare.27.4.998
- Dabelea, D., Hanson, R.L., Bennett, P.H., Roumain, J., Knowler, W.C. and Pettitt, D.J. (1988) Increasing prevalence of type II diabetes in American Indian children. Diabetologia, 41, 904-910. doi:10.1007/s001250051006
- Kirstie, K., Danielson, K.K., Drum, M.L. and Lipton, R.B. (2008) Sex hormone-binding globulin and testosterone in individuals with childhood diabetes. Diabetes Care, 31, 1207-1213.
Acronyms
AFG: Abnormal Fasting Glucose (FPG > 5.6 mmol/l). BMI: Body Mass Index wt in kg/ht in msq.
CI: Confidence Interval.
FPG: Fasting Plasma Glucose.
HDL: High Density Lipoproteins.
HTN: Hypertension.
IFG: Impaired Fasting Glucose.
MUAC: Mid Upper Arm Circumference.
OR: Odds Ratio.
SBP & DBP: Systolic & Diastolic Blood Pressure.
SD: Standard Deviation.
TG: Triglycerides, T-Chol-Total Cholesterol.
T2DM: Type 2 Diabetes Mellitus.
WHO: World Health Organization.