Journal of Diabetes Mellitus
Vol.1 No.3(2011), Article ID:7116,8 pages DOI:10.4236/jdm.2011.13010
Preventive effect of Catharanthus roseus (Linn.) against high-fructose diet-induced insulin resistance and oxidative stress in male Wistar rats
Department of Biochemistry, Sri Krishnadevaraya University, Anantapur, India; *Corresponding Author: skumari1@yahoo.co.in
Received 6 June 2011; revised 15 July 2011; accepted 26 July 2011.
Keywords: Catharanthus roseus; Insulin Resistance; Fructose Diet; HOMA; Oxidative Stress
ABSTRACT
High intake of dietary fructose has been shown to exert a number of adverse metabolic effects in humans and experimental animals. The aim of the present study was to investigate whether Catharanthus roseus (L.) G. Don (Apocynaceae) leaf powder alleviates high-fructose diet-induced insulin resistance and oxidative stress in rats. Adult male Wistar rats of body weight around 200 g were divided into four groups, two of which were fed with standard pellet diet and the other two with high fructose (66%) diet. C. roseus leaf powder suspension in water (100 mg/kg body weight/day) was administered orally to each group of the standard pellet diet fed rats and the high fructose diet fed rats for 60 days. Fructose fed rats (F-group) showed hyperglycemia, hyperinsulinemia, insulin resistance and hyperlipidemia (P < 0.05). C. roseus treatment in fructose fed rats (F+CR-group) prevented the rise in glucose levels by 32.2%, insulin by 46.4%, and impaired insulin sensitivity by 63.6%. C. roseus treatment completely prevented the fructose induced plasma lipid alterations. Regarding liver antioxidant status, oxidative stress was observed in fructose fed rats (F-group), while C. roseus treatment in F+CR-group prevented the fructose induced oxidative stress. Our data indicate the preventive role of C. roseus against fructose-induced insulin resistance and oxidative stress; hence this plant can be used as an adjuvant for the prevention and/or management of insulin resistance and disorders related to it.
1. INTRODUCTION
The last 25 years have witnessed a marked increase in total per capita fructose intake as a sweetener in the food industry, primarily in the form of sucrose (a disaccharide consisting of 50% fructose) and high-fructose corn syrup (HFCS; 55% - 90% fructose content) [1]. Processedfood manufacturers often prefer HFCS to sucrose because it is inexpensive, sweeter and mixes well in many foods. The increase in HFCS consumption far exceeds the increases in intake of any other food or food group. The disturbing fact is fructose consumption (excluding that which occurs naturally in fruits and vegetables) increased from less than 0.5 g/day in 1970 to more than 40 g/day in 1997 (more than an 80-fold increase) [2].
High intake of dietary fructose exerts a number of adverse health effects in humans and experimental animals including obesity, hypertriglyceridemia, hyperinsulinemia, glucose intolerance hyperuricemia, insulin resistance, hypertension, accelerated aging, nonalcoholic fatty liver disease, etc. [3-5]. This cluster of disorders is similar to those observed in human multimetabolic syndrome or syndrome X or insulin resistance syndrome, which is observed in prediabetic patients that progresses to type 2 diabetes mellitus and cardiovascular diseases. The fructose-fed rats are used as animal models of insulin resistance (IR) that is considered to parallel multimetabolic syndrome observed in humans [6]. Insulin sensitizers and antioxidants are found to be effective in preventing not all but at least a majority of the abnormalities induced by fructose [7,8]. Current treatment with thiazolidinediones and particularly metformin does not adequately address the issue of IR [9]. Hence, there is a need to search for new agents with better efficacy and minimal side effects. Actually, there is an enormous increase in the use of herbal and other alternative medicines for this target.
Catharanthus roseus (L.) G. Don (Apocynaceae) is known with various names (Madagascar periwinkle; Vinca rosea; Lochnera rosea). Catharanthus roseus is one of the few medicinal plants which have found mention in the folk medicinal literature. C. roseus alkaloids, vincristine and vinblastine, are widely used as chemotherapeutic agents against Leukemia and Hodgkin’s disease worldwide [10]. The fresh juice from the flowers of C. roseus made into a tea has been used by Ayurvedic physician in India for external use to treat dermatitis, eczema and acne [11]. The leaves of this plant has indeed been used to treat diabetes and often taken without adverse effects or toxicity. The antihyperglycemic activity of C. roseus leaf powder in STZ-induced diabetic rats was observed in our laboratory [12]. Fresh leaf juice of C. roseus has been reported to reduce blood glucose in normal and alloxan diabetic rabbits [13]. Significant antihyperglycemic activity of leaf alcoholic extract [14,15] and dichloromethane-methanol extract of leaves and twinges [16] have been reported in laboratory animals. The extracts of C. roseus have been reported to have human peroxisome proliferator receptor activating activity [17]. The leaf juice of C. roseus has been reported to reduce serum total cholesterol and triglyceride in rats [18]. However very little information is available on the role of C. roseus in the improvement of IR and antioxidant property. Hence, the present study has been undertaken to explore possible beneficial effects of C. roseus leaf powder in the prevention of fructose induced IR and oxidative stress in rats.
2. MATERIALS AND METHODS
2.1. Plant Material
Catharanthus roseus was (white variety) taxonomically authenticated by the Department of Botany, Sri Krishnadevaraya University, Anantapur and the voucher specimen was kept in the herbarium (No. 2235) of our University. Fresh leaves of C. roseus (white variety) were collected during September, from the University campus and leaves were shade dried and then grinded to fine powder. The powder was stored at 0˚C - 4˚C and dissolved in water just before administered to animals.
2.2. Rat Feed
The fructose diet and pellet diet were procured from National Centre for Animal Science, National Institute of Nutrition (Hyderabad, India). Fructose diet contains 66% fructose, 15% protein, 8% fat, 4% cellulose, 3.5% of each mineral and vitamin mix. Pellet diet had same composition except that fructose was replaced with starch.
2.3. Animal Model and Experimental Design
Male Albino Wistar rats (140 g - 160 g) used for the present study were procured from Sri Venkateswara Enterprises (Bangalore, India). The current work was carried out after approval by our institutional animal ethical committee (Regd. no. 470/01/a/CPCSEA). Before dietary manipulation, the animals were acclimatized for 7 days in our animal house. They were housed two per cage in an air-conditioned room (22˚C ± 2˚C) with 12 h light/dark cycle and had free access to standard pellet diet and water.
2.4. Experimental Design
All the animals were 6 weeks of age, weighing around 180 g at the time of dietary manipulation. Animals were randomly assigned into four groups of eight each as given below:
Group-C: control rats, fed with standard pellet diet
Group-F: fructose fed rats, fed with fructose diet
Group-F+CR: C. roseus treated fructose rats, fed with fructose diet and treated with C. roseus leaf powder
Group-C+CR: C. roseus treated control rats, fed with standard pellet diet and treated with C. roseus leaf powder.
Group-F+CR and C+CR animals received C. roseus leaf powder suspension (100 mg/kg body weight) in 2 mL distilled water daily for 60 days through oral intubation, whereas 2 mL of distilled water was administered to C and F-group rats. The dose of C. roseus leaf powder used in the current study is based on our previous experiments on dose-dependent antihyperglycemic effect in STZ-induced diabetic rats [12]. During the experimental period blood was collected from 12 h fasted rats by means of capillary tubes through orbital sinus. The body weight, fasting plasma glucose and insulin were measured on initial, 15, 30, 45 and 60th day of experiment. Plasma lipids were measured on 60th day of experiment. At the end of experimental period animals were fasted over night and sacrificed by cervical decapitation. The body was cut open and liver was dissected out into ice cold saline and then thoroughly rinsed.
2.5. Biochemical Measurements
Plasma glucose was estimated by glucose oxidase-peroxidase (GOD-POD) method by using the Span diagnostic kit (Span diagnostic Ltd., Surath, India). Plasma total cholesterol (TC), triglycerides (TG) and HDL-cholesterol (HDL-C) were estimated by enzymatic colorimetric end point methods using Span diagnostic reagent kit. LDL-cholesterol (LDL-C) and VLDL-cholesterol (VLDL-C) were obtained by calculations using the formula provided in cholesterol diagnostic kit booklet. Atherogenic index was calculated as TC/HDL-C. Plasma insulin was estimated by using radioimmunoassay kit (RIA K-1) from Bhabha Atomic Research Centre (Mumbai, India) according to the method of Yalow & Berson [19]. Homeostasis Model Assessment (HOMA), used as an index to measure the degree of IR, was calculated by the formula: Insulin (µU/ml) × Glucose (mmol/L)/ 22.5 [20].
The concentration of lipid peroxidation intermediates, liver thiobarbituric acid reactive substances (TBARS) was measured by following the method of Utley et al., [21] using 10% liver homogenate in 0.15 M KCl and expressed as nmol of Malondialdehyde (MDA) formed/ min/mg protein. The extent of protein carbonyl groups [22] and reduced glutathione (GSH) levels [23] in liver were determined. Protein content in the liver homogenate was measured by the method of Lowry et al. [24].
2.6. Enzyme Assays
Ten percent liver homogenate was prepared in ice-cold 0.15 M KCl, centrifuged at 12,000 rpm for 45 min in Sigma Laboratory centrifuge 3K18 model, rotor No. 12150. The clear supernatant thus obtained was used for the assay of superoxide dismutase (SOD; E.C.1.15.1.1) [25], catalase (CAT; E.C.1.11.1.6) [26], glutathione peroxidase (GPx; E.C.1.15.1.9) [27], glutathione-Stransferase (GST; E.C.2.5.1.14) [28], and glutathione reductase (GR; E.C.1.8.1.7) [29].
2.7. Statistical Analysis
All results were expressed as means ± SEM for the number, n = 8 of animals in the group as indicated in the figures and table. To determine the statistical signifycance of clinical and laboratory findings Duncan Multiple Range test (DMRT) (P < 0.05) was used.
3. RESULTS
3.1. General Characteristics
No visible side effects and variation in animal behavior (respiratory distress, abnormal locomotion and catalepsy) were observed in experimental animals.
3.2. Body Weight
The body weights of four groups of animals during the experimental period are represented in Figure 1. From initial day of experiment to the end of experimenttal period, the gain in body weight in C, C+CR, F and F+CR-groups were 94, 95, 116.5 and 98.6 g respectively. No significant variation was observed regarding gain in body weight of C+CR and F+CR-groups when com-
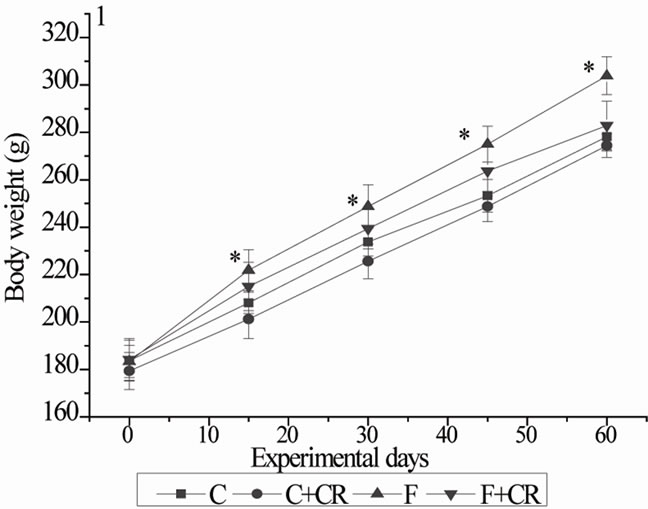
Figure 1. Mean body weights of rats during experimental period. C: control rats; C+CR: control diet fed rats treated with C. roseus leaf powder at a dose of 100 mg/kg b.wt; F: fructose fed rats; F+CR: fructose fed rats treated with C. roseus leaf powder at a dose of 100 mg/kg b.wt. Values are given as mean ± S.E (n = 8). * Significant as compared to group-C (P < 0.05).
pared with C-group. By the end of experimental period, F-group gained 24% more body weight compared with C-group.
3.3. Fasting Blood Glucose
Data on plasma glucose content of the four experimental groups are represented in Figure 2. Control and C+CR and F+CR-groups remained persistently euglycemic throughout the experimental period. At the end of experimental period, plasma glucose level of F-group was significantly higher (52%) than those of C-group.
3.4. Fasting Plasma Insulin and IR (HOMA)
The fasting plasma insulin levels of four groups of the animals during experimental period were represented in Figure 3. Control-group showed no significant variation in the insulin levels during the experimental period. Control rats treated with C. roseus (C+CR-group) showed a gradual decrease in the insulin levels during experimental period with statistically lower insulin levels at 45 and 60 days when compared with C-rats. Group-F exhibited a gradual increase in plasma insulin during experimental period showing a significantly higher concentration of insulin at 15, 30, 45 and 60 days with 10.7%, 48.6%, 77% and 140% respectively when compared with C-group. The plasma insulin levels of F+CR-group were 47.7 ± 1.4, 50.5 ± 1.6 and 57.6 ± 1.7 at 30, 45 and 60 days respectively with 66.8%, 75.7% and 79.7% recovery from fructose induced hyperinsulinemia. The insulin levels of F+CR-group at the end of experimental period were significantly lower (46.4%) than F-group but still significantly higher (28.4%) than C-group.

Figure 2. Mean plasma glucose of rats during experimental period. C: control rats; C+CR: control diet fed rats treated with C. roseus leaf powder at a dose of 100 mg/kg b.wt; F: fructose fed rats; F+CR: fructose fed rats treated with C. roseus leaf powder at a dose of 100 mg/kg b.wt. Values are mean ± S.E (n = 8). * Significant as compared to group-C (P < 0.05).

Figure 3. Mean plasma insulin of rats during experimental period. C: control rats; C+CR: control diet fed rats treated with C. roseus leaf powder at a dose of 100 mg/kg b.wt; F: fructose fed rats; F+CR: fructose fed rats treated with C. roseus leaf powder at a dose of 100 mg/kg b.wt. Values are mean ± S.E (n = 8). * Significant as compared to group-C (P < 0.05).
Figure 4 shows HOMA data for insulin resistance. Control rats treated with C. roseus (C+CR-group) showed lower levels of HOMA at 60 days when compared with C-rats. The HOMA values of F-group at 15, 30, 45 and 60 days was 26, 96.8, 162 and 270% more when compared with corresponding HOMA values of C-group. Fructose rats treated with C. roseus (F+CR-group) showed significantly low levels of HOMA with 38, 52 and 62% decrease at 30, 45 and 60 days respectively when compared to F-rats. But, this decrease in HOMA values of F+CR-rats did not
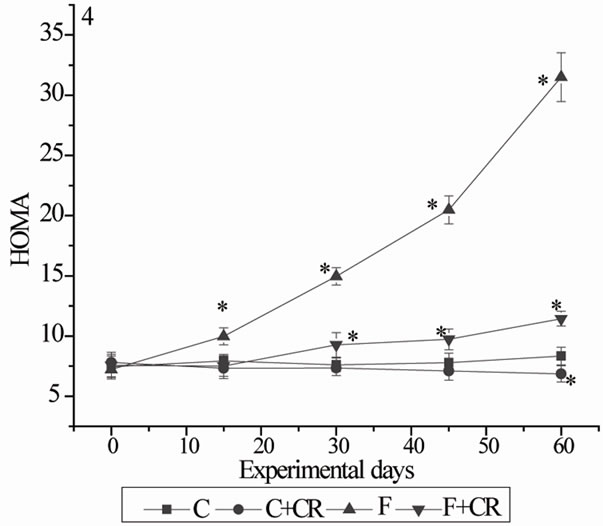
Figure 4. Mean HOMA values (fig 4) of rats during experimental period. (HOMA: Homeostasis model of assessment for insulin resistance was calculated as fasting plasma insulin (μU/ml) × fasting plasma glucose (mmol/l)/22.5). C: control rats; C+CR: control diet fed rats treated with C. roseus leaf powder; F: fructose fed rats; F+CR: fructose fed rats treated with C. roseus. Values are mean ± S.E (n = 8). * Significant as compared to group-C (P < 0.05).
reach to the control values.
3.5. Plasma Lipid Profile
At the end of experimental period a significant increase in plasma TC (62%), TG (105%), LDL-C (112.7%) and VLDL-C (104.5%) and a significant decrease (12%) in HDL-C in F-group compared to C-group resulted in a significant increase (80%) in atherogenic index. The triglyceride levels of group-F+CR showed no significant variation when compared with group-C. A significant decrease in plasma TC (9.8%), TG (7.2%), LDL-C (38.8%), VLDL-C (7.5%) and a significant increase (15%) in HDL-C concentration in C+CR-group compared to C-group lead to a significant decrease in atherogenic index (23.2%). (Table 1).
3.6. Hepatic Oxidative Stress Markers and Antioxidants
Table 2 summarizes the hepatic oxidative stress markers and antioxidants. Group-F showed a significantly higher levels of TBARS (33.2%) and protein carbonyl groups (26%) and low levels of hepatic GSH (23%) as compared to group-C rats. C. roseus treatment for 60 days prevented the increased tissue TBARS and protein carbonyl groups and decreased GSH levels in F+CR -group. Group-C+CR showed 8.6% increase in GSH levels when compared to group-C rats. The activities of enzymatic antioxidants GR, GPx, GST, SOD and CAT were significantly lower (9.31%, 14.4%, 14.2%, 19%, and 19%, respectively) in group-F rats than in group-C
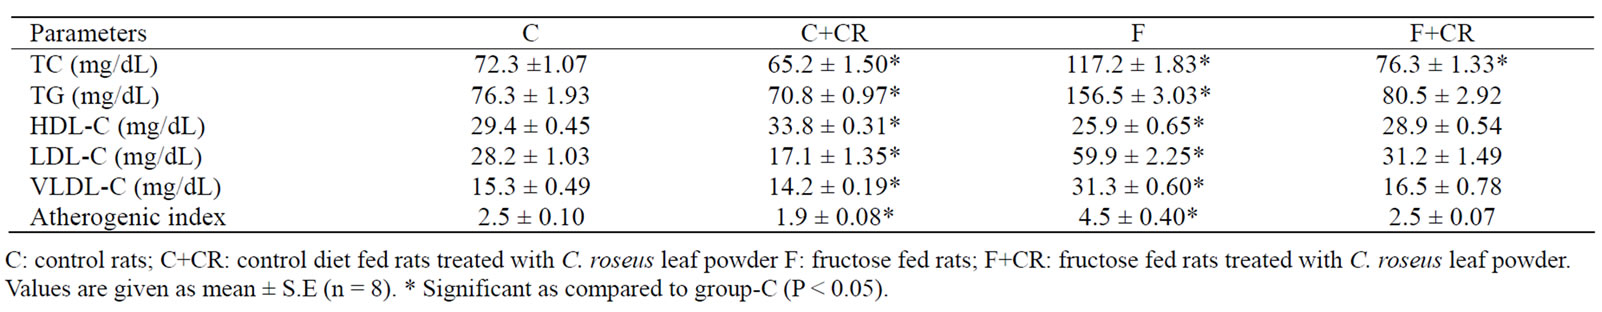
Table 1. The Effect of C. roseus on plasma lipid profile in control and fructose fed rats.
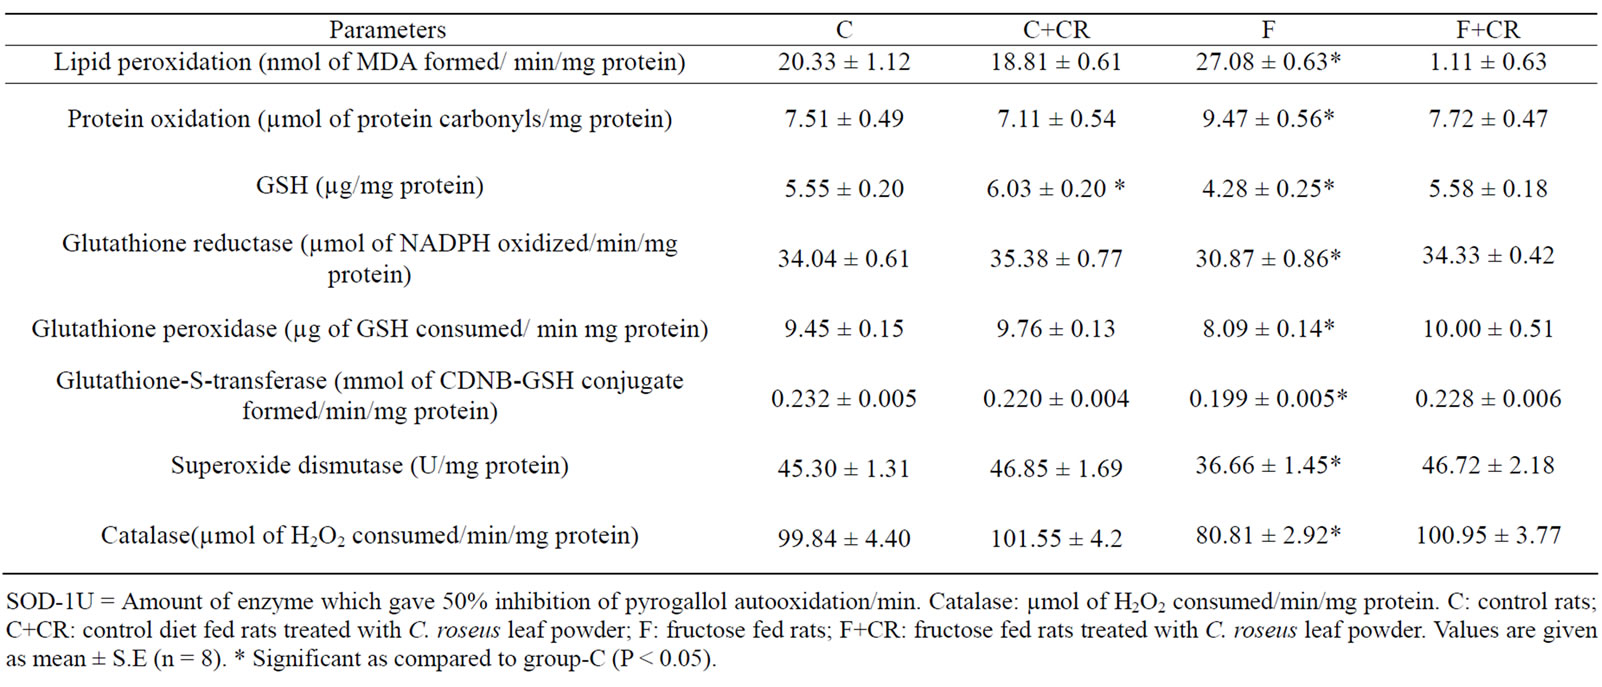
Table 2. Effect of C. roseus on hepatic oxidative stress markers and antioxidants.
rats. In group-F+CR, the activities were significantly higher (11.2%, 23.6%, 14.5%, 27.4% and 25%, respectively) as compared to group-F.
4. DISCUSSION
Insulin resistance is a wide spread feature of atherogenic diseases, predisposes the affected individuals tovarious diseases including hypertension, dyslipidemia, cardiovascular problems and type 2 diabetes mellitus [30].
Information is available in experimental animals on the metabolic and endocrine effects of dietary fructose suggesting that increased consumption of fructose may be detrimental in terms of body weight and adiposity and the metabolic indices associated with the insulin resistance syndrome [4] and it was also observed in our laboratory [5]. In the present study, high fructose feeding resulted in significant increase in the body weight, fasting hyperglycemia, hypertriglyceridemia, hyperinsulinemia, glucose intolerance and impaired antioxidant potential leading to the development of insulin resistance.
In experimental animals fructose feeding resulted in a significant increase in the body weight from 15 days till the end of experimental period. Insulin is involved in the regulation of body adiposity via its action on the central nervous system (CNS) to inhibit food intake and increase energy expenditure. Thus, reduced insulin delivery into the CNS or disruption of the insulinsignaling pathway in CNS may result in the weight gain and development of obesity [31]. It is noteworthy that C. roseus treatment prevented weight gain in fructose fed rats despite increased energy intake. The reason for this behavior may be the interference of C. roseus on the fructose-induced lipid synthesis.
In the present study fructose fed animals showed a significantly enhanced plasma glucose, insulin and IR as reflected by increased HOMA value from 15 days on words till the end of the experimental period. The plasma glucose values of C. roseus treated fructose fed rats (F+CR-group) were in control levels and plasma insulin and HOMA values were significantly higher than the control values, but these values were significantly low when compared with F-group. Thus C. roseus has shown protection against hyperglycemia and a partial prevention of hyperinsulinemia and IR in fructose fed rats. The significantly decreased plasma insulin and HOMA levels at 60 days of C+CR-group with normoglycemia represent the enhanced insulin sensitivity of these animals compared to C-group. Indeed, insulin sensitizers have shown their ability to improve insulin sensitivity in many ways, such as effect on muscle insulin sensitivity, stimulation of insulin-sensitive fat cells, and regulation of leptin expression [32]. The question, whether the mechanism by which C. roseus improves insulin sensitivity by its direct effects on target tissues or indirectly through endogenous substances, requires further study in future.
The dyslipidemia observed in fructose fed rats was reflected by significantly enhanced plasma TG, TC, LDL-C and VLDL-C with significantly decreased HDL-C. Thus fructose fed rats showed higher atherogenic index, which is the risk factors for coronary heart disease. High levels of plasma triacylglycerols are a well-established consequence of dietary fructose intake. Numerous mechanisms have been suggested to explain this phenomenon. The fructose is more lipogenic than glucose and high concentration of fructose can serve as a relatively unregulated source of acetyl-CoA. It continues to enter the glycolytic pathway distal to phosphofructokinase, and hepatic triacyl-glycerol production is facilitated. Increased delivery of triglycerides to the muscle interferes with the utilization of glucose, through the principles of Randle cycle [33], impairing insulin action leading to hyperglycemia and hyperinsulinemia. As insulin resistance and reduced insulin binding have been reported in hypertriglycerolemic persons [34], this may be one mechanism by which fructose diets promote insulin resistance. C. roseus treatment completely prevented fructose-induced hyperglycemia and partially prevented hyperinsulinemia in group-F+CR. These positive effects can be attributed to prevention of hypertriglyceridemia in these rats.
Oxidative stress results when the rate of oxidant production exceeds the rate of oxidant scavenging. Along with hyperglycemia, hyperinsulinemia in insulin resistance condition and enhanced FFA observed in diabetes and insulin resistance condition are also sources of free radicals [35,36].
Decreased hepatic GSH levels, decreased activities of antioxidant enzymes and increased lipid peroxidation intermediates in group-F clearly indicates the development of oxidative stress in fructose fed rats and it could cause impaired insulin function in insulin resistance condition. Previous studies strongly suggest that oxidative stress occurs in rats fed a high fructose diet [35].
Peroxidative deterioration of lipids is evident from the increased levels of malondialdehyde, while the increased protein carbonyl groups signify protein damage. Kocic et al., [37] reported that positive correlation was found between the malondialdehyde level and index of insulin sensitivity (Fasting Insulin Resistance Index). Ceriello et al., [38] reported that protein modification through increased free radical generation could reduce insulin activity. Reactive oxygen species (ROS) can themselves reduce the activity of antioxidant enzymes such as CAT and GPx. The decreased SOD activity in fructose fed rats may be due to enhanced protein glycation by fructose as it is more reactive reducing sugar compared to others (glucose and lactose) [39]. The decreased GSH levels in group-F could be due to increased utilization to trap free radicals, and/or decreased regeneration as evident with the lower activity of glutathione reductase enzyme.
The antioxidant potential of C. roseus against fructose diet-induced oxidative stress is evident with lower levels of TBARS, higher GSH levels and increased activities of antioxidant enzymes seen in group-F+CR when compared with group-F. As oxidative stress has been suggested as one mechanism for the detrimental effects of fructose, the antioxidant potential of C. roseus may be one among several mechanisms by which this plant prevented insulin resistance. Through in vitro studies and in animal models, it has been found that antioxidants improve insulin sensitivity [8]. Clinical trials, have also demonstrated that treatment with vitamin E, vitamin C, or glutathione improves insulin sensitivity in insulinresistant individuals and/or patients with type 2 diabetes [40].
5. CONCLUSION
Our experimental data clearly indicate that C. roseus leaf powder is capable of attenuating the development of IR, compensatory hyperinsulinemia and dyslipidemia induced by fructose diet. These favorable effects might be due to different types of active principles acting individually or synergistically each with a single or a diverse range of biological activities. These results may lend further support to mount up evidence that C. roseus contains compounds which, if taken in sufficient quantities, could conceivably be beneficial in attenuation and prevention of insulin resistance. Further studies are required to establish the mechanism (s) underlying this effect of C. roseus. In conclusion, C. roseus leaf powder would seem useful as an adjuvant for the prevention and/or management of pre-diabetic state of insulin resistance and for subjects who need to increase insulin sensitivity.
6. ACKNOWLEDGEMENTS
We appreciate National Centre for Laboratory Animal Sciences, Hyderabad for the kind supply of fructose feed for experimental animals. Thanks are also due to Dr. Appa Rao, Mr. Ramesh Babu, Sri Venkateswara University, Tirupati for their help in insulin assay.
REFERENCES
- Bray, G.A., Nielsen, S.J. and Popkin, B.M. (2004) Consumption of high-fructose corn syrup in beverages may play a role in the epidemic of obesity. American Journal of Clinical Nutrition, 9, 537-543.
- Gaby, A.R. (2005) Adverse effects of dietary fructose. Alternative Medicine Review, 10, 294-306.
- Tordoff, M.G. and Alleva, A.M. (1990) Effect of drinking soda sweetened with aspartame or high-fructose corn syrup on food intake and body weight. American Journal of Clinical Nutrition, 51, 963-969.
- Thorburn, A.W., Storlein, L.H., Jemkins, A.B., Khouri, S. and Kraegen, E.W. (1989) Fructose induced in vivo insulin resistance and elevated plasma triglyceride levels in rats. American Journal of Clinical Nutrition, 49, 1155- 1163.
- Reddy, S.S., Karuna, R., Baskar, R. and Saralakumari, D. (2008) Prevention of insulin resistance by ingesting aqueous extract of Ocimum sanctum to fructose-fed rats. Hormone and Metabolic Research, 40, 44-49. doi:10.1055/s-2007-993218
- Reaven, G.M. and Banting, L. (1988) Role of insulin resistance in human disease. Diabetes, 37, 1595-1607. doi:10.2337/diabetes.37.12.1595
- Faure, P., Rossini, E., Wiernsperger, N., Richard, M.J., Favier, A. and Halimi, S. (1999) An insulin sensitizer improves the free radical defense system potential and insulin sensitivity in high fructose-fed rats. Diabetes, 48, 353-357. doi:10.2337/diabetes.48.2.353
- Faure, P., Rossini, E., Lafond, J.L., Richard, M.J., Favier, A. and Halimi, S. (1997) Vitamin E improves the free radical defense system potential and insulin sensitivity of rats fed high fructose diets. Journal of Nutrition, 127, 103-107.
- Hollenberg, N.K. (2003) Considerations for management of fluid dynamic issues associated with thiazolidinediones. American journal of medicine, 115, S111-S115. doi:10.1016/j.amjmed.2003.09.018
- Ozgen, U., Turkoz, Y., Stout, M., Ozugurlu, F., Pelik, F., Bulut, Y., Aslan, M., Ravindranath, Y. and Savasan, S. (2003) Degradation of vincristine by myeloperoxidase and hypochlorous acid in children with acute lymphoblastic leukemia. Leukocyte Research, 27, 1109-1113. doi:10.1016/S0145-2126(03)00098-5
- Nayak, B.S., Lexley, M. and Pinto, P. (2006) Catharanthus roseus flower extract has wound-healing activity in Sprague Dawley rats. BMC Complementary and Alternative Medicine, 6, 1-6. doi:10.1186/1472-6882-6-1
- Karuna, R., Ramesh, B., Sreenivasa, S. and Saralakumari, D. (2010) Antihyperglycemic activity of Catharanthus roseus leaf powder in streptozotocin-induced diabetic rats. Pharmacognosy Research, 2, 195-201.
- Nammi, S., Boini, M.K., Lodgala, S. and Behara, R.B.S. (2003) The fresh leaves of Catharanthus roseus Linn. Reduces blood glucose in normal and alloxan diabetic rabbits. BMC Complementary and Alternative Medicine, 2, 3-4.
- Chattopadhya, R.R. (1999) A comparative evaluation of some blood glucose lowering agents of plant origin. Journal of Ethanopharmacology, 67, 367-369. doi:10.1016/S0378-8741(99)00095-1
- Fazil, M.A., Mohammed, S.K., Safiullah, S.G., Sughra, S.M., Rasheed, S.A., Mehboob, S.A. and Ibrahim, M. (2010) Antidiabetic Activity of Vinca rosea Extracts in Alloxan-Induced Diabetic Rats. International Journal of Endocrinology, 1-6.
- Singh, S.N., Vats, P., Suri, S., Shyam, R., Kumari, M.M., Ranganathan, S. and Sridharan, K. (2001) Effect of an antidiabetic extract of a Catharanthus roseus on enzymatic activities in streptozotocin induced diabetic rats. Journal of Ethanopharmacology, 76, 269-277. doi:10.1016/S0378-8741(01)00254-9
- Rau, O., Wurglics, M., Dingermann, T., Abdel-Tawab, M. and Schubert-Zsilavecz, M. (2006) Screening of herbal extracts for activation of the human peroxisome proliferator-activated receptor. Pharmazie, 61, 952-956.
- Antia, B.S. and Okokon, J.E. (2005) Effect of leaf juice of Catharnathus roseus Linn on cholesterol, triglyceride and lipoproteins levels in normal rats. Indian Journal of Pharmacology, 37, 401-402.
- Yalow, R.S. and Berson, S.A. (1961) Immunoassay of plasma insulin in man. Diabetes, 10, 339.
- Pickavance, L.C., Tadayyon, M., Widdowson, P.S., Buckingham, R.E. and Wilding, J.P.H. (1999) Therapeutic index for rosiglitazone in dietary obese rats. Separation of efficacy and haemodiluation. British Journal of Pharmacology, 128, 1570-1576. doi:10.1038/sj.bjp.0702932
- Utley, H.G, Bernheim, F. and Hochstein, P. (1967) Effect of sulfhydryl reagents on peroxidation in microsomes. Archives of Biochemistry and Biophysics, 118, 29-32. doi:10.1016/0003-9861(67)90273-1
- Levine, R.L., Garland, D., Oliver, C.N., Amici, A., Climent, I., Lenz, A.G., Ahn, B.W., Shaltiel, S. and Stadtman, E,R. (1990) Determination of carbonyl content in oxidatively modified proteins. Methods in Enzymology, 186, 464-478. doi:10.1016/0076-6879(90)86141-H
- Ellman, G.L. (1959) Tissue sulphydryl. Archives of Biochemistry Biophysics, 82, 70-77. doi:10.1016/0003-9861(59)90090-6
- Lowry, O.H., Rosenbrough, N.J., Farr, A.L. and Randall, R.J. (1951) Protein measurement with the folin’s-phenol reagent. Journal of Biological Chemistry, 193, 265-275.
- Soon, Y.Y. and Tan, B.K.H. (2002) Evaluation of the hypoglycemic and antioxidant activities of Morinda officinalis in streptozotocin-induced diabetic rats. Singapore Medical Journal, 43, 77-85.
- Beers, R.F. and Sizer, J.W. (1952) Spectrophotometric method for measuring breakdown of hydrogen peroxide catalase. Journal of Biological Chemistry, 195, 133-140.
- Rotsruck, J.T., Pope, A.L., Ganther, H.E., Swanson, A.B., Hafeman, D.G. and Hoekstra, W.G. (1973) Slenium: Biochemical role as a component of glutathione peroxidase. Science, 179, 588-590. doi:10.1126/science.179.4073.588
- Habig, W.H., Pabst, M.J. and Jakoby, W.B. (1974) Glutathione-S-transferases. The first enzymatic step in mercapturic acid formation. Journal of Biological Chemistry, 249, 7130-7139.
- Pinto, R.E. and Bartley, W. (1969) The effect of age and sex on glutathione reductase and glutathione peroxidase activities and on aerobic glutathione oxidation in rat liver homogenates. Biochemical Journal, 112, 109-115.
- Goldstein, B.J. (2002) Insulin resistance as the core defect in type 2 diabetes mellitus. American Jornal of Cardiology, 90, 3-10. doi:10.1016/S0002-9149(02)02553-5
- Kaiyala, K.J., Prigeon, R.L., Kahn, S.E., Woods, S.C. and Schwartz, M.W. (2000) Obesity induced by a high rat diet is associated with reduced brain insulin transport in dogs. Diabetes, 49, 1525-1533. doi:10.2337/diabetes.49.9.1525
- Vos, P.D.E., Lefebvre, A.M., Miller, S.G., Guerre-Millo, M., Wong, K., Saladin, R., Hamann, L.G., Staels, B., Briggs, M.R. and Auwerx, J. (1996) Thiozolidinediones repress ob gene expression in rodents via activation of peroxisome proliferators-activated receptor gamma. Journal of Clinical Investigation, 98, 1004-1009. doi:10.1172/JCI118860
- Randle, T.J. (1998) Regulatory interactions between lipids and carbohydrates: The glucose fatty acid cycle after 35 years. Diabetes Metabolism Review, 14, 263-283. doi:10.1002/(SICI)1099-0895(199812)14:4<263::AID-DMR233>3.0.CO;2-C
- Kelly, G.L., Allan, G. and Azhar, S. (2004) High dietary fructose induces a hepatic stress response resulting in cholesterol and lipid dysregulation. Endocrinology, 145, 548-555. doi:10.1210/en.2003-1167
- Evans, J.L., Goldfine, I.D., Maddux, B.A. and Grodsky, G.M. (2003) Are oxidative stress-activated signaling pathways mediators of insulin resistance and beta-cell dysfunction?. Diabetes, 52, 1-8. doi:10.2337/diabetes.52.1.1
- Itani, S.I., Ruderman, N.B., Schmieder, F. and Boden, G. (2005) Lipid-induced insulin resistance in human muscle is associated with changes in diacylglycerol, proteinkinaseC, and IB-alpha. Diabetes, 51, 2005-2011. doi:10.2337/diabetes.51.7.2005
- Kocic, R., Pavlovic, D., Kocic, G. and Pesic, M. (2007) Susceptibility to oxidative stress, insulin resistance, and insulin secretory response in the development of diabetes from obesity. Vojnosanitetski Pregled, 64, 391-397.
- Ceriello, A., Giugliano, D., Quatraro, A., Donzella, C., Dipalo, G. and Lefebvre, P.J. (1991) Vitamin E reduction of protein glycosylation in diabetes: New prospect for prevention of diabetic complications? Diabetes Care, 14, 68-72. doi:10.2337/diacare.14.1.68
- Datta, K., Sinha, S. and Chattopadhyay, P. (2000) Reactive oxygen species in health and diseases. National Medical Journal of India, 13, 304-310.
- Evans, J.L. and Goldfine, I.D. (2000) α-Lipoic acid: A multi-functional antioxidant that improves insulin sensitivity in patients with type 2 diabetes. Diabetes Technology and Therapeutics, 2, 401-413. doi:10.1089/15209150050194279