Agricultural Sciences
Vol.3 No.2(2012), Article ID:18382,14 pages DOI:10.4236/as.2012.32022
Nutraceutical properties of honey and pollen produced in a natural park
![]()
Honey Research Center, Department of Biology, University of Rome “Tor Vergata”, Rome, Italy; *Corresponding Author: canini@uniroma2.it
Received 19 November 2011; revised 23 December 2011; accepted 30 January 2012
Keywords: honey; nutraceutical content; environmental monitoring; melissopalynology; residue contamination
ABSTRACT
Honey bees and bee products are optimal monitors of the environmental quality; experimental beehives were placed in strategic places of Gran Sasso-Monti della Laga Park. Pollen and honey, produced in this protected area, were analyzed in order to demonstrate their good quality respect to those commercials. Physico-chemical parameters (water content, hydroxymethylfurfural), total flavonoid and phenolic contents and residue analysis (heavy metals, pesticides, tetracycline, sulfathiazole) were carried and evidenced their high quality. Moreover, melissopalynological analysis allowed us to establish a floristic census within the different places of the park. Data show that bee products are good quality, contain high levels of phenolics and flavonoids and show absence of pesticides and low concentration level of heavy metals and antibiotics. Due to this the human impact, even in protected areas, cannot be neglected; similarly environmental contamination by wild livestock was seen in different monitored sites.
1. INTRODUCTION
Honey is a natural complex produced by honeybees (Apis mellifera L.) from the nectar of flowers as well as from honeydew, usually produced by plant-striking insects. Honey components like carbohydrates, water, traces of organic acids, enzymes, amino acids, pigments, pollen and wax derive from the maturation of the nectar, while some others are added by the bees. During the foraging, bees can capture nectar, pollen, propolis from the buds of various botanic species, honeydew from the aphids of infested plant and water from wells and irrigation ditches. When they return to the hive with the precious cargo, nectar and pollen are stored, honey is made, propolis is used for bacterial protection of the hive and larvae are fed. Because of these insects, through their activity, may cover an immense area around the beehive (about seven square kilometers) and can take a lot of ambient samples (directly or casually picking up airborne particles with its body hairs), they are considered good environmental bioindicators [1,2]. Bees are highly sensitive to the quality of the areas in which they live: agricultural pesticides, human and livestock antibiotics, fungicides, heavy metals, radionuclides and other pollutants present in the environment can induce high mortality in the beehive. Unfortunately, some contaminants result directly from bad beekeeping practices: acaricides to prevent varroasis and antibiotics to control bee brood diseases, in particular tetracycline, sulfonamides and tylosin are used to treat bee pest [3]. All these environmental contaminants can be detected in bee products, by scientific methods, and used to individuate polluted geographical areas [4-6]. On the other hand, beehive study can give us also information about the floral composition of the space covered by bees by the melissopalynological analysis that can identify botanical species present in these areas. The present study aims to demonstrate the good quality of honey produced from protected areas and natural parks with respect to the populated areas, by analyzing the presence of contaminants, its high nutritional levels and the optimal values of its physicochemical parameters. Another object of this work is the use of melissopalynological analysis as a method for establishing a floristic census of natural environment. Parks and natural areas represent ideal sites for installing experimental beehives: high quality honey can be produced in these places, because they are less exposed to pollution than other areas, and specific studies of the environmental botanical composition can be conducted, because of their abundance in plant species. In fact, honeybees are usually the most effective pollinators of numerous crops and wild plants which are not wind-pollinated; the visitation of flowers by pollinating insects is crucial for the reproduction and conservation of almost 80% of angiosperm plant species [7]. Declines in the number of managed beehives in the United States over the past 50 years, [8] in conjunction with recent losses due to Colony Collapse Disorder [9], have raised concerns about the development and the sustainability of the global agriculture. The extent and causes of bee decline can be attributed to habitat loss and fragmentation, climate change, non-native species, pesticides, genetically modified crops and parasite infection from the fungal pathogen Nosema virus [10].
2. MATERIALS AND METHODS
2.1. Beekeeping Materials
Experimental beehives were installed in strategic areas of Gran Sasso Natural Park and “Monti della Laga” to cover the whole region of Abruzzo (Central Italy). The project lasted for three years: 2008, 2009 and 2010. Overall seventy-seven samples were collected (Table 1). The honey samples were obtained by beekeepers that took part to this monitoring project based on good apicultural practices. All samples were subjected to chemical-physical, melissopalynological and residual parameters analysis by the Honey Research Centre of the University of Rome “Tor Vergata”.
2.2. Physico-Chemical Analysis
Analytical results of physico-chemical analysis, obtained according to the Italian Official Methods for the Analysis of Honey [11] are summarized in Tables 2 and in 3. For each parameter the mean value of three analyses and the respective standard deviation are reported. The determination of moisture was ascertained by refractometry, using an Abbe refractometer. All measurements were performed at 20˚C; after waiting for 6 minutes for instrument equilibration, the corresponding moisture percentage (g/100g honey) of honey sample was obtained with respect to a standard table. The hydroxymethylfurfural (HMF) was carried out to the UNI directive 10934 [12] using the spectrophotometric method. In brief, 5 g of each honey sample was transferred into a 50 mL tube, with 500 µL of Carrez reagents (I and II), and diluited to 100 mL with water. If necessary, alcohol may be added to suppress surface foam. With a clarified honey solution containing 0.2% (m/v) sodium bisulfite as a reference and a similar solution without bisulfite as a sample, a difference spectrum was obtained which represented only the HMF in the sample, without the interfering absorption of the honey. Absorbance was determined at 284 and 336 nm in a 1 cm quartz cuvette in a Cary 50 Bio UvVisible Spectrophotometer (Varian). HMF contents, expressed as mg/kg, were calculated from the equation HMF = (A284 − A336) × F, where A284, A336 are the absorbance readings and F = 149.7 is HMF molecule absorption constant.
2.3. Melissopalynological Analysis
The melissopalynological analysis was carried out as described by Van Der Ohe et al. 2004 [13]. Ten grams of honey sample were dissolved in 20 mL of distillated water. The solution was centrifuged at 1000 g for 5 minutesand the supernatant was removed. The entire sediment
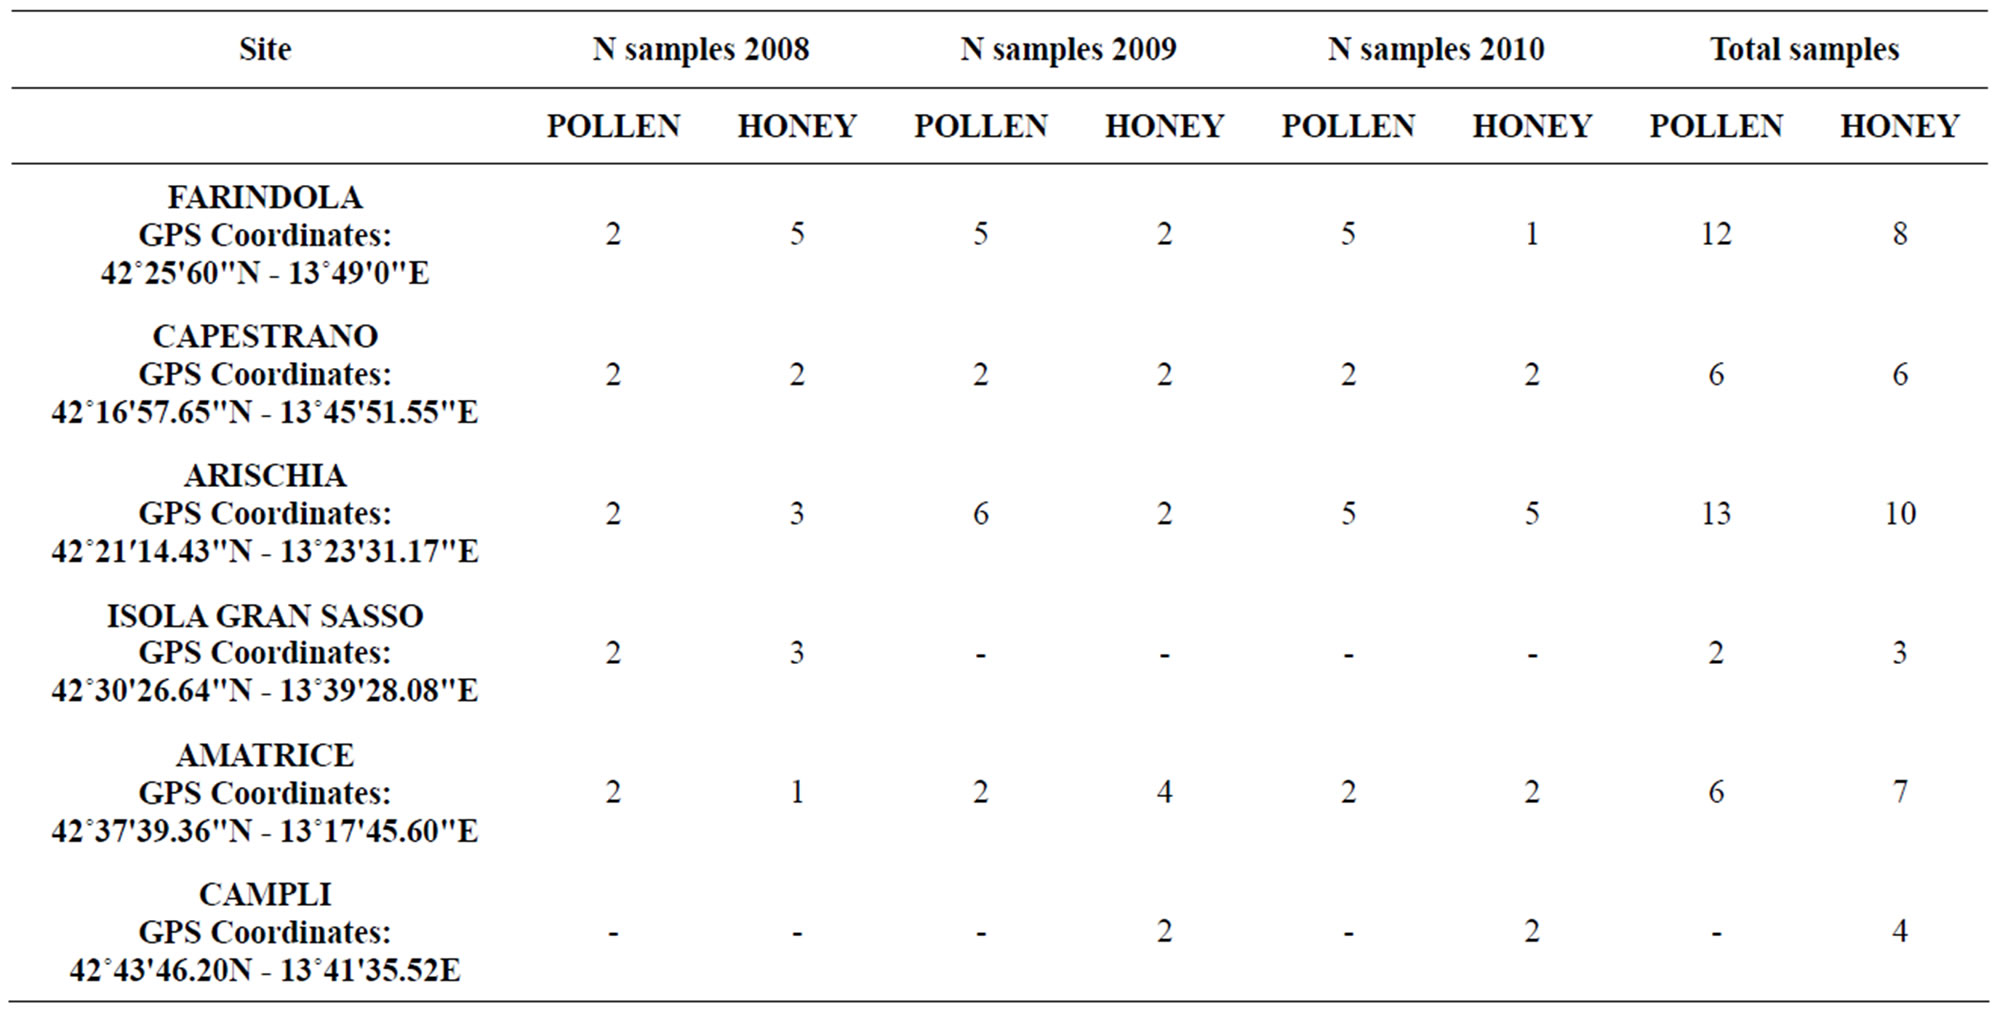
Table 1. Number of samples received and beehive location in various city with sampling year.
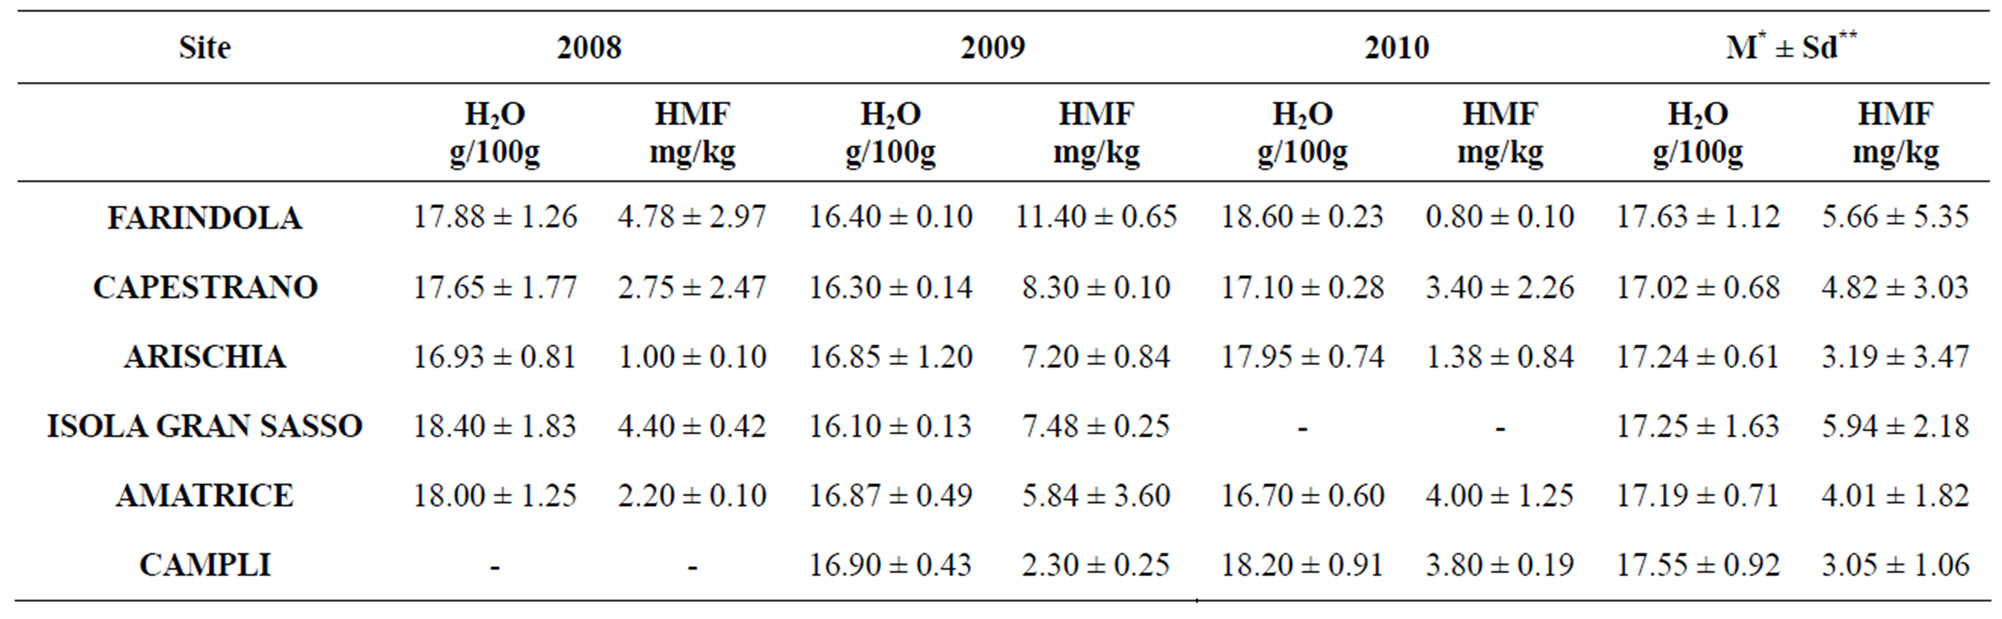
Table 2. Moisture and HMF contents (Mean value* ± Standard deviation**) of the various honey samples.
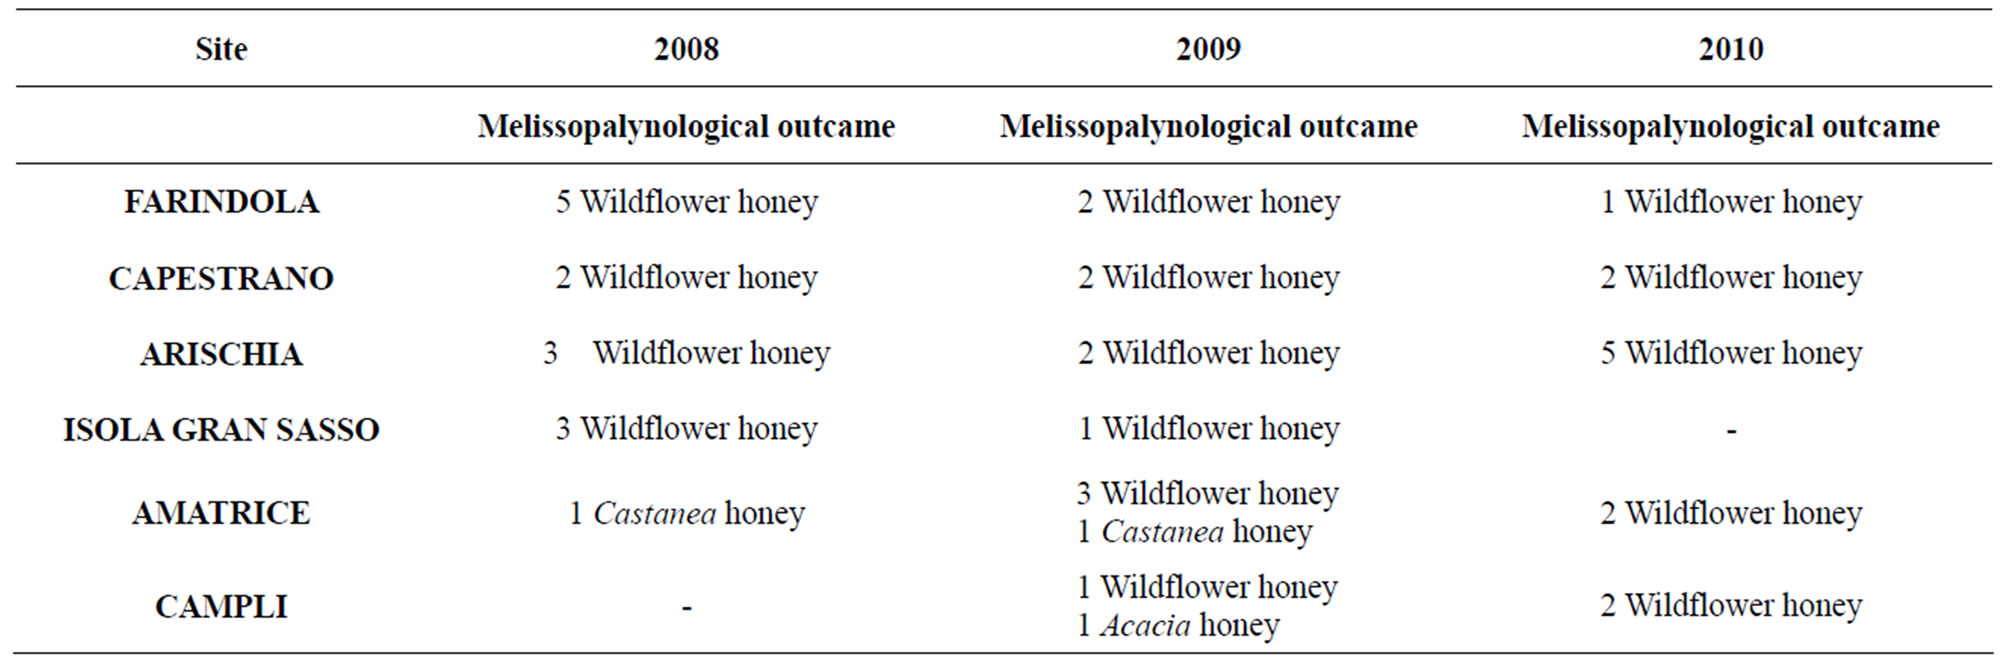
Table 3. Melissopalynological results of honey samples in the years 2008, 2009, 2010.
was transferred onto a microscope slide; pollen was colored with glycerine jelly and 0.1% basic fuchsin. Pollen was identified by optical microscopy (Leica DME). The pollen sample were also dissolved in low volume of water and directly assembled onto a microscope slide, stained and analyzed in the same way of honey-ones.
2.4. Nutraceutical Estimation: Total Flavonoid and Phenolic Contents
Concentrations of total flavonoids and total phenolics were measured using Heimler et al. 2005 [14] and Meda et al. 2004 [15] modified methods. In brief, honey and pollen samples (5 g) were diluted with 50 mL of de-ionized water and sonicated in an ice bath for 20 minutes. To 0.25 mL of honey solution, 75 µL of 0.05 g/mL Sodium nitrite, 0.15 mL of freshly prepared 0.1 g/mL aluminum chloride and 0.5 mL of Sodium hydroxide 1 M were added. The final volume was adjusted to 2.5 mL with de-ionized water. Sample absorption readings at 510 nm were taken after 10 minutes with respect to a water blank sample. Total flavonoid content was determined using a calibration curve obtained with quercetin (0 - 200 mg/L) as standard and expressed as mg quercetin equivalent (QE) kg−1 honey. On the other hand, Folin-Ciocalteu method was used to determine total phenolic amount. An aliquot of 0.5 mL of honey solution (prepared as described above) was mixed with 2.5 mL of 0.2 N Folin-Ciocalteu reagent for 5 minutes. Then, 2 mL of 75 g/L Sodium carbonate was added. The sample was incubated at room temperature for 2 hours in the dark. Absorbance of the mixture was measured at 760 nm with respect to a methanol blank sample. Gallic acid (0 - 200 mg/L) was used as standard to produce the relative calibration curve. Total phenolic content was expressed as mg gallic acid equivalent (GAE) kg−1 honey. A UVIKON 860 UV-visible spectrophotometer (Kontron, Germany) was used for the absorbance measurements.
2.5. Total Protein Contents
The quantification of protein content was performed according to the Bradford protein assay [16]. A stock standard solution of 2 mg/mL was prepared in distilled water and a calibration curve in UV-visible spectrophotometer UVIKON 860 (Kontron, Germany) was carried out by serial dilutions. Honey (5 g) and pollen (1 g) samples were dissolved in 10 mL of Phosphate Buffered Saline (PBS) pH 7.4 overnight at 4˚C with shaking. Samples were then centrifuged at 14,000 rpm for 15 minutes at 4˚C with ultracentrifuge (Beckman Coulter Optima XL-100 K); 60 µL of distilled water, 15 µL of hydrochloric acid 0.1 N, 10 µL of PBS pH 7.4 and 3.5 mL of Bradford Dye Reagent were added 20 µL of supernatant extract. Absorption readings at 595 nm were taken after 5 minutes with respect to blank sample. Total protein content was determined using a calibration curve with BSA (0 - 100 mg/L) as standard and expressed by conversion as mg protein in g honey/pollen.
2.6. Residues Analysis
2.6.1. Tetracycline Analysis
Tetracycline (TC) was analyzed using Huq et al. 2006 [17] and Oka et al. 1998 [18] modified method. In brief, honey samples (10 g) were melted in 25 mL of McIlvane-EDTA buffer, pH 4.00 (11.8 g citric acid, 13.72 g Na2HPO4·2H2O, 37.2 g Na2EDTA·2H2O). Solid-phase extraction was carried out with the combination of DSCC18 and MCAC cartdriges. DSC-C18 cartridge was conditioned with 4 mL of methanol and 4 mL of 0.1% trifluoroacetic acid (TFA) while MCAC cartridge was prepared with 1.5 mL of Sepharose and conditioned with 2 mL of 0.1% TFA. Honey sample was loaded into the first cartridge, washed with 4 mL of 0.1% TFA and eluted with 4 mL of methanol; then, it was loaded into the second cartridge, washed with 2 mL of 0.1% TFA and then with 2 mL of methanol. Tetracycline were eluted with 3 mL of McIlvane-EDTA buffer pH 4.00. The chromatographic analysis was performed using an HPLCDAD Shimadzu (Model SPD-M20A IV DD). Separations were carried out in a Hamilton HxSil C18 column (250 × 4.6 mm, 5 µm), using a mobile phase of formic acid 0.2% (solvent A) and methanol (solvent B). A gradient was used starting with 90% of solvent A for 3 minutes and with solvent B increasing to 75% in 4 minutes. A flow rate of 0.7 mL/min and an injection of 20 µL was employed [19]. Tetracycline stock standard solution of 1 mg/mL was prepared in methanol and a calibration curve in HPLC-DAD was carried out by serial dilutions (100, 10, 1, 0.1 and 0.01 µg/mL). Molecules have been detective at λ = 365 nm.
2.6.2. Sulphatiazole Analysis
The sulfathiazole (STZ) analysis was carried out in accordance with Martel and Zeggane 2003 [20] method, after some modifications. Honey sample (5 g) was diluted with 5 mL of hydrochloric acid 1 M and then dissolved in agitation for 30 minutes at room temperature. Sample was centrifuged at 13000 rpm for 30 minutes at 20˚C. 0.5 mL of supernatant was derivatized with 0.45 mL of sodium acetate trihydrate 1.25 M, 0.5 mL of sodium citrate buffer pH 3.00 (30 mL hydrochloric acid 0.1 M and 18 mL distilled water; adjust the pH to 3.00 with sodium citrate solution) and 0.3 mL of fluram 0.2% (w/v in acetone). Fluram is a fluorogenic reagent that promotes the formation of sulfathiazole pyrrole-derivatives that is relevable on fluorescence (λexc 405 nm e λemis 495 nm). The chromatographic analysis was performed using an HPLC-Fluorescence Shimadzu (Model RF-10AXL); separation was carried out in a Hamilton PRP-1 column (150 × 4.1 mm, 10 µm), using a mobile phase of 2% glacial acetic acid (solvent A) and acetonitrile (solvent B) in isocratic conditions of 70% A: 30% B. A stock standard solution (1 mg/mL) of sulphathiazole was prepared in acetonitrile, and a calibration curve in HPLC was carried out by serial dilutions (100, 10, 1, 0.1 and 0.01 µg/mL).
2.6.3. Pesticides Analysis
Pesticides (Amitraz, Coumaphos and Chlorfenvinphos) were analyzed according to Martel and Zeggane 2002 [21] modified method. Honey sample (0.5 g) was melted in 5 mL of phosphate buffer 1 M pH 6.00 and then sonicated for 10 minutes. Fluid sample was purified with a solid phase extraction: DSC-C18 column was conditioned with 4 mL of methanol and 2 mL of phosphate buffer 1 M pH 6.00. Sample was loaded and slowly eluted (1 mL/min), then cartridge was washed with 5 mL of tetrahydrofuran 10% in phosphate buffer 1 M pH 6.00 and finally the investigated molecules were recovered with 2 mL of tetrahydrofuran. Extract was dryed with a concentrator (Savant Speed Vac Concentrator, Abel Electronics) and resuspended in 200 μL of acetonitrile. Chromatographic analysis was performed using an HPLC-DAD Shimadzu (Model SPD-M20A IV DD). Separations were carried out on a Hamilton HxSil C18 column (250 × 4.6 mm, 5 µm), using a mobile phase of triethylamine (TEA) buffer pH 6.10 (solvent A) and acetonitrile (solvent B). A gradient was used starting with 70% of solvent A for 3 minutes, and with solvent B increasing to 100% in 23 minutes. A flow rate of 1 mL/min and an injection of 20 µL was employed. A stock standard solution of 1 mg/mL was prepared in acetonitrile and a calibration curve in HPLC-DAD was carried out by serial diluitions (100, 10, 1, 0.1 and 0.01 µg/mL). Molecules have been detected at λ = 289 nm – 313 nm - 254 nm respectively for Amitraz, Coumaphos and Chlorfenvinphos.
2.6.4. Heavy Metals Analysis
Heavy metals analysis as Cadmium (Cd), Copper (Cu), and Lead (Pb) were analyzed according to Perkin Elmer Corporation (1982) modified method [22]. Ash contents were determined by heating 10 g of honey at first at 100˚C, to decrease the moisture amount, and then at 500˚C, to dry up sample [23]. Three selected metals Copper (Cu), Cadmium (Cd), and Lead (Pb) were measured using Perkin Elmer 3110 Atomic Absorption Spectrophotometer (AAS). Solutions containing Cd, Cu, and Pb ions were obtained by dissolution of their ash in 10 mL percloric acid (60%) and nitric acid (65%) (Merck Darmstadt, Germany). Cd, Cu, and Pb were determined directly in the ash solution by atomic absorption spectrometer (Perkin Elmer 3110 AAS). Calibration curves were prepared using dilutions of stock solutions. Honey samples were read three times and the mean values and the relative standard deviations were computed. Following wavelengths were used for the studied metals: copper 324.8 nm, cadmium 228.8 nm, and lead 232.0 nm. Measurements were made without delay after the solvent extraction.
3. RESULTS
3.1. Physico-Chemical Analysis
The analytical results of physico-chemical analysis are summarized in Table 2. For each parameter the mean value of three analyses and the respective standard deviation are reported. All samples have optimal values, well below the limit (HMF = 40 mg/kg and H2O = 20 g/100g).
3.2. Melissopalynological Analysis
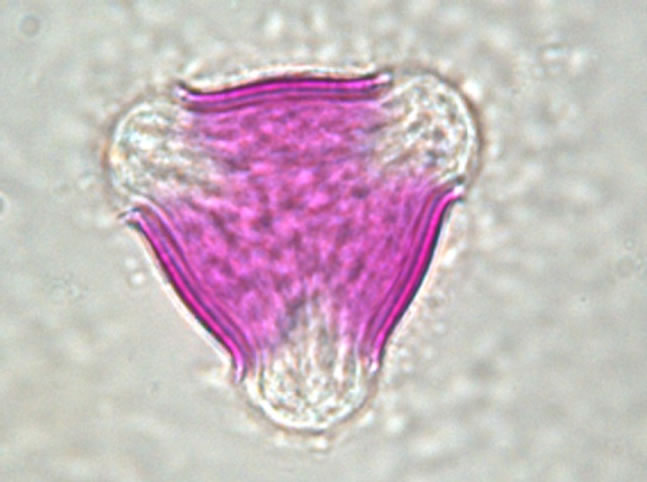
The determination of honey botanical origin is based on the relative frequencies of nectar species pollen types (Figure 1). In general, honey is considered monofloral
 (a)
(a)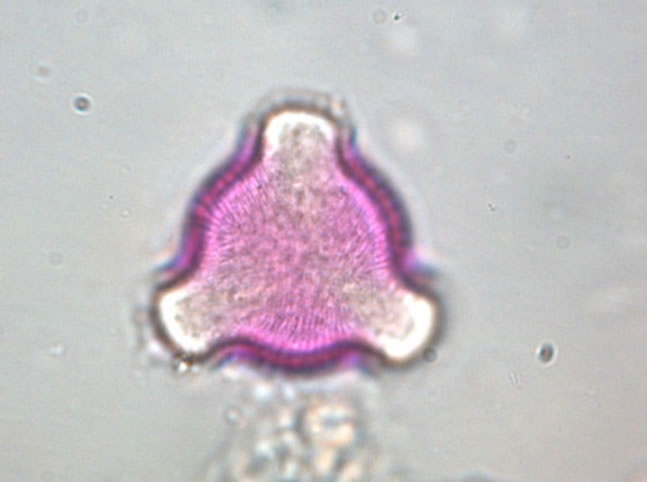 (b)
(b)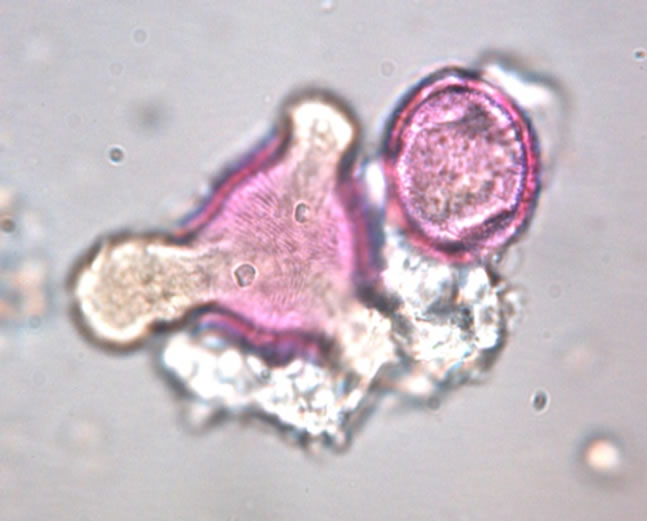 (c)
(c)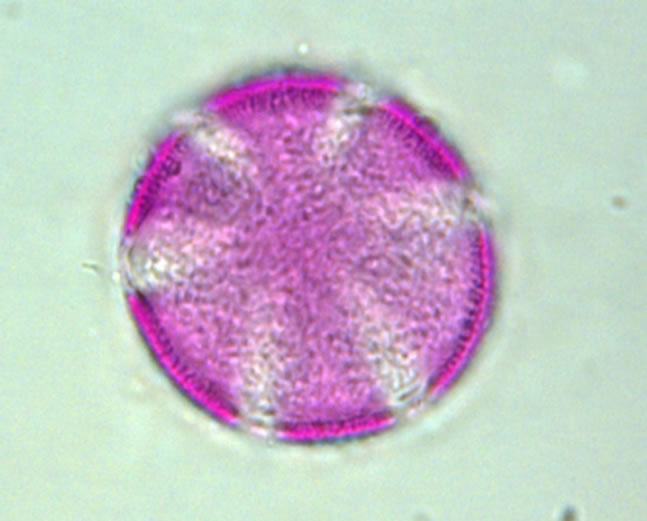 (d)
(d)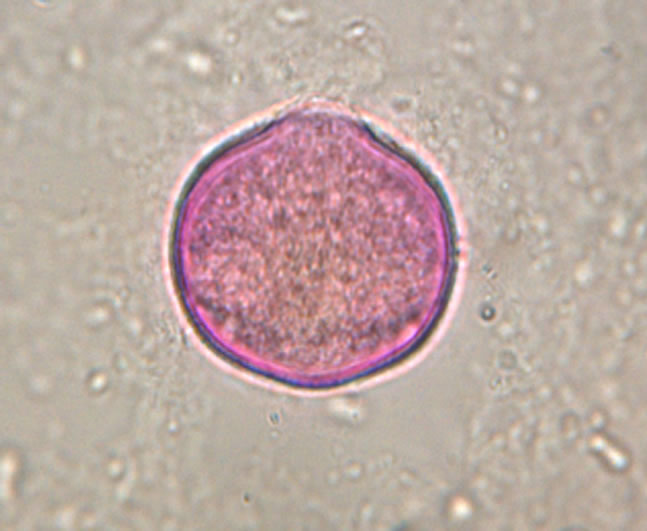 (e)
(e) (f)
(f)
Figure 1. Examples of pollen discovered in honey. (a) Prunus sp.; (b) Rubus sp.; (c) Rosaceae sp.; (d) Satureja montana; (e) Trifolium repens; (f) Onobrychis viciifolia.
when the relative frequency of the pollen of one taxon exceeds 45%; it is considered honeydew if the ratio of the number of honeydew elements with respect to pollen grains exceeds 3 [13]. Melissopalynological analysis confirmed the floral origin of all studied honeys. For all samples, five classes of relative frequency were considered: 1) dominant pollen grains with a frequency > 45%; 2) accompanying pollen with a frequency below 16% - 45%; 3) important isolated pollen with a frequency below 4% - 15%; 4) rare pollen with a frequency < 4%; and 5) non-nectar pollen. Among all the analyzed samples 93.94% are wildflower honeys and the remainder 6.06% are monofloral Castanea honeys. Melissopalynological analysis was used to obtain the floristic list of the nature areas. The results are showed in the Tables 3-5.
3.3. Nutraceutical Estimation: Total Flavonoid, Phenolic and Protein Contents
In honey samples, total flavonoid content (mg of QE/kg of honey) varied from 226.59 ± 11.33 mg/kg, found in Capestrano’s sample, to 27.40 ± 1.37 mg/kg, estimated in Campli’s sample, with an average value of 127.94 ± 31.64 mg/kg. Total phenols content (mg of GAE/kg of honey) varied from 341.23 ± 17.06 mg/kg to 86.00 ± 4.30 mg/kg, both found in Amatrice’s honeys, with an average value of 199.92 ± 40.31 mg/kg (Figure 2). In pollen samples total flavonoid content (mg of QE/g of pollen) varied from 510.00 ± 25.50 mg/g to 54.00 ± 2.70 mg/g, measured in Capestrano’s samples, with an mean value of 168.29 ± 60.64 mg/g. In these samples, total phenols content (mg of GAE/g of honey) was estimated from 598.00 ± 29.90 mg/g to 168.00 ± 8.40 mg/g, calculated in Arichia’s samples, with an average of 374.56 ± 40.12 mg/g (Figure 3). Protein amount in pollen samples changed in the range between 71.82 ± 3.59 mg/g, measured in Capestrano’s sample, and 2.52 ± 0.13 mg/g, estimated in Farindola’s sample, with an average value of 20.58 ± 10.50 mg/g (Figure 4).
3.4. Determination of Residues
The identification of residues was based on the comparison of retention time and absorbance spectrum of standards compared with data obtained from sample analysis. Quantification of residues was evaluated by measuring the peak area of the target analytes with respect to the internal standard control; this ratio was fitted onto the linear calibration curves traced for each standard solution. Results are showed in Figures 5 and 6, and Table 6. Pesticides are absent in all samples; 2.60% of samples were positive for tetracycline, 22.10% of them resulted positive for sulphathiazole and 27.30% showed positivity to heavy metals (Figures 5 and 6). Analysis showed that 52% of samples were positive for residues. 27.30% of samples resulted positive for heavy metals (among them 44.40% Pb, 16.70% Cd and 38.90% Cu); in particular, 16.70% was contaminated by only one metal, 27.8% by two metals and 5.6% was positive for three analyzed metals (Table 6). Finally, we obtained that
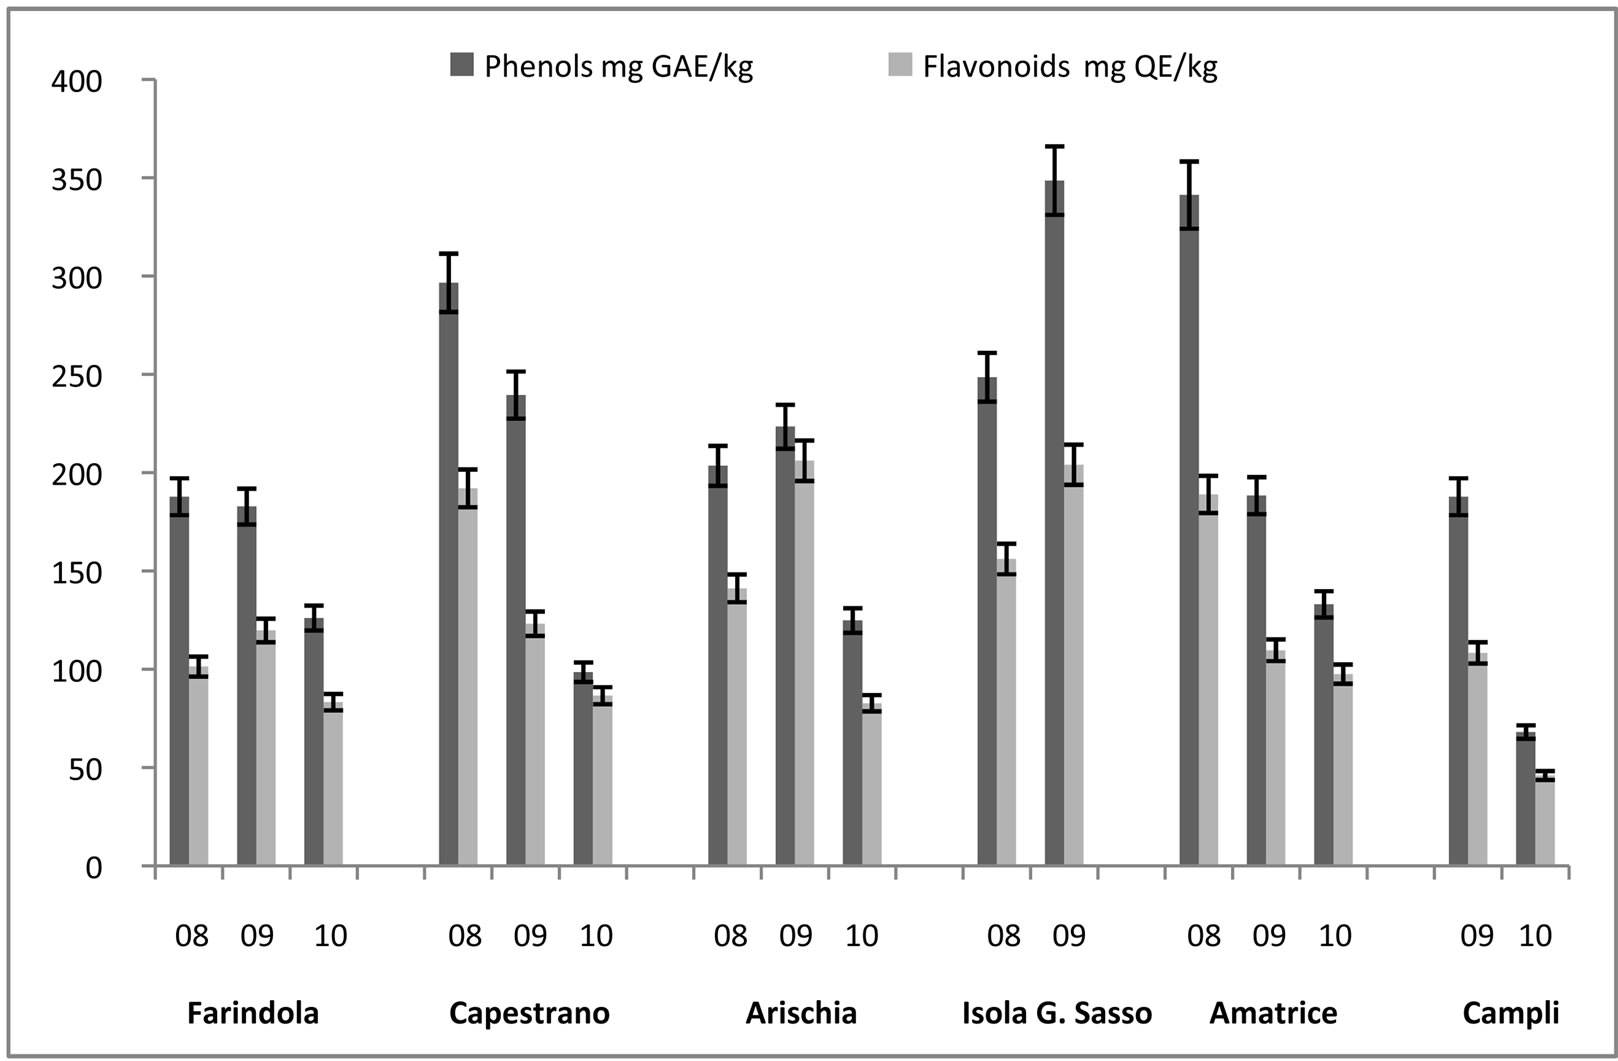
Figure 2. Total Phenols (mg GAE/kg) and Flavonoids (mg QE/kg) in honey samples in the years 2008-2010.
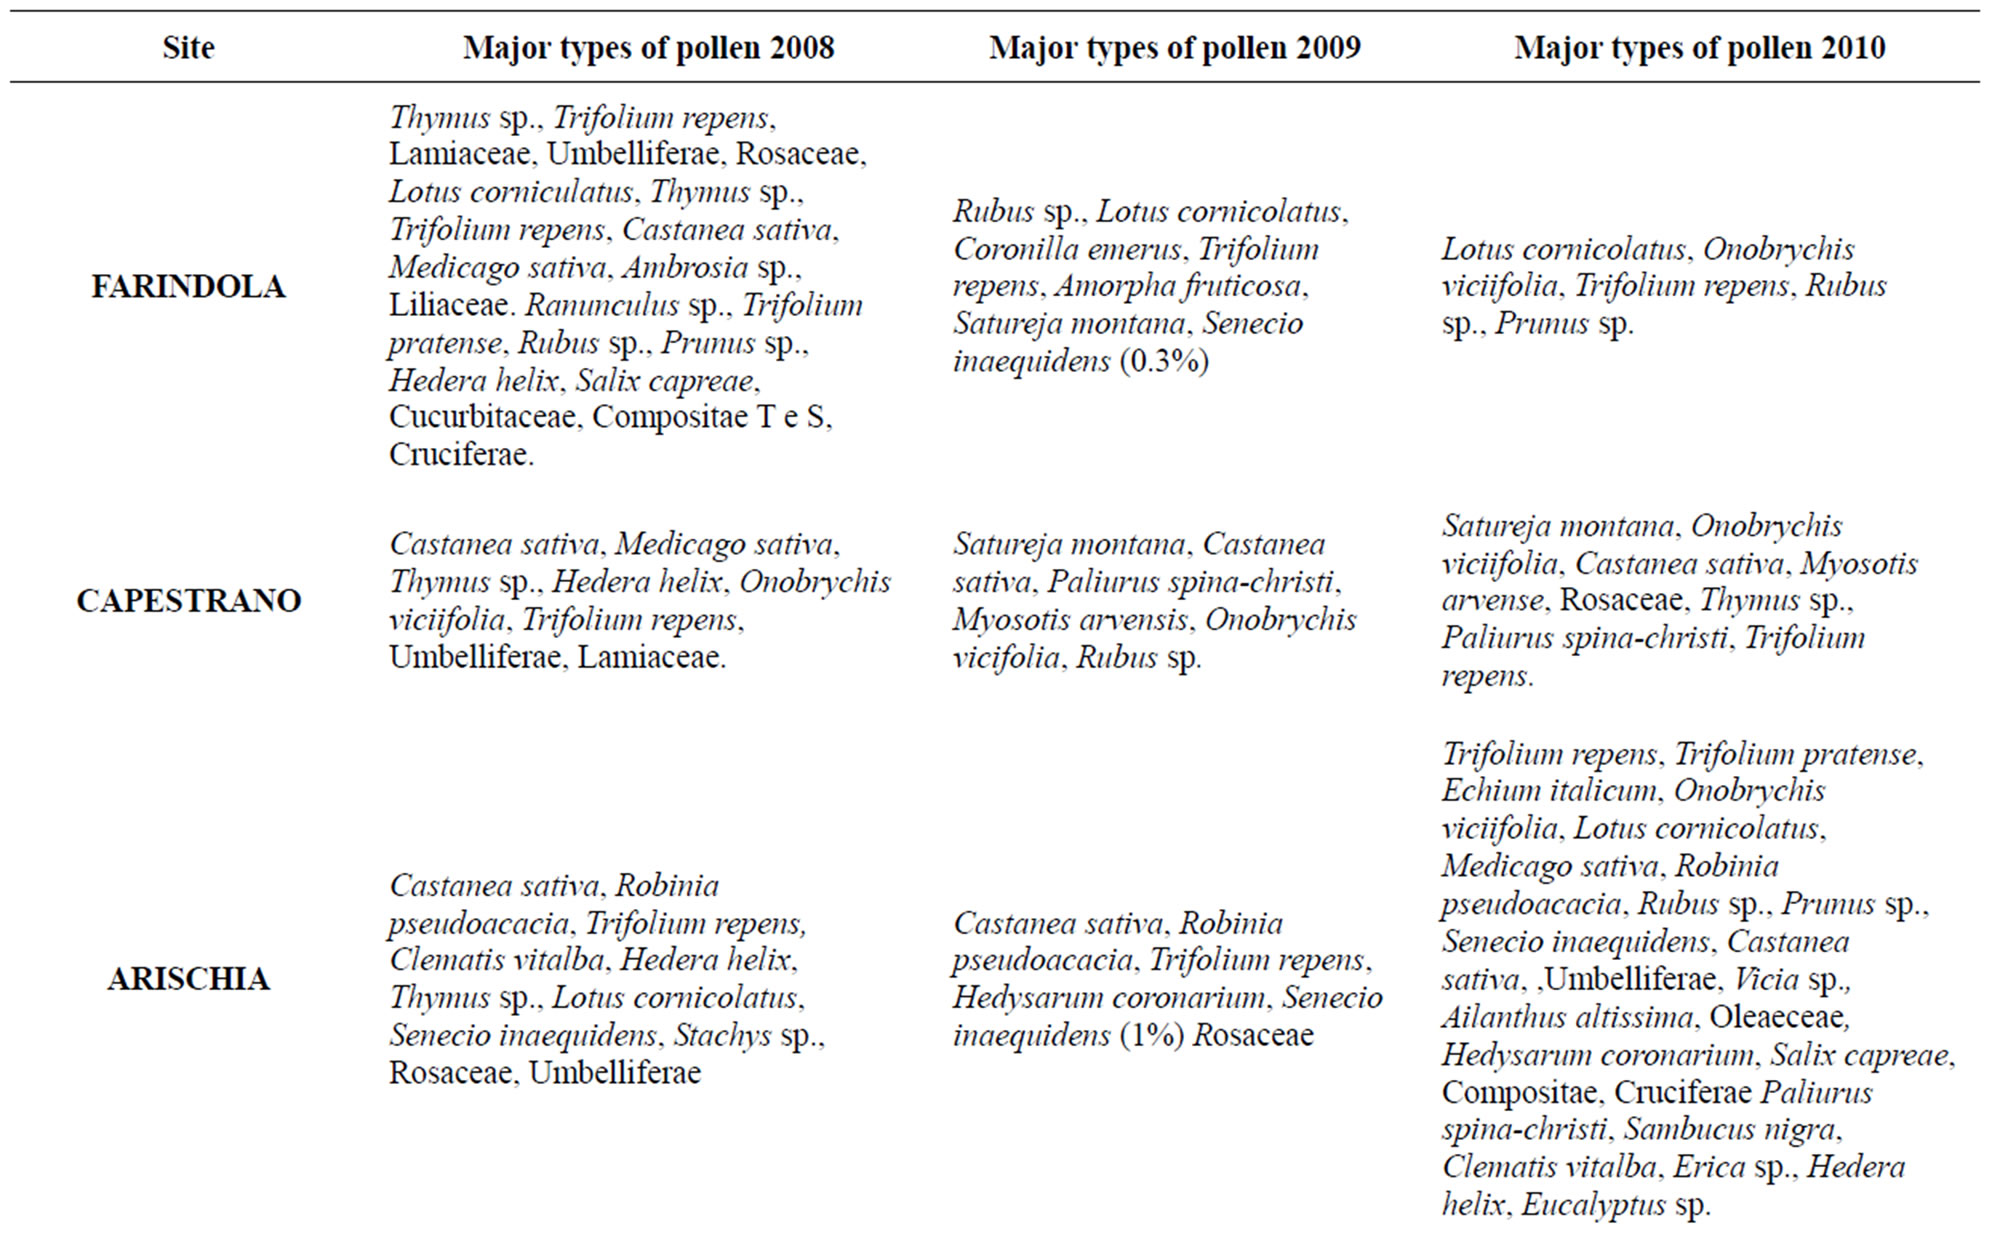
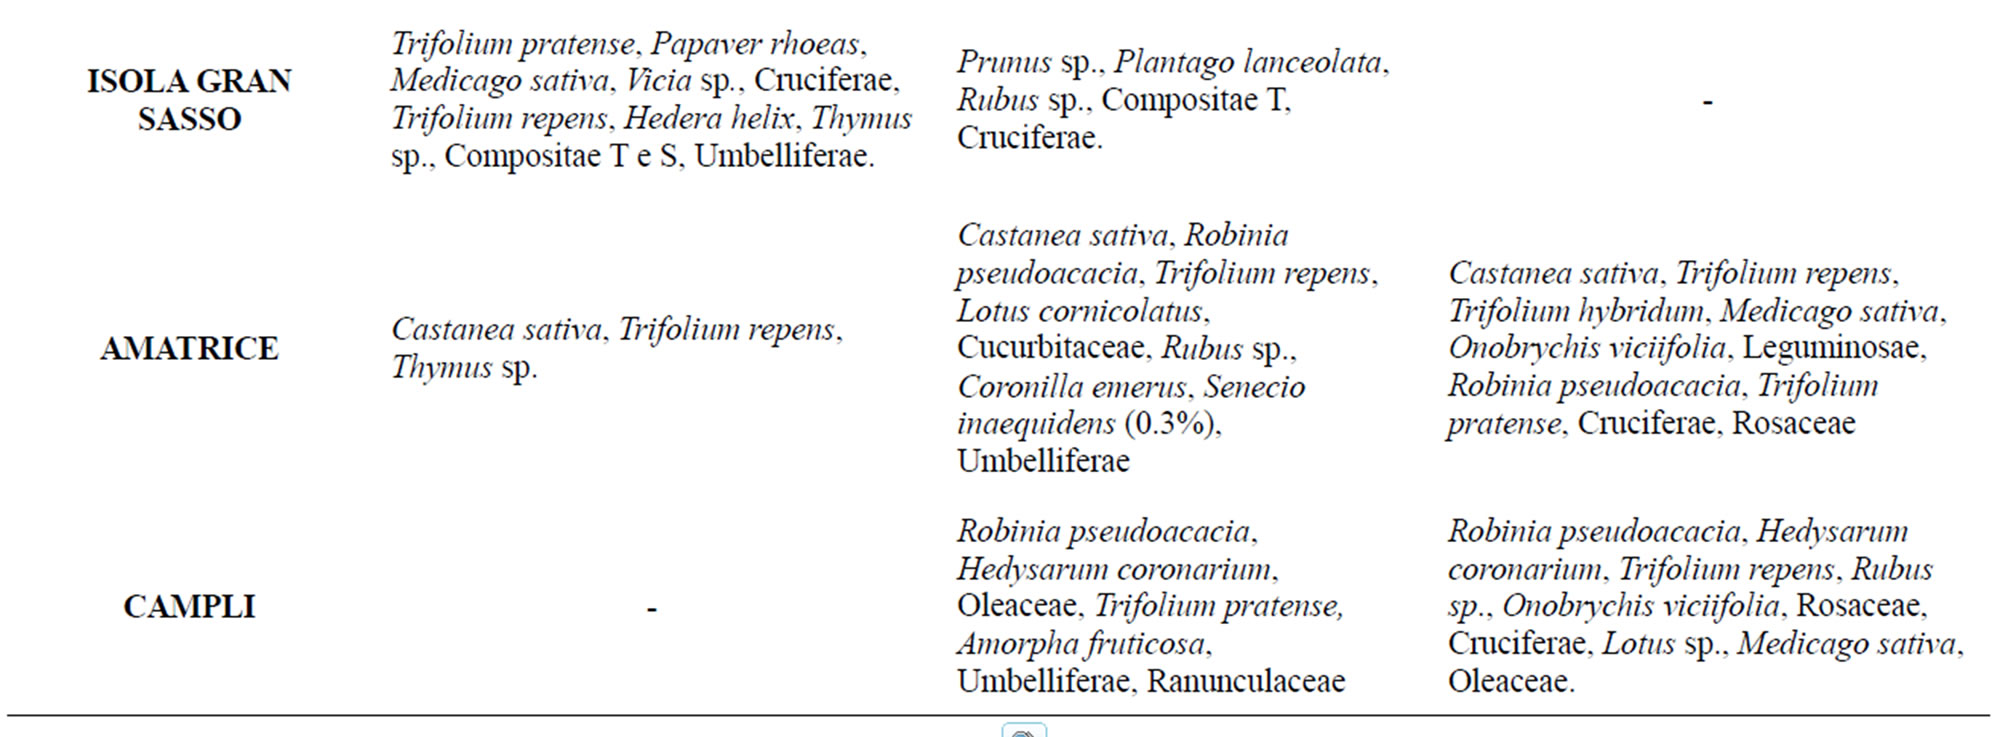
Table 4. Typologies of pollen recovered in honey samples collected in the years 2008, 2009, 2010.
24.7% of samples were positive for antibiotics (22.1% by sulphatiazole and 2.6% by tetracycline). In figures 7 and 8 we can see the comparison results of Gran Sasso Natural Park and “Monti della Laga” to those obtained during 2009 and 2010, according to the directives of 1234/EX DECREE 797. Data show how the percentage of all residues is substantially lower in samples monitored in the Gran Sasso Natural Park and “Monti della Laga” compared to samples belonging to the monitoring ex 797: Sulphathiazole 22.10% against 43.20%, tetracycline 2.60% against 10.20%, pesticides 0.00% against 5.00%, heavy metals 2.60% against 30.30% (Figure 7). Similarythe average amount of secondary metabolites is higher in the Gran Sasso Natural Park honeys than regional honeys; phenols 199.92 mg GAE/kg than 127.94 mg GAE/kg and flavonoids 126.83 mg QE/kg than 86.57 mg QE/kg (Figure 8).
4. DISCUSSION
Honey bees are good biological indicators because they indicate the chemical impairment of the environment they live in through two signals, that may be detected by laboratory analyses: the high mortality (in the
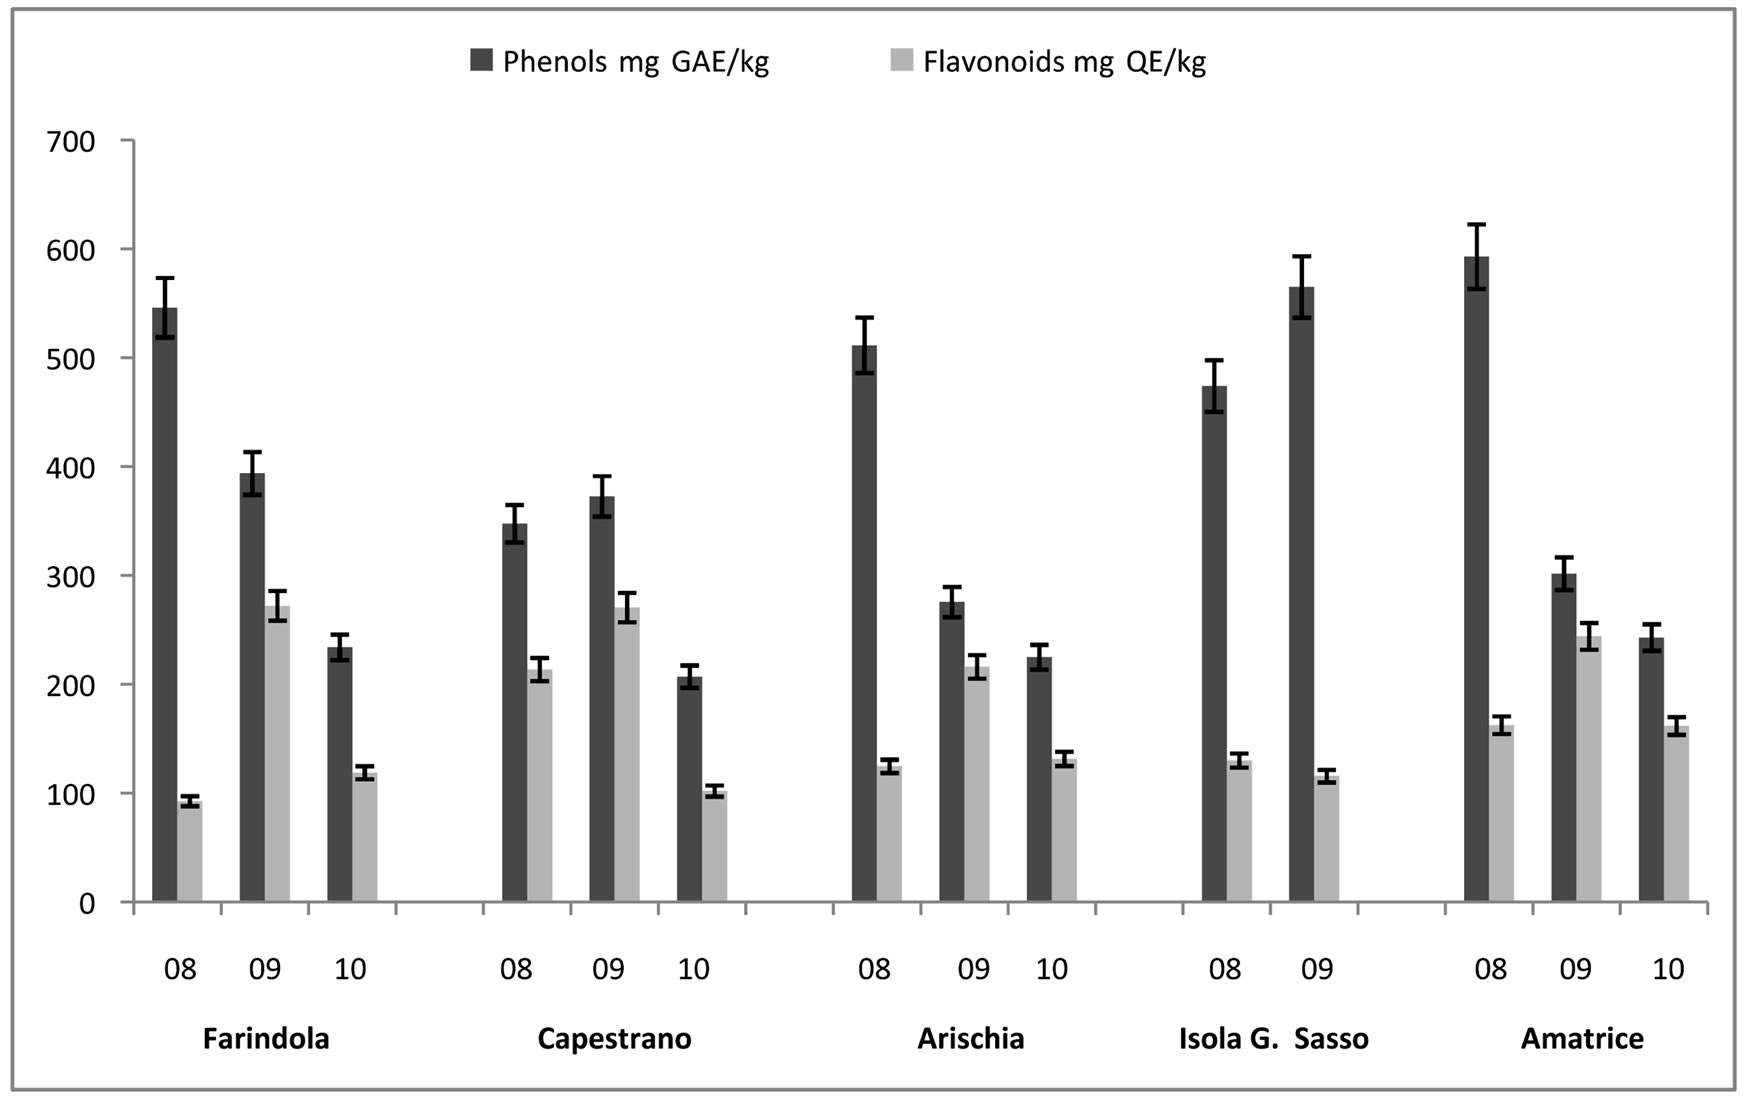
Figure 3. Total Phenols (mg GAE/kg) and Flavonoids (mg QE/kg) in pollen pellets in the years 2008-2010.
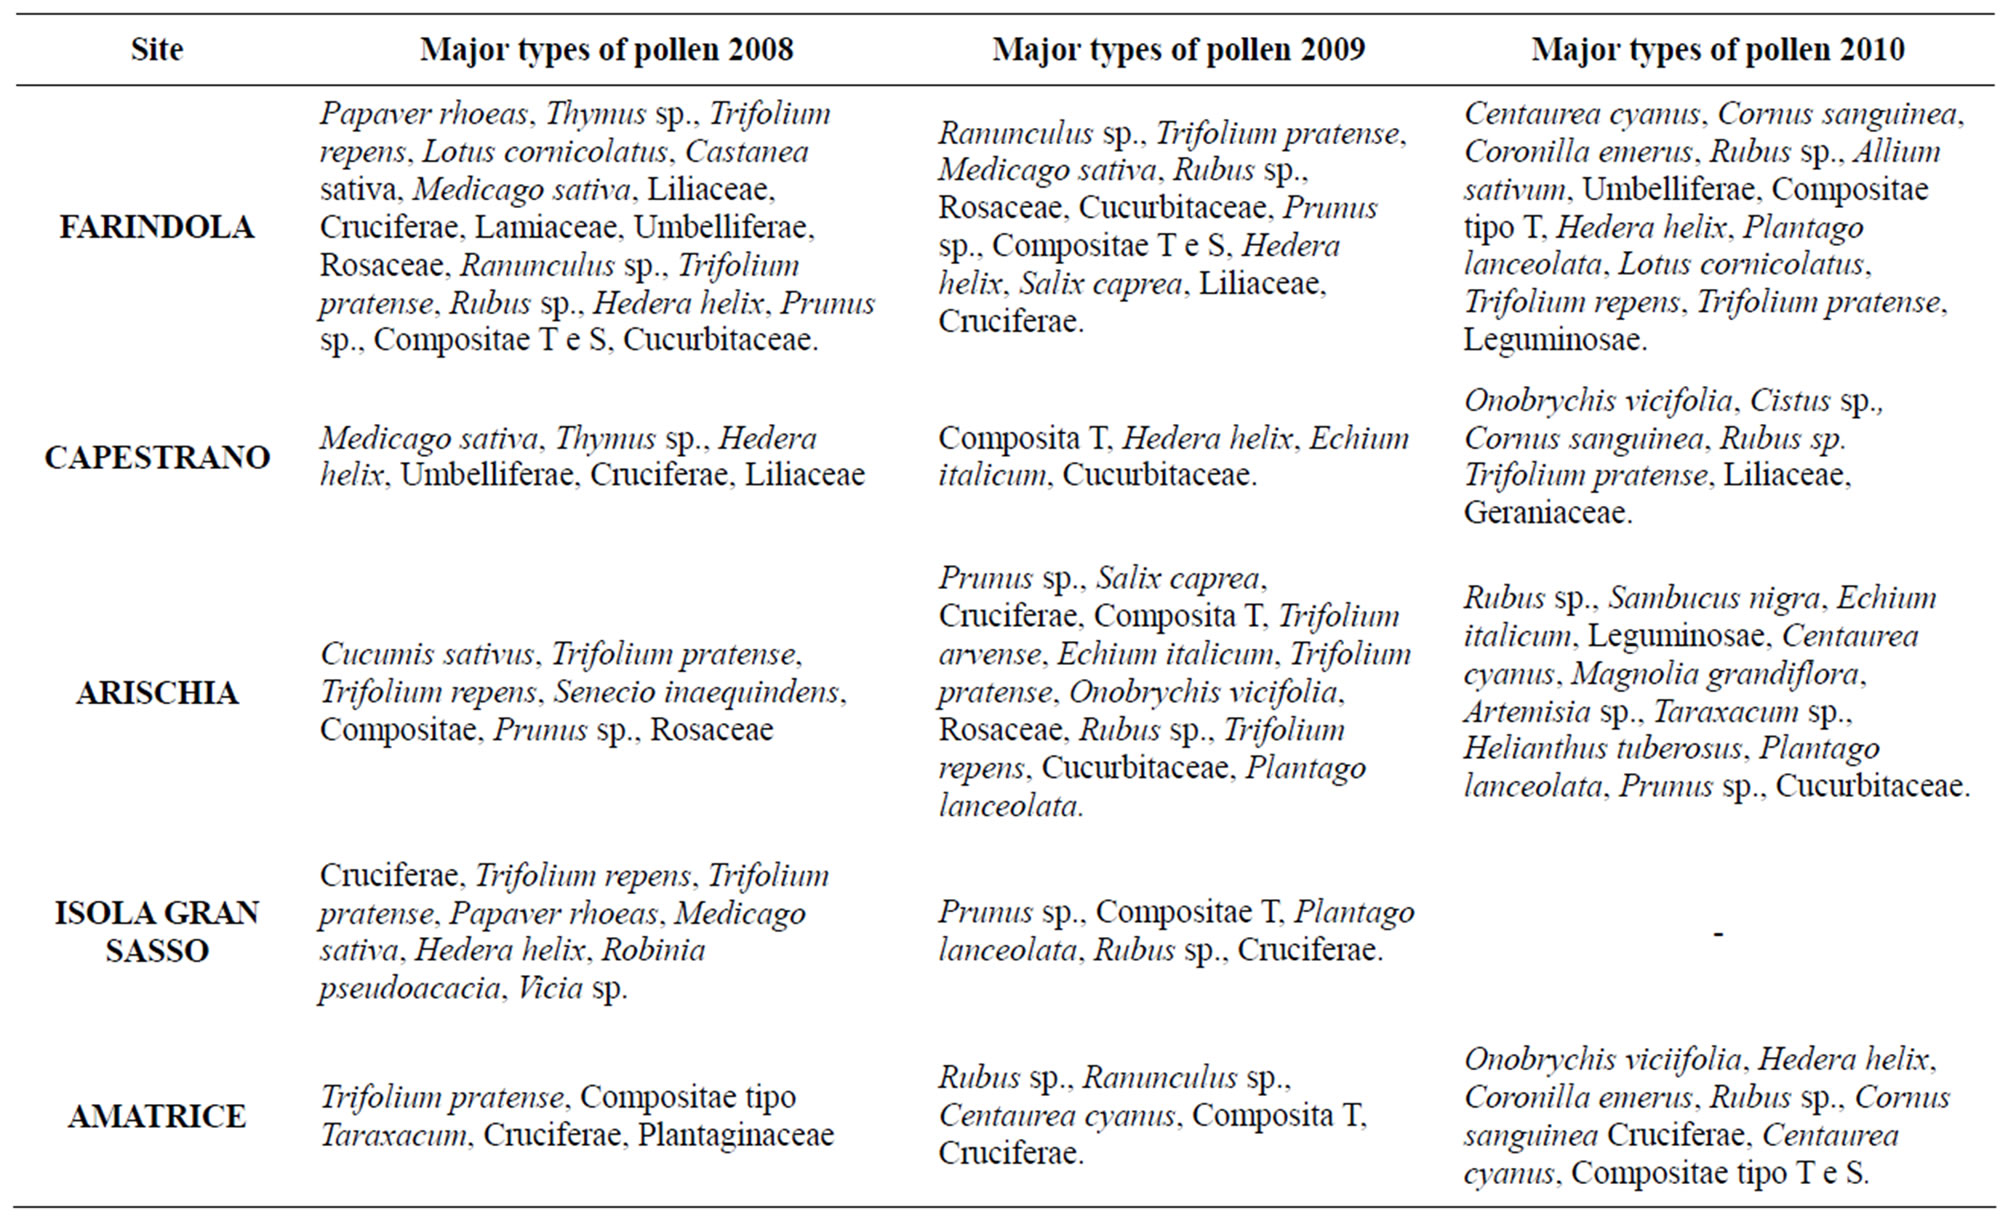
Table 5. Typologies of pollen recovered in the pollen pellets collected in the years 2008, 2009, 2010.
case of pesticides) and the residues present in their bodies or in beehive products (antibiotics, pesticides, heavy metals, fungicides, radionuclides and other pollutants) [24]. Honey bee is easy to breed, almost ubiquitous, with modest food requirements, covered with hairs (which make it particularly suitable to hold the materials and
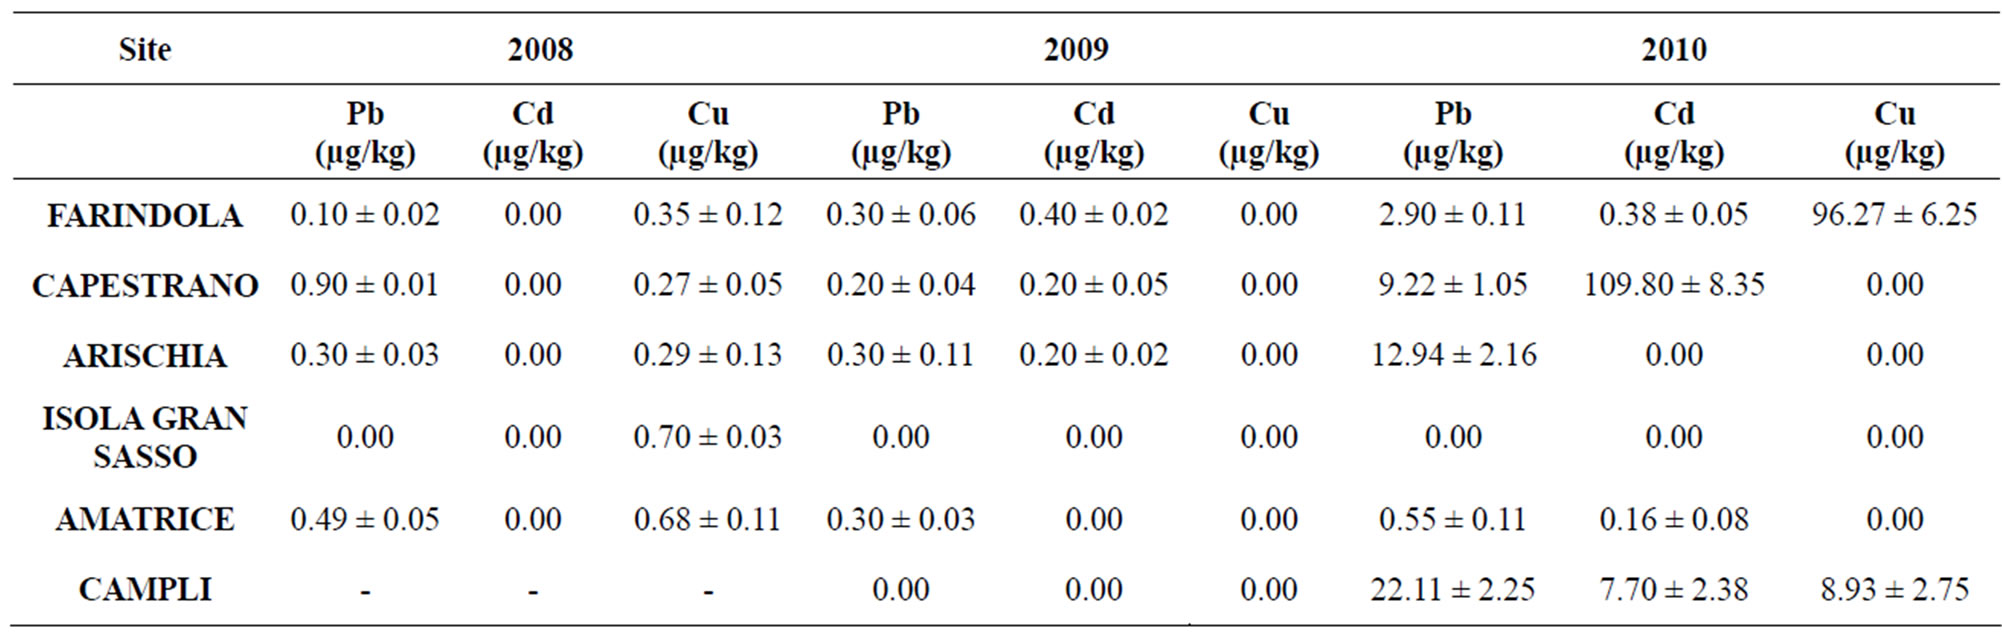
Table 6. Sample positive (Mean value ± Standard deviation) for heavy metals.
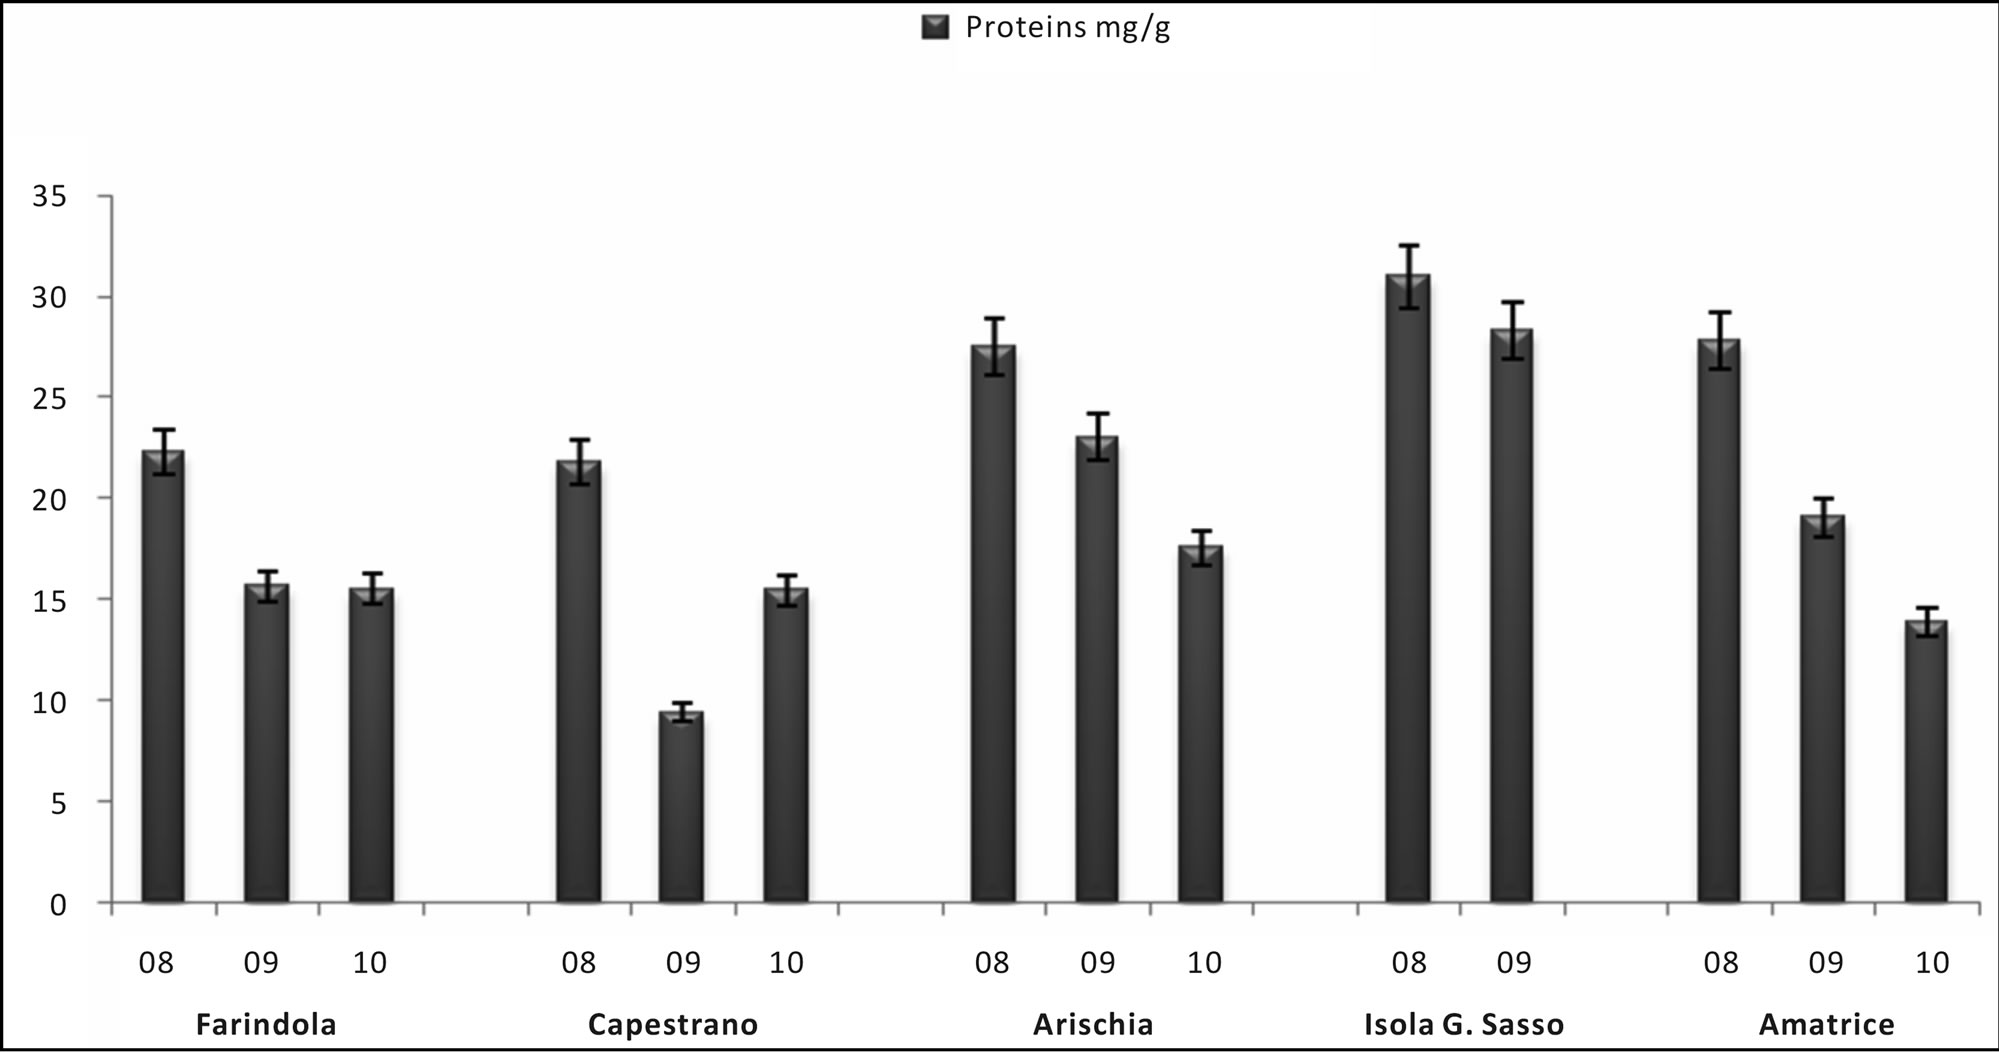
Figure 4. Total proteins (mg/g) in the pollen samples in the years 2008-2010.
substances it comes into contact with), highly sensitive to most plant protection products (revealing when they are improperly spread through the environment e.g. during flowering, in the presence of wind, etc.), with a very high rate of reproduction and relatively short average lifespan, great mobility and wide flying range (which allows a large area to be monitored). These ethological and morphological characteristics make this insect a reliable ecological detector. In fact, honey and pollen analyses represent a precise fingerprint for the study of the environmental condition where the beehive is situated (contamination by pollutants), for the detection of bee’s state of health but also for the description of botanical species that are present in the areas they live [25]. For these reasons, it is advisable to install a network of beehives, in defined and coordinated areas, so as to monitor the health state of parks and reserves of Italy. The purpose of this study was to analyze physico-chemical parameters, residual presences, nutritional and nutraceutical values and botanical origin of bee products collected from the protected natural areas of Gran Sasso Natural Park and “Monti della Laga” (Abruzzo, central Italy). The European model for the quality of honey is based on three fundamental criteria: cleanness, freshness and storability. The parameter which defines honey freshness, namely HMF level, is subject to variations during the time and as result of heat treatments. Storability is defined by the water content, which should be sufficiently low to prevent the priming of fermentation phenomena due to yeasts always present in honey [26]. Physico-chemical parameter study of all samples demonstrated the high quality of analyzed honeys: these values, in fact, fell al-
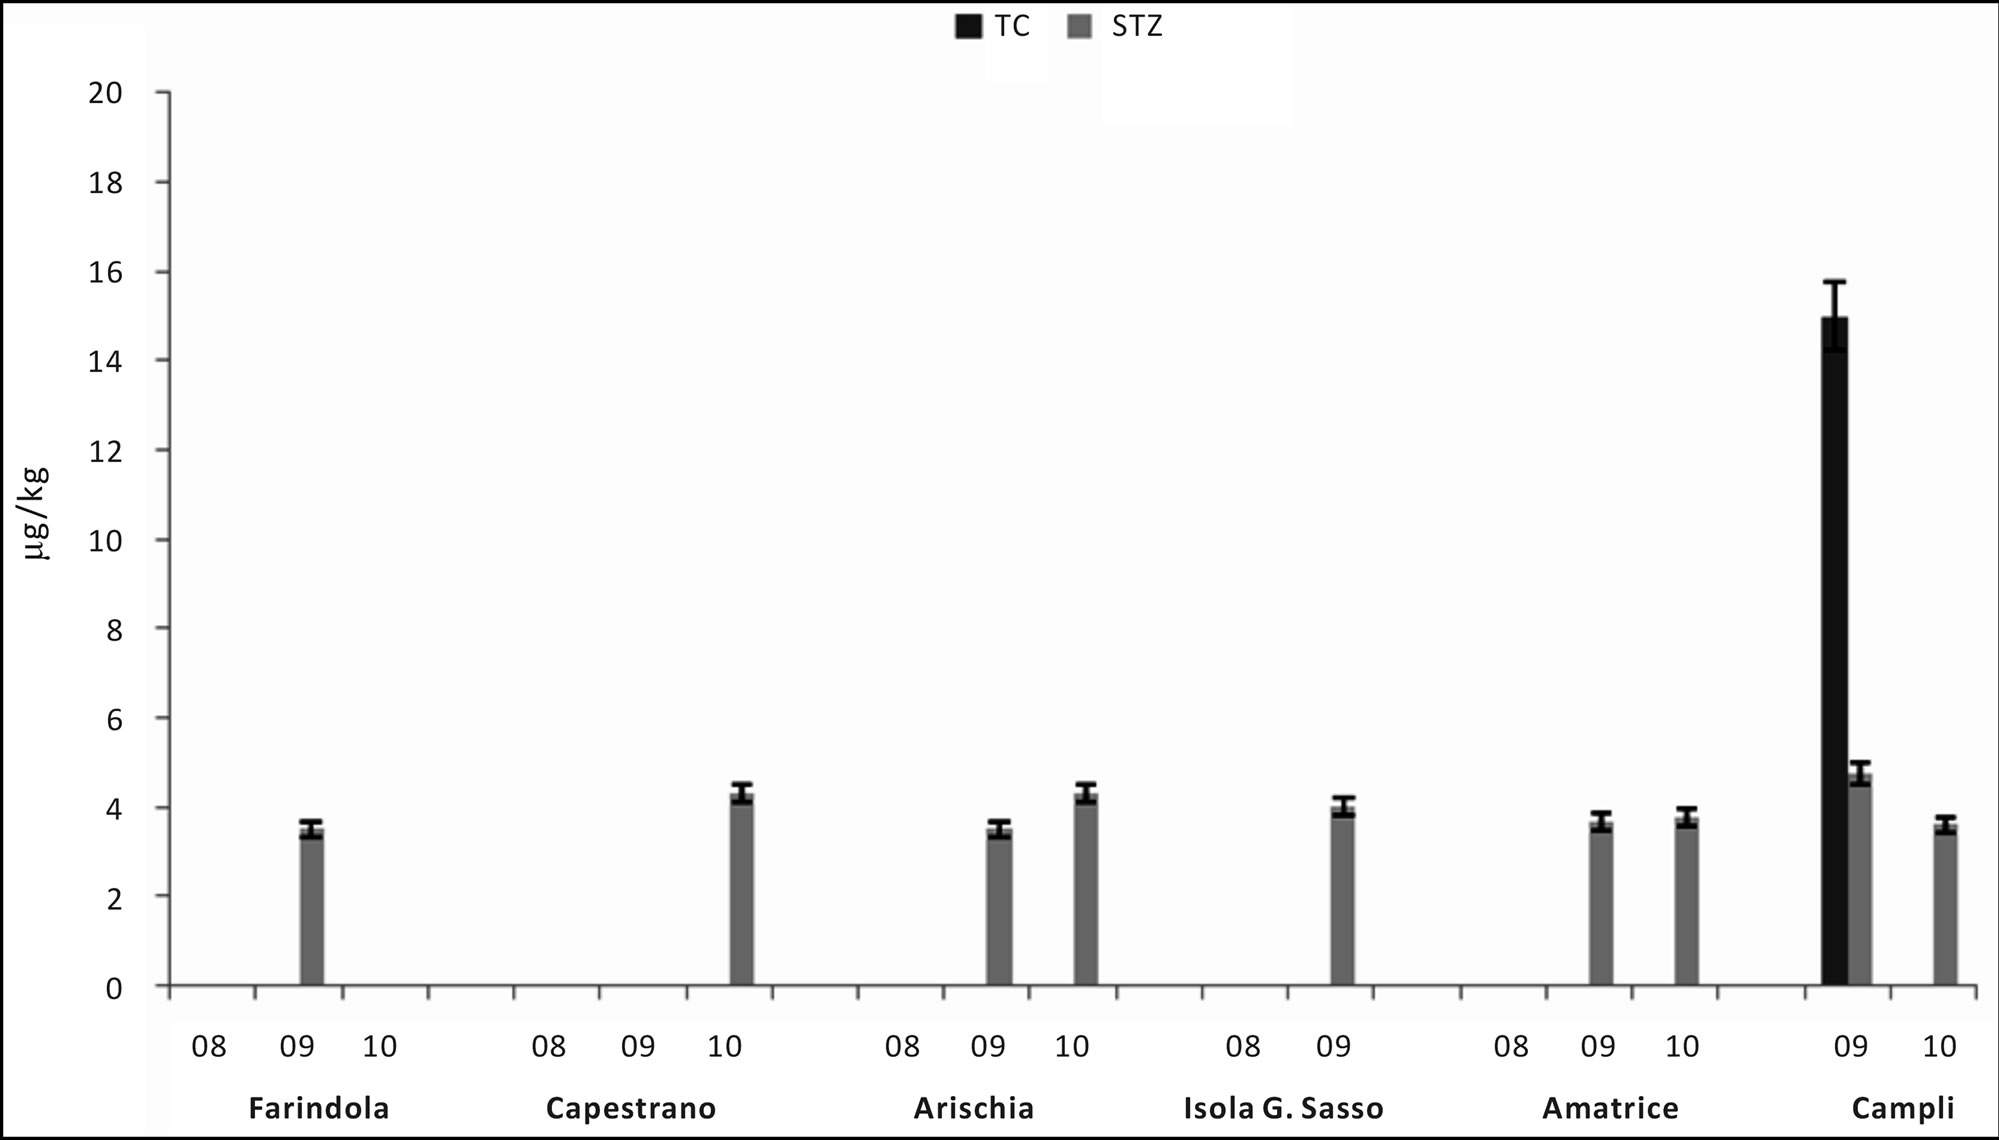
Figure 5. Histogram showing mean values residues (TC = tetracycline and STZ = Sulphathiazole) in samples divided by site.
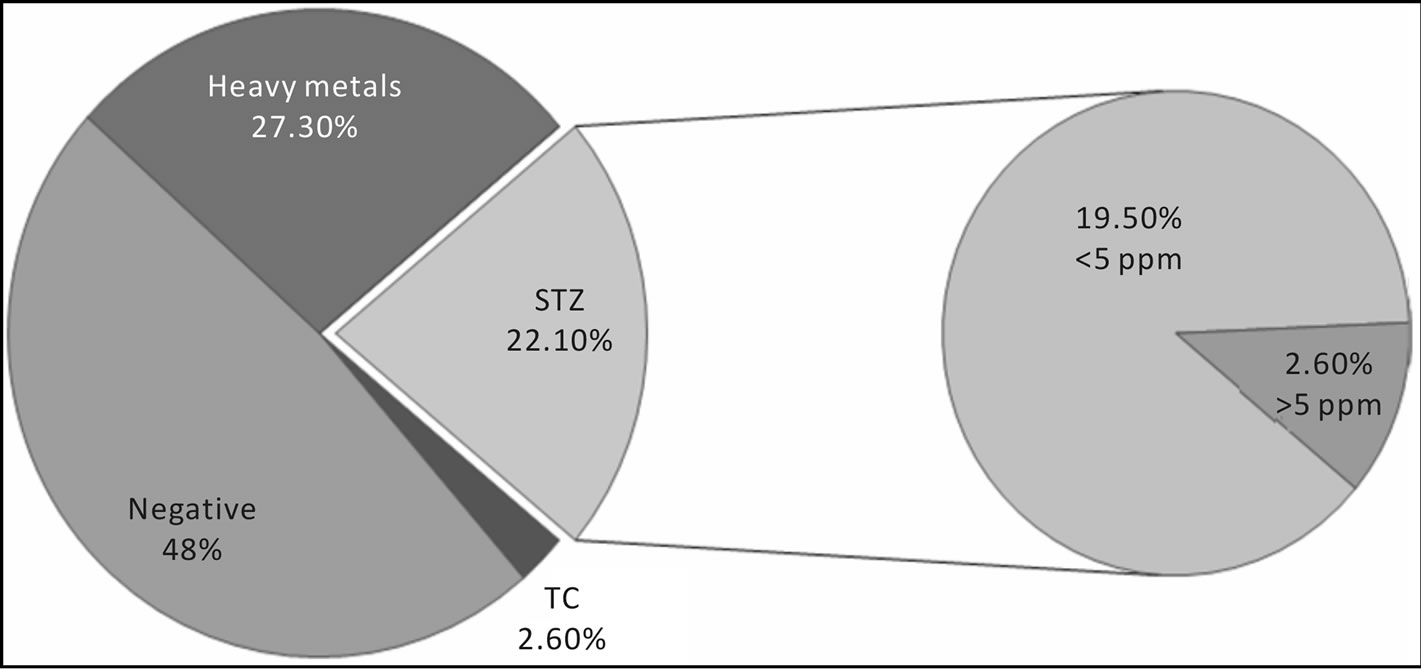
Figure 6. Summary plot of the residue, in particular sulphatia-zole, in samples.
ways within the limits established by Italian legislation [27]. Melissopalynological analysis revealed that 94% of samples were wildflower honeys and only 6% were monofloral Castanea honeys; it indicates the existence of several spectra of vegetation for the different sites in the Parks corresponding to various seasons. Results obtained from this study showed the presence of a lot of botanical species in Gran Sasso Natural Park and “Monti della Laga”. The most common floral varieties were: Robinia pseudoacacia L. and Castanea sativa Mill. for woody species; Paliurus spina-christi Mill., Sambucus nigra L. and Cornus sanguinea L. for shrubby species; Echinacea spp., Satureja montana L., Echium italicum L., Trifolium repens L., Trifolium pratense L., Medicago sativa L. and Senecio inaequidens DC. for herbaceous species. Pollen melissopalynological analysis indicated that Rubus spp., Cornus sanguinea L. and Hedera helix L., present in all sites and rich in protein sources of high interest, were preferred foraged species by bees. It should be noted and underlined the presence of Senecio inaequidens DC. In these Parks, because its ingestion (also pollen) is toxic for humans and livestock [28,29]. In honey sample the presence of Senecio inaequidens DC. pollen was very low (<1%): concentration that is irrelevant and not dangerous. All these data match those reported by Conti (2004) [30] and Conti et al. (2007) [31] about the vege-
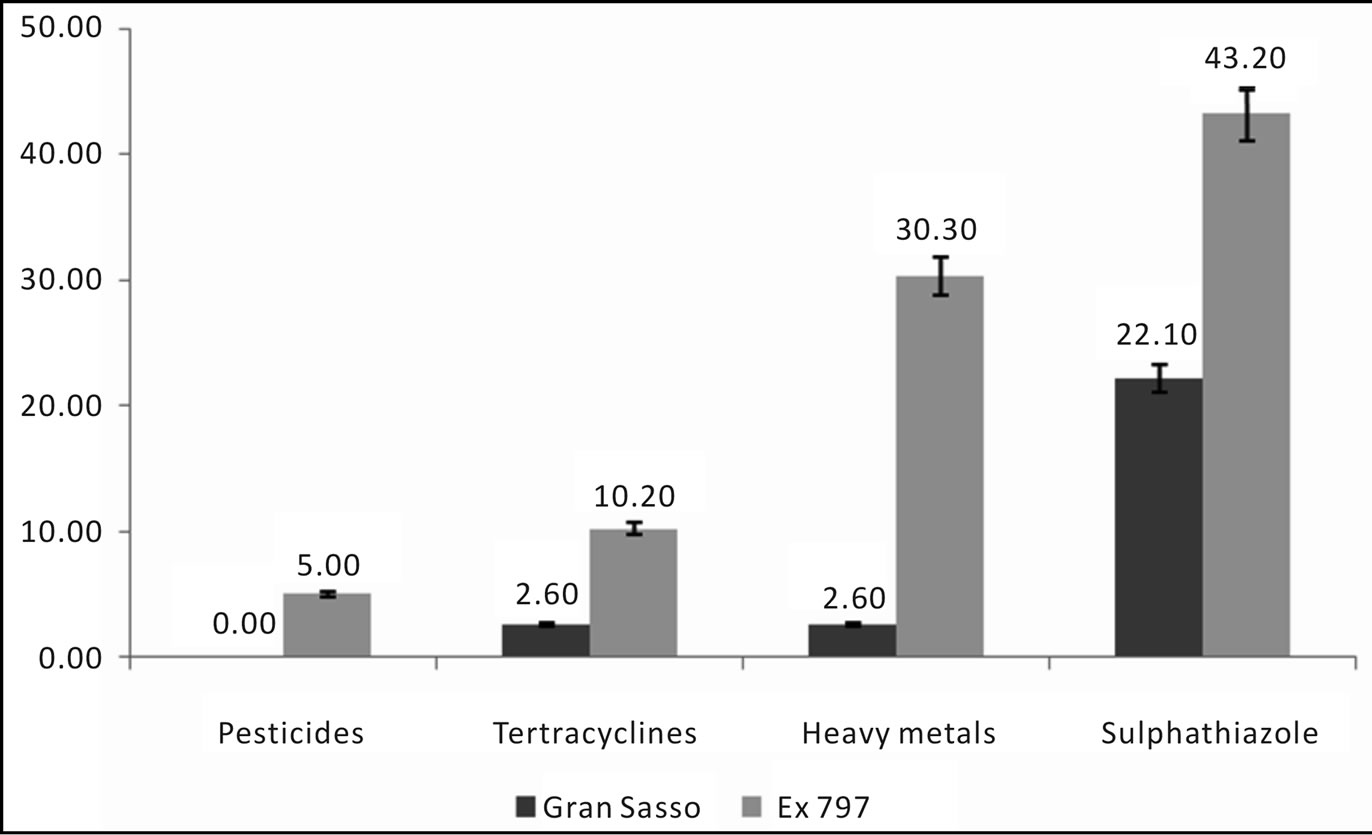
Figure 7. Comparison of the percentage of positive samples for contaminants.
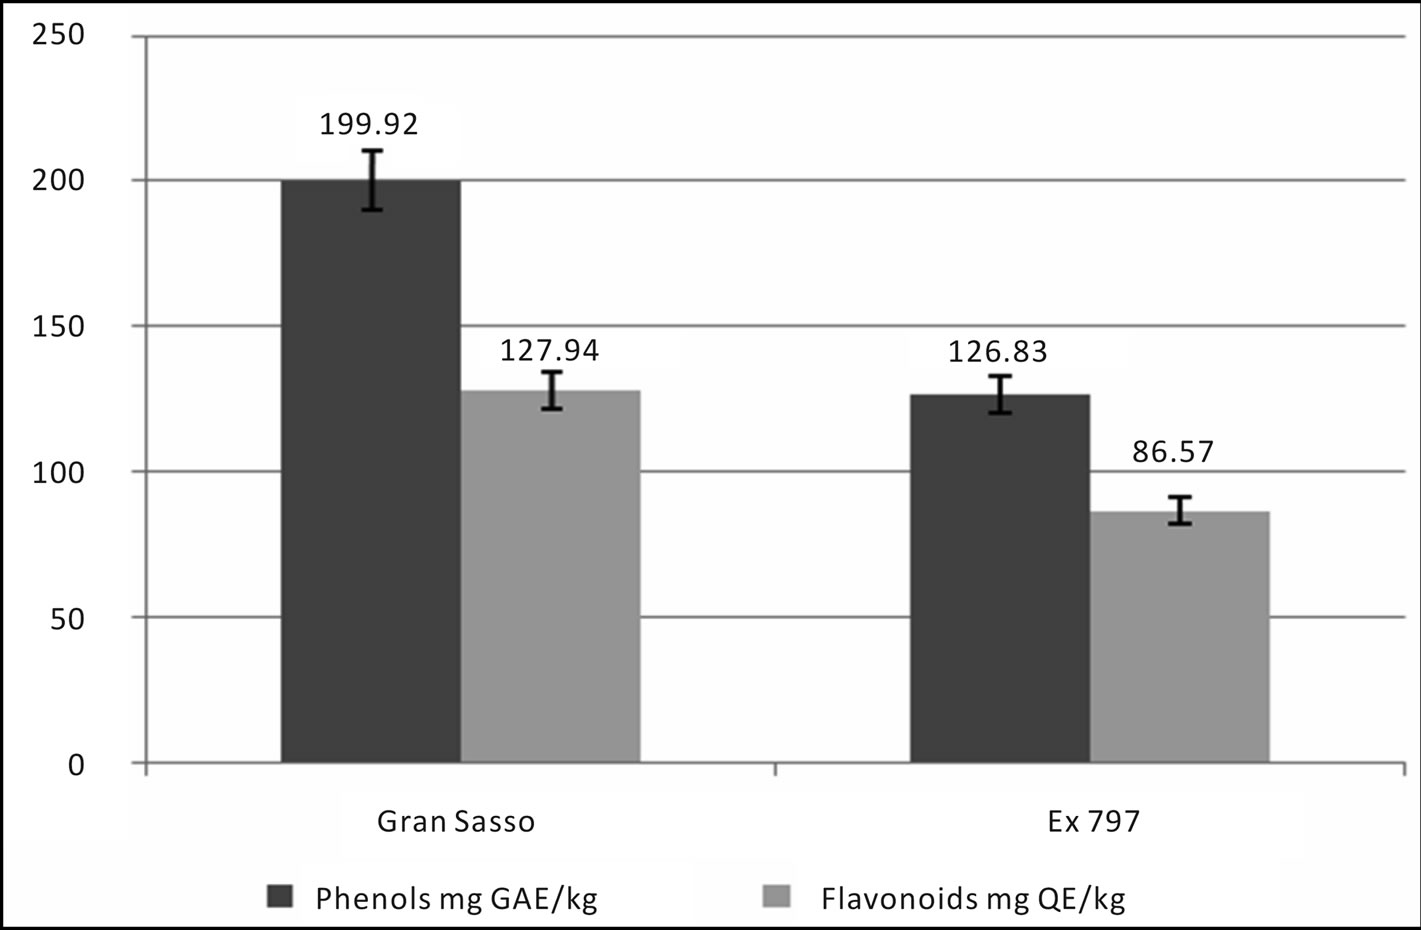
Figure 8. Comparison of the average content of secondary metabolites.
tation type of this territory. Melissopalynological analysis could represent a system for identifying some botanical particularities of high floristic importance, such as invasive or alien or extinction risk species. Another purpose of this study was the characterization of the bioactive components present in honeys and pollens from various floral sources. The results for total flavonoid and phenolic content, in agreement with Bentrocelj et al. (2007) [32] and Pichichero et al. (2009) [33], showed that chestnut (Castanea) honeys (or wildflower honeys with a high proportion of pollens of Castanea or Thymus) had the highest levels of bioactive compounds with respect to the other honeys. The difference between the nutraceutical amounts found in commercial samples with respect to honeys produced in protected areas, suggested that foraged species can highly affect the content of antioxidant compounds present in bee product [34,35]. The presence of such bioactive molecules highlights the role of honey as nutritional source of natural antioxidants responsible for protecting human health, as reported by Schramm et al. (2003) [36], Gheldof et al. (2003) [37] and by McKibben and Engheseth (2002) [38]; moreover, studies conducted in our laboratory demonstrated the anti-proliferative activity of honey 5,7-dimethoxycoumarin in the B16 melanoma cell line [39]. Sometimes pesticides, veterinary substances and environmental contaminants, such as pesticides and heavy metals, may be present in non-negligible quantities in honey because they are accumulated by plants and automatically transferred to the bees through nectar and pollen [40-43]. For this fact, our last analysis was to verify the potential presence of unwanted residues in hive products. Human and veterinary pharmaceutical product contamination is very critical because these molecules are introduced into the environment by several pathways: discharges of wastewater, plant treatments and land applications of sewage sludge and animal manure [44]. Antibiotic contamination can cause several problems: on bacteria it can induce resistance and alteration on microbial community and on humans it may determine chronic or toxic reactions [45]. Two families of antibiotics, tetracycline and sulfonamides, were investigated in honey samples because they are frequently used in beekeeping to combat foulbrood (Paenibacillus larvae). We also included in these analyses several pesticides (Amitraz, Coumaphos and Chlorfenvinphos) which are used to prevent varroatosis and as agricultural insecticides (like also neonicotinoids) [46]. So an important scope of this project was to use beehives as indicators of environmental quality; the hives were placed in strategic locations, such as near roads (presence of heavy metals) or intensive farms (presence of antibiotics) or cultivated lands (presence of pesticides): thus, contaminated samples indicated not only an excessive use of these toxic molecules by bee-keepers, but also a possible environmental contamination. All analyses were carried out taking into account the National Residues Plan 2010 [47]. This plan shows a limit of tolerance for residues, in beehive products, of ≤5 µg/kg for antibiotics and 0.1 µg/kg for heavy metals; only respecting this limit a product can be marketed. Overall, 27.30% of the monitored samples resulted positive for residues: in particular 2.6% for sulphathiazole, 2.6% for tetracycline and 22.10% for heavy metals (Figures 5 and 6). This data show that the human impact, even in protected areas, cannot be neglected. Nevertheless, data obtained from the monitoring of the quality of bee products held at the Honey Research Centre (Department of Biology, University of Rome “Tor Vergata”) during 2009 and 2010, according to the directives of 1234/EX DECREE 797, show how the percentage of pollutants from human activities is substantially lower in samples monitored in the Gran Sasso Natural Park and “Monti della Laga” compared to samples belonging to the previous monitoring (ex 797) (Figure 7). Similary, the amount of secondary metabolites is higher in the Gran Sasso Natural Park honeys than regional honeys (so higher than national average) (Figure 8) [35]. The monitoring has also contributed, through the implantations of hives, to the enrichment of pollination of plant species. It has then allowed a census of botanical species, present in those areas, and was able to certify the territory from a point of view of environmental health. Bee-keeping business may be compatible with the needs of the Park to emphasize the conservation of plants and animal species that depend on them. The pollen is a quality product whose production can be suggested as an important economic activity. Honey and pollen production can certainly be identified through a dedicated supply chain that ensures their high organoleptic, nutritional and nutraceutical quality. It remains to suggest the use of beehives in agricultural systems to develop local economic growth and the implementation of yield through the natural pollination service.
5. ACKNOWLEDGEMENTS
This research was funded by Gran Sasso and Monti della Laga Natural Park. We thank beekeepers for their help in collecting samples.
REFERENCES
- Crane, E. (1984) Bees, honey and pollen as indicators of metals in the environment. Bee World, 55, 47-49.
- Ricciardelli, d’Albore, G. and Intoppa, F. (2000) Apoidei e Ambiente. In: Ricciardelli d’Albore, G. and Intoppa, F., Eds., Fiori e Api. La Flora Visitata Dalle Api e Dagli Altri Apoidei in Europa. Calderini Edagricole, Bologna, 12-15.
- Bogdanov, S. (2006) Contaminants of bee products. Apidologie, 37, 1-18. doi:10.1051/apido:2005043
- Celli, G. (1983) L’ape come insetto test della salute di un territorio. In: Arzone, A., Conti, M., Currado, I., Marletto, F., Pagiano, G., Ugolini, A. and Vidano, C., Eds., Atti XIII Congresso Nazionale Italiano Entomologia, Torino, 637- 644.
- Porrini, C., Ghini, S., Girotti, S., Sabatini, A.G., Gattavecchia, E. and Celli, G. (2002) Use of honey bees as bioindicators of environmental pollution in Italy. In: Dellivers, J. and Pham-Delègue, M., Eds., Honey Bees: Estimating the Environment Impact of Chemicals, Taylor & Francis, London, 186-247.
- Porrini, C., Sabatini, A.G., Girotti, S., Ghini, S., Medrzycki, P., Grillenzoni, F., Bortolotti, L., Gattavecchia, E. and Celli, G. (2003) Honey bees and bee products as monitors of the environmental contamination. Apiacta, 38, 63-70.
- Hoffmann, F. (2005) Biodiversity and pollination: Flowering plants and flore-visiting insects in agricultural and semi-natural landscape [dissertation]. University of Groningen. Accessed 2007. http://dissertations.ub.rug.nl/faculties/science/2005/f.hoffmann/
- National Research Council. (2007) Status of pollinators in North America. The National Academies Press, Washington DC.
- Oldroyd, B.P. (2007) What’s killing American honey bees? PLoS Biology, 5, 1195-1199. doi:10.1371/journal.pbio.0050168
- Winfree, R. (2010) The conservation and restoration of wild bees. Annals of the New York Academy of Sciences, 1195, 169-197. doi:10.1111/j.1749-6632.2010.05449.x
- Repubblica Italiana. (2004) Decreto legislativo N.179 del 21 maggio 2004, attuazione della direttiva 2001/110/CE concernente il miele. Gazzetta Ufficiale del 20/7/2004 n. 168.
- UNI 10934, (2001) Miele determinazione dell’idrossimetilfurfurale. Ente Nazionale Italiano di Unificazione.
- Von Der Ohe, W., Persano Oddo, L., Piana, M.L., Merlot, M. and Martin, P. (2004) Harmonized methods of melissopalynology. Apidologie, 35, 18-25. doi:10.1051/apido:2004050
- Heimler, D., Vignolini, P., Dini, M.G. and Romani, A. (2005) Rapid tests to assess the antioxidant activity of Phaseolus vulgaris L. Dry beans. Journal of Agricultural and Food Chemistry, 53, 3053-3056. doi:10.1021/jf049001r
- Meda, A., Lamien, C.E., Romito, M., Millogo, J. and Nacoulma, O.G. (2004) Determination of the total phenolic, flavonoid and proline contents in Burkina Fasan honey, as well as their radical scavenging activity. Food Chemistry, 91, 571-577. doi:10.1016/j.foodchem.2004.10.006
- Bradford, M.M. (1976) Rapid and sensitive method for the quantization of microgram quantities of protein utilizing the principle of protein-dye binding. Analytical Biochemistry, 72, 248-254. doi:10.1016/0003-2697(76)90527-3
- Huq, S., Garriques, M. and Kallury, K.M.R. (2006) Role of zwitterionic structures in thesolid-phase extraction based method development for clean up of tetracycline and oxytetracycline from honey. Journal of Chromatography A, 1135, 12-18. doi:10.1016/j.chroma.2006.09.025
- Oka, H., Ito, Y., Ikai, Y., Kagami, T. and Harada, K. (1998) Mass spectrometric analysis of tetracycline antibiotics in food. Journal of Chromatography, 812, 309-319. doi:10.1016/S0021-9673(97)01278-8
- Alfredsson, G., Branzell, C., Granelli, K. and Lundström, Ǻ. (2005) Simple and rapid screening and confirmation of tetetracycline in honey and eggs by a dipstick test and LC-MS/MS. Analytica Chimica Acta, 529, 47-51. doi:10.1016/j.aca.2004.08.050
- Martel, A.C. and Zeggane, S. (2003) HPLC determination of sulfathiazole in French honeys. Journal of Liquid Chromatography & Related Technologies, 26, 953-961. doi:10.1081/JLC-120018895
- Martel, A.C. and Zeggane, S. (2002) Determination of acaricides in honey by high-performance liquid chromatography with photodiode array detection. Journal of Chromatography A, 954, 173-180. doi:10.1016/S0021-9673(02)00126-7
- Perkin Elmer Corporation. (1982) Analytical methods for Atomic Absorption Spectrophotometer. Manuel, Fish Products, 4-5.
- AOAC. (1984) Official methods of analysis of the Association of Official Analytical Chemists. 14th Edition, Association of Official Analytical Chemists, Washington DC.
- Celli, G. (1994) L’ape come indicatore biologico dei pesticidi. In: D’Ambrosio, M.T. and Accorti, M., Eds., Atti del convegno: “L’Ape Come Insetto Test Dell’Inquinamento Agricolo” P.F “Lotta Biologica e Integrata per la Diffusione Delle Colture Agrarie e Delle Piante Forestali” March 28, 1992, Florence, Italy. Ministero Agricoltura e Foreste, Rome, 15-20.
- Porrini, C., Sabatini, A.G., Girotti, S., Ghini, S., Medrzycki, P., Grillenzoni, F., Bortolotti, L., Gattavecchia, E. and Celli, G. (2003) Honey bees and bee products as monitors of the environmental contamination. Apiacta, 38, 63-70.
- Persano Oddo, L. (2000) La qualità e la valorizzazione del miele. In: Persano Oddo, L., Sabatini, A.G., Accorti, M., Colombo, R., Marcazzan, G.L., Piana, M.L., Piazza, M.G. and Pulcini, P., Eds., I Mieli Uniflorali Italiani, Nuove schede di caratterizzazione, 105.
- Repubblica Italiana (2004) G. U. No. 168 del 20/07/2004. Decreto legislativo 21 maggio 2004. Attuazione della direttiva 2001/110/CEE concernente la produzione e commercializzazione del miele. Italy.
- Conti, F. and Manzi, A. (1997) Centaurea diluita Aiton, new to the Italian flora. Flora Mediterranea, 7, 51-53.
- Conti, F., Manzi, A. and Tinti, D. (2002) Aggiunte alla flora d’Abruzzo. Informatore Botanico Italiano, 34, 55- 61.
- Conti, F. (2004) La flora ipsofila dell’Appennino centrale: Ricchezza ed endemiti. Informatore Botanico Italiano, 35, 383-386.
- Conti, F., Tinti, D., Scassellatti, E., Bartolucci, F. and Di Santo, D. (2007) Le piante vascolari endemiche dell’ Appennino centrale. Biogeographia, XXVIII, 25-38.
- Bentrocelj, J., Doberšek, U., Jamnik, M. and Golob, T., (2007) Evaluation of the phenolic content, antioxidant activity and color of Slovenian honey. Food Chemistry, 105, 822-828. doi:10.1016/j.foodchem.2007.01.060
- Pichichero, E., Canuti, L. and Canini, A. (2009) Characterisation of the phenolic and flavonoid fractions and antioxidant power of italian honeys of different botanical origin. Journal of the Science of Food and Agriculture, 89, 609-616. doi:10.1002/jsfa.3484
- Lila, M.A. (2006) Perspective: The nature-versus-nurture debite on bioactive phytochemicals: The genome versus terrori. Journal of the Science of Food and Agriculture, 48, 1498-1150.
- Canini, A., Pichichero, E., Alesiani, D., Canuti, L. and Leonardi, D. (2009) Nutritional and botanical interest of honey collected from protected natural areas. Plant Biosystems, 143, 62-70. doi:10.1080/11263500802633543
- Schramm, D.D., Karim, M., Schrader, H.R., Holt, R.R., Cardetti, M. and Keen, C.L. (2003) Honey with high levels of antioxidants can provide protection to healthy human subjects. Journal of the Science of Food and Agriculture, 51, 1732-1735. doi:10.1021/jf025928k
- Gheldof, N., Wang, X.H. and Engheseth, N.J. (2002) Identification and qualification of antioxidant components of honey from various floral sources. Journal of Agricultural and Food Chemistry, 50, 5870-5877. doi:10.1021/jf0256135
- McKibben, J. and Engheseth, N.J. (2002) Honey as a protective agent against lipid oxidation in ground turkej. Journal of Agricultural and Food Chemistry, 50, 592-595. doi:10.1021/jf010820a
- Alesiani, D., Cicconi, R., Mattei, M., Montesano, C., Bei, R. and Canini, A. (2008) Cell cycle arrest and differentiation induction by 5,7-dimethoxycoumarin in melanoma cell lines. International Journal of Oncology, 32, 425-434.
- Migliore, L., Godeas, F., De Filippis, S.P., Mantovi, P., Barchi, D., Testa, C., Rubattu, N. and Brambilla, G. (2010) Hormetic effect(s) of tetracycline as environmental contaminant on Zea Mays. Environment and Pollution, 158, 129-134. doi:10.1016/j.envpol.2009.07.039
- Kumar, K., Gupta, S.C., Baidoo, S.K., Chander, Y. and Singh, A.K. (2005) Antibiotic use in agricolture and its impact on the terrestrial environment. Advances in Agronomy, 87, 1-54. doi:10.1016/S0065-2113(05)87001-4
- Dolliver, H., Kumar, K. and Gupta, S. (2007) Sulphamethazine uptake by plants from manure-amended soil. Journal of Environmental Quality, 36, 1224-1230. doi:10.2134/jeq2006.0266
- Bogdanov, S., Imdorf, A., Charrière, J.D., Fluri, P. and Kilchenmann, V. (2001) Quality of bee products and sources of contamination. LApis, 11, 5-10.
- Sungpyo, K. and Diana, S. A. (2007) Potential ecological and human health impacts of antibiotics and antibioticresistant bacteria from wastewater treatment plants. Journal of Toxicology and Environmental Health, Part B, 10, 559-573.
- Halling-Sorensen, B., Nors Nielsen, S.N., Lanzky, P.F., et al., (1998) Occurrence, fate and effects of pharmaceutical substances in the environment—A review. Chemosphere, 36, 357-393.
- Debayle, D., Dessalces, G. and Granier-Loustalot, M.F. (2008) Multi-residue analysis of traces of pesticides and antibiotics in honey by HPLC-MS-MS. Analytical and Bioanalytical Chemistry, 391, 1011-1020. doi:10.1007/s00216-008-2003-2
- National Residues Plan. (2010) Ai sensi dell’ art. 13 del D.L. del 16 marzo 2006 n. 158 per la ricerca di residui negli animali e nei prodotti di origine animale.