Yangtze Medicine
Vol.01 No.01(2017), Article ID:75017,15 pages
10.4236/ym.2017.11006
Comparative Analysis of the Exon-Intron Structure in Eukaryotic Genomes
Yongfa Li1,2, Yanhua Xu1,3, Zhaowu Ma1,2
1The second School of Clinical Medicine, Yangtze University, Jingzhou, China
2Laboratory of Oncology, Center for Molecular Medicine, School of Medicine, Yangtze University, Jingzhou, China
3Department of Oncology, Central Hospital of Jingzhou, Jingzhou, China

Copyright © 2017 by authors and Scientific Research Publishing Inc.
This work is licensed under the Creative Commons Attribution International License (CC BY 4.0).
http://creativecommons.org/licenses/by/4.0/


Received: February 27, 2017; Accepted: March 27, 2017; Published: March 30, 2017
ABSTRACT
The exon numbers and lengths vary in different eukaryotic species. With increasing completed genomic sequences, it is indispensable to reanalyze the gene organization in diverse eukaryotic genomes. We performed a large-scale comparative analysis of the exon-intron structure in 72 eukaryotic organisms, including plants, fungi and animals. We confirmed that the exon-intron structure varies massively among eukaryotic genomes and revealed some lineage-specific features of eukaryotic genes. These include a teleost-specific exon-intron structure pattern, relatively small introns and large exons in fungi and algae, and a gradual expansion of introns in vertebrates. Furthermore, the conservation analysis of exon-intron boundaries indicates that several bases near splice site junctions are different in introns with variable length among different species. After comparison, we identified a trend showing increases in intron densities and lengths in diverse species from fungi, plants, invertebrates to vertebrates, while it was the opposite in relation to exon lengths. The statistical properties of eukaryotic genomic organization suggest that genome-specific features are preserved by diverse evolutionary processes, which paves way for further research on the diversification of eukaryotic evolution.
Keywords:
Exon-Intron Structure, Eukaryotic Genome, Evolution

1. Introduction
A typical eukaryotic gene consists of multiple exons interrupted by introns and their numbers vary tremendously between eukaryotic species [1] . Introns are removed by RNA splicing while the final mature transcript product is being generated. Alternative splicing (AS) is a posttranscriptional process in eukaryotic organisms by which multiple distinct transcripts are produced from a single gene [2] . Previous studies using high-throughput sequencing technology have reported that up to 92% - 94% of human multi-exon genes undergo AS [3] [4] , often in a tissue/developmental stage-specific manner [3] [5] . The splice sites are recognized across a highly conserved region of nucleotides (nt) and the intron length significantly influences the efficiency of pre-mRNA splicing and alternative splice site choice [6] .
In vertebrates, there are relatively long introns and short exons, while it is inverse in lower eukaryotes [7] . Comparative eukaryote genomics have suggested that intron evolution is a dynamic process in eukaryotes, and introns have been gained and lost in different genomes in response to strong selective pressures [8] . Although the basic ability of eukaryotes to splice introns is conserved, the splicing signals are evolved and shaped to different splicing mechanisms in diverse speciation [9] [10] . A comparative analysis of the basic splicing signals indicated that short intron recognition was rather susceptible to evolutionary changes in eukaryotes, but the overall pattern of intron recognition was well conserved in mammals [11] . It is suggested that there is a species-specific association between the exon and intron length variation in genomes. Roy et al. found that newly originated exons were more common within longer introns (>1000 nt) compared with short introns (<400 nt) in vertebrate genomes [12] . Large introns could be a reservoir of genetic diversity, and they can promote AS via exon-skipping and exon turnover during evolution [13] . The availability of genomic sequences and annotations makes it feasible to examine many fundamental evolutionary questions on the genome scale. The diversity of exon-intron structures among eukaryotic genomes makes them extremely attractive for exploring questions of exon-intron structure evolution.
In this study, we performed a comprehensive survey of the exon-intron structure in 72 eukaryotic organisms, including 17 plants, 11 fungi, 12 invertebrates and 32 vertebrates. Our results confirm that the lengths and numbers of introns vary among different eukaryotic genomes. Both general and genome-specific features of the exon-intron organization were found in eukaryotic genes. This statistical analysis of the exon-intron structure revealed some diverse characteristics in eukaryotic genomes. These results may provide clues to elucidate mechanisms involved in the organization of eukaryotic genomes and also gene structure evolution.
2. Materials and Methods
2.1. Data Sources and Statistical Analysis
Complete genome annotation data of animals and fungi were downloaded from Ensembl database (release 67) (http://www.ensembl.org/). Genomic data of plants were downloaded from JGI (http://www.jgi.doe.gov/). For convenience, we classified the 72 species into four groups: fungus, plant, invertebrate and vertebrate. Statistical analyses were performed using the Perl package. Gene structure information including the numbers and lengths of exon/intron and their sequences were extracted from the corresponding genome data. To obtain only reliable data, we applied the following relatively stringent criteria for the quality of the alignment. 1) The intron must be longer than 5 nt, as intron splicing requires a “minimum” of five nucleotides (GU-AG plus an A for the branch point) [14] . 2) For genes with many alternative splicing isoforms, we retained the isoform which produces the longest mRNA for statistical analysis.
2.2. Comparison of Exon-Intron Boundaries
In addition to the overall exon/intron numbers and lengths data created from the available sequences, we also obtained exon/intron boundary data for 6 organisms; Homo sapiens, Danio rerio, Drosophila melanogaster, Caenorhabditis elegans, Saccharomyces cerevisiae and Arabidopsis thaliana. We constructed the motif profiles in these 6 representative species, using the extracted intron sequences. Sequence motifs for 5’ splice site (5’ss) and 3’ splice site (3’ss) are depicted as sequence logos by the WebLogo http://weblogo.berkeley.edu/. We also extracted the adjacent 10 nucleotides (nt) of the upstream and downstream of each splice site, and analyzed the conservation of 5’ss and 3’ss splice-site signals.
3. Results
3.1. Comparative Analysis of Eukaryotic Genes with Exons
A comprehensive survey of the 72 eukaryotic organisms shows that most eukaryotic genes contain less than 5 exons across different groups. Basically, the ratio of gene numbers decreases as the exon number increases (Table 1). In summary, the proportion of genes containing one exon varies from 28% to 9% in four groups. In fungi, the percentage of genes with 1 - 5 exons is 91.21%, which indicates that fungal genes are simpler than the other groups. The percentages of genes with 1 - 5 exons in plants and invertebrates account for approximately two-thirds. On the contrary, of those genes that contain more than five exons, their proportions are incremental from fungi to vertebrates. An extreme case is that almost all genes in S. cerevisiae contain 1 - 5 exons (99.97%), compared with only 33.85% in meleagris (meleagris gallopavo, vertebrate)

Table 1. Comparative analysis of eukaryotic genes with exons.
(Table S2). Taken together, these results indicate that the genes have more exons in vertebrates than in non-vertebrates.
3.2. Analysis of the Exon Length Distribution
Table 2 shows the varied distributions of exon length in the four groups. It is clear that short exons (<250 nt) are widespread across various eukaryotes. In fungi, the percentage of short exons is only 42.740% and the mean length of fungal exons is larger (589 nt) than in the other three groups (188 nt, 257 nt and 386 nt, respectively). In vertebrates, most of the exons (87.737%) are less than 250 nt in length (Table 2 and Table S1). The percentage of long exons (>500 nt) is 36.575% in fungi, while the corresponding proportions decrease from 21.685%, 9.977% to 5.582% in plants, invertebrates and vertebrates respectively. These results indicate that exon lengths vary across the eukaryotic kingdom with more short exons in vertebrates.
3.3. Analysis of the Intron Characteristics
According to the data we used (Ensembl release 67), the human genome contains 20,687 protein coding genes with introns and 1713 (7%) intron-free protein coding genes. Altogether, there are 200,220 introns in human protein coding genes, so the average number of introns per gene is 8.94 in human genome. The number of introns per gene varies dramatically among diverse eukaryotes, including fungi (0.05 - 3.43 introns per gene), plants (0.33 - 7.30 introns per gene), invertebrates (2.92 - 7.42 introns per gene) and vertebrates (7.35 - 10.09 introns per gene) (Table S1). This statistical analysis showed that there is a wide variety of intron-densities in eukaryotic genomes; complex genomic organizations are much more common in the higher eukaryotes than lower eukaryotes.
Consistent with other studies [15] [16] , our results show that abundant long introns are present in vertebrates. Approximately 48.512% of the introns in vertebrates are >1000 nt in length (Table 3). In general, fungal introns are relatively short, 93.627% of the introns in fungi are shorter than 250 nt. In invertebrates and plants, the average percentages of short introns (<250 nt) are 48.320% and 59.847% respectively. Exceptionally, there is a specific distribution of short introns in teleosts. The average length of introns in teleost fishes was significantly smaller than that of other vertebrates. Furthermore, the percentage of short introns (<250 nt) is in the range of 32.17% - 67.06% (with an average of 52.89%) in the five teleost fishes, but only ~18% in all other vertebrates (Figure 1 and Table S1).
Table 2. Comparison of exon length among different species.
Table 3. Comparison of intron length among different species.
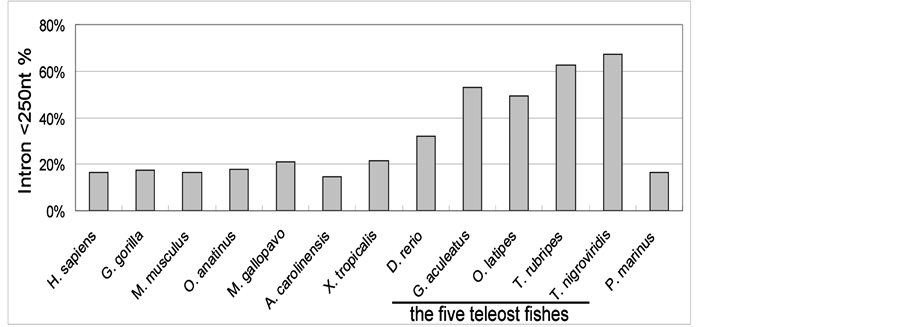
Figure 1. The distribution of short introns in teleosts and some representative vertebrates. The percentage of short introns (<250 nt) in the five teleost fishes is about twice of that in other vertebrates. H. sapiens: Human; G. gorilla: Gorilla; M. musculus: Mouse; O. anatinus: Platypus; M. gallopavo: Turkey; A. carolinensis: Anole lizard; X. tropicalis: Xenopus; D. rerio: Zebrafish; G. aculeatus: Stickleback; O. latipes: Medaka; T. rubripes: Fugu; T. nigroviridis: Tetraodon; P. marinus: Lamprey.
In all observed species, as an extreme example, the smallest percentage of short introns is only 5% in invertebrate (Strongylocentrotus purpuratus, sea urchin). However, the number of introns (157,214) in sea urchin is exceedingly large, which is about twice of other invertebrates (82,398). In the plant group the length of introns was small (183 nt) in three algae of Ostreococcus, with significantly smaller than the average value of other plants (329 nt), while exons were much larger (912 nt) than other plants (386 nt) (Table S1).
Although the total number of introns is similar among teleosts, the mean intron length differs significantly in the five teleost fishes (Table 4 and Table S1). Most introns in teleosts are small and similar in length, yet introns of zebrafish are much longer (2820 nt) than the other teleosts (480 - 1180 nt) and 49.911% of introns in zebrafish is more than 1000 nt. In addition, our results indicated that the peak of the intron length distribution is in the range of 50 - 110 nt in teleosts (Figure S1) and most eukaryotes. The peaks are consistent with previous reports, which show a typical bimodal distribution in many eukaryotes [17] [18] [19] .
Table 4. Comparison of intron length among the teleost fishes.
1No.: Number of introns; 2(%): The percentage of introns.
3.4. Comparative Analysis of Exon-Intron Boundaries in Eukaryotes
We analyzed the classical splicing signal motifs for each organism. The results of six representative species from four groups (H. sapiens, D. rerio, D. melanogaster, C. elegans, S. cerevisiae and A. thaliana) reveal well-known highly conserved motif profiles for introns within the range 51 - 70 nt (Figure 2) and longer. Although resembling one another, the motif profiles exhibit some differences and specificities among different species. The adjacent nucleotides around each splice site are far from random. They comprise two distinguished consensus sequences of the 5’ splice site (5’ss) and the 3’ splice site (3’ss) on the exon-intron boundaries [20] . The conservation of the 5’ss and 3’ss is lower in zebrafish and human than in the other species (Figure 2). For the introns with length in 6 - 50 nt, the splice sites are not conserved in yeast, zebrafish and human (Figure S2). Many eukaryotic genomic architectures are typified by small exons and flanking introns with variable length. Splice site recognition is more efficient when introns or exons are small, which appears to favor diverse splicing factors for alternative splicing [21] .
4. Discussion
This work involves statistical analysis of the exon-intron structure in a large number of eukaryotes. We performed detailed comparisons of the exon-intron structures and revealed some complex characteristics of eukaryotic genomes. The exon-intron structures of eukaryote genes vary across the eukaryotic kingdom, and the evolution of such structures increases in complexity from lower eukaryotes to higher eukaryotes. Our observations are largely consistent with and reinforce those reported previously with respect to introns and exons [9] [17] [22] .
4.1. An Increasing Complexity of Exon-Intron Structures in Eukaryotic Evolution
A comparison of exon-intron structures could elucidate the complexity of genetic diversity among eukaryotes. There is a trend showing a general increase in

Figure 2. Acomparison of splicing signal motifs in six species for 51 - 70 nt introns. Sequence motifs for 5’ss and 3’ss are depicted as sequence logos.
intron densities and lengths in species from fungi, plants, invertebrates to vertebrates. The trend is inverse in relation to exon lengths (Figure 3).
Intron sizes vary widely within each group (fungi, plants, invertebrates and vertebrates). In contrast to intron length, the average lengths of exons are more similar in each group. An increasing body of evidence indicates that introns play a number of functional roles. Many introns contain functional non-coding RNAs, which play vital roles in fine-tuning gene expression [23] . Intron length appears to be positively correlated with expression in unicellular eukaryotes and negatively correlated with expression in multicellular eukaryotes [24] . Furthermore, it is a negative correlation between intron size and the level of expression of genes in nematodes and humans, which suggests that natural selection favors short introns in highly expressed genes to minimize the cost of transcription [25] . In contrast to intron size, the density of introns in a gene does not strongly depend on the level of gene expression [25] . Jeffares et al. found that intron density correlates with the logarithm of generation time. The organisms that reproduce rapidly tend to have fewer introns than organisms that have longer life
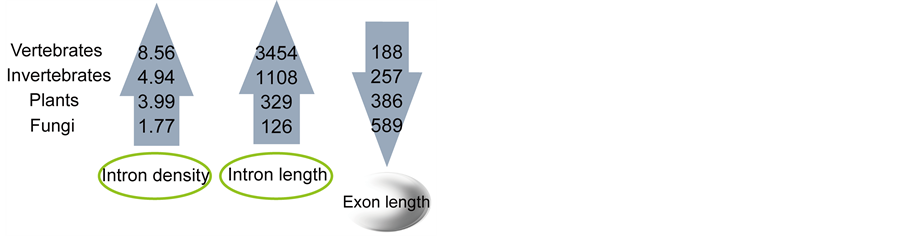
Figure 3. Trends of exon/intron length and density in eukaryotes.
cycles [8] . This might be a result of selection for rapid cell division or gene expression.
The exon-intron architecture has also been shown to influence splice-site recognition. The splice-site recognition is more efficient when introns or exons are small [21] [26] . Lower eukaryotes have a genomic architecture that is typified by small introns and flanking exons with variable lengths, suggesting that splice-site recognition occurs across the intron [27] . Our analysis showed some small introns and large exons in most fungi and some algae, which is consistent with a previous report [21] . Jeffares et al. proposed that some genes are apparently under selective pressure to minimize introns [8] . As an example, the average intron size is only 124 bp in Ostreococcus tauri, which is the world’s smallest free-living eukaryote known to date [28] . It is a plausiblestrategy that green alga could select small introns to economize energetic cost from decreased transcript length, adapting changing marine environment to bypass the constraints imposed by light or nutrient limitation [29] .
4.2. A Lineage-Specific Exon-Intron Structure in Teleosts
The number and length of introns varies greatly between different organisms. Intron sequences constitute 24% of mammalian genomes and more than 95% of human gene sequences [30] [31] . Our study shows that teleosts have more and smaller introns (<250 nt) than the other vertebrates (Figure 1 and Table S1). This specific exon-intron structure may be related with the specific gene duplication event in teleosts since the genomic complexity of the teleosts was assumed to be caused by the fish-specific whole-genome duplication event (FSGD) [32] . Remarkably, introns of zebrafish are much bigger compared to other teleosts. Large introns can present several problems for organisms, including the expense of transcription and the difficulty of splicing large introns [33] . Comparative analysis of teleost genome sequences has revealed an ancient intron size expansion in the zebrafish lineage [14] . One possible explanation for the small intron size in other teleosts could be the pressure to maintain a constrained genome size in these fast-replicating organisms. It could also be associated with the FSGD event that triggered the stunning diversity observed in teleost fishes (~29,000 species, nearly half of all vertebrates) [32] .
4.3. Abundance of Introns Are the Reservoir of AS Patterns in Eukaryotes
Our analysis showed that introns are arranged non-randomly in diverse eukaryotes. The vertebrate genes are typically split into numerous small exons interrupted by much larger introns. In our statistical analysis, there are relatively long introns and short exons in 32 vertebrate species. It is a trend that intron length has gradually expanded in fish, amphibians, reptiles, aves and mammals (Table S1). Our analysis suggests that vertebrate introns increased in length during vertebrate evolution. Previous studies indicated that intron length has gradually expanded among mammals, whereas the length of exons has remained relatively constant [34] . Some findings have led to speculations that the spliceosome in mammals recognizes primarily the exons in a process termed exon definition, as opposed to that in fungi where introns are kept short and are thought to be the recognized unit in a process termed intron definition [34] [35] .
Intron and exon lengths can reflect the constraints imposed by splicing recognition, based on whether the exon is identified through the intron or exon definition mechanism. A large number of long introns could be a reservoir of genetic diversity in vertebrates, and they can facilitate the selection of different splicing factors for AS during evolution. Different intron lengths are associated with different types of AS [36] . Long introns could hinder the activity of the splicesome through interfering with the proper positioning of the splicesome upon exon-intron junctions [36] . Short introns tend to flank weak splice sites and long introns tend to flank exons with strong splice sites [16] [37] . AS is more abundant in higher eukaryotes than in lower eukaryotes, and the percentage of genes that undergo AS is higher in vertebrates than in invertebrates [7] . Recently, a genome-wide investigation of AS profiles across organs and species in vertebrate species, suggested that AS changes may be a driving force towards an increase in cellular complexity during vertebrate speciation [38] . However, a latest research corroborated that boundary shifts and complete intron sliding are only accidental in eukaryotic genome evolution [39] . The number of introns in vertebrates is more than in the other lineages, so it is reasonable to assume that the prevalence of AS in vertebrates is pivotal for their higher phenotypic complexity [40] .
Overall, our results show both general and genome-specific features of the exon-intron structures of eukaryotic genes. The evolution of exon-intron structures increases in complexity from lower eukaryotes to higher eukaryotes. Some species-specific characteristics of genomes were found in many teleosts and lower eukaryotes. This re-analysis of eukaryotic genomic organization revealed some lineage-specific characteristics of exons and introns, which paves way for further research on the conservation and diversification of eukaryotic evolution.
Acknowledgements
We would like to thank Dr Yang Wang and Jun Yan for advice on this study. This work was supported by the following fund: Science Foundation of Health and Family Planning Commission of Hubei Provience (WJ2016-Y-02).
Cite this paper
Li, Y.F., Xu, Y.H. and Ma, Z.W. (2017) Comparative Analysis of the Exon-Intron Structure in Eukaryotic Genomes. Yangtze Medicine, 1, 50-64. https://doi.org/10.4236/ym.2017.11006
References
- 1. Roy, S.W. and Gilbert, W. (2006) The Evolution of Spliceosomal Introns: Patterns, Puzzles and Progress. Nature Reviews Genetics, 7, 211-221.
https://doi.org/10.1038/nrg1807 - 2. Graveley, B.R. (2001) Alternative Splicing: Increasing Diversity in the Proteomic World. Trends in Genetics, 17, 100-107.
https://doi.org/10.1016/S0168-9525(00)02176-4 - 3. Wang, E.T., Sandberg, R., Luo, S., Khrebtukova, I., Zhang, L., Mayr, C., Kingsmore, S.F., Schroth, G.P. and Burge, C.B. (2008) Alternative Isoform Regulation in Human Tissue Transcriptomes. Nature, 456, 470-476.
https://doi.org/10.1038/nature07509 - 4. Pan, Q., Shai, O., Lee, L.J., Frey, B.J. and Blencowe, B.J. (2008) Deep Surveying of Alternative Splicing Complexity in the Human Transcriptome by High-Throughput Sequencing. Nature Genetics, 40, 1413-1415.
https://doi.org/10.1038/ng.259 - 5. Stamm, S., Ben-Ari, S., Rafalska, I., Tang, Y., Zhang, Z., Toiber, D., Thanaraj, T.A. and Soreq, H. (2005) Function of Alternative Splicing. Gene, 344, 1-20.
- 6. Hertel, K.J. (2008) Combinatorial Control of Exon Recognition. The Journal of Biological Chemistry, 283, 1211-1215.
https://doi.org/10.1074/jbc.R700035200 - 7. Keren, H., Lev-Maor, G. and Ast, G. (2010) Alternative Splicing and Evolution: Diversification, Exon Definition and Function. Nature Reviews Genetics, 11, 345-355.
https://doi.org/10.1038/nrg2776 - 8. Jeffares, D.C., Mourier, T. and Penny, D. (2006) The Biology of Intron Gain and Loss. Trends in Genetics, 22, 16-22.
https://doi.org/10.1016/j.tig.2005.10.006 - 9. Schwartz, S.H., Silva, J., Burstein, D., Pupko, T., Eyras, E. and Ast, G. (2008) Large-Scale Comparative Analysis of Splicing Signals and Their Corresponding Splicing Factors in Eukaryotes. Genome Research, 18, 88-103.
https://doi.org/10.1101/gr.6818908 - 10. Sheth, N., Roca, X., Hastings, M.L., Roeder, T., Krainer, A.R. and Sachidanandam, R. (2006) Comprehensive Splice-Site Analysis Using Comparative Genomics. Nucleic Acids Research, 34, 3955-3967.
- 11. Iwata, H. and Gotoh, O. (2011) Comparative Analysis of Information Contents Relevant to Recognition of Introns in Many Species. BMC Genomics, 12, 45.
https://doi.org/10.1186/1471-2164-12-45 - 12. Roy, M., Kim, N., Xing, Y. and Lee, C. (2008) The Effect of Intron Length on Exon Creation Ratios during the Evolution of Mammalian Genomes. RNA, 14, 2261-2273.
https://doi.org/10.1261/rna.1024908 - 13. Kandul, N.P. and Noor, M.A. (2009) Large Introns in Relation to Alternative Splicing and Gene Evolution: A Case Study of Drosophila Bruno-3. BMC Genetics, 10, 67.
https://doi.org/10.1186/1471-2156-10-67 - 14. Moss, S.P., Joyce, D.A., Humphries, S., Tindall, K.J. and Lunt, D.H. (2011) Comparative Analysis of Teleost Genome Sequences Reveals an Ancient Intron Size Expansion in the Zebrafish Lineage. Genome Biology and Evolution, 3, 1187-1196.
https://doi.org/10.1093/gbe/evr090 - 15. Gelfman, S., Burstein, D., Penn, O., Savchenko, A., Amit, M., Schwartz, S., Pupko, T. and Ast, G. (2012) Changes in Exon-Intron Structure during Vertebrate Evolution Affect the Splicing Pattern of Exons. Genome Research, 22, 35-50.
https://doi.org/10.1101/gr.119834.110 - 16. Dewey, C.N., Rogozin, I.B. and Koonin, E.V. (2006) Compensatory Relationship between Splice Sites and Exonic Splicing Signals Depending on the Length of Vertebrate Introns. BMC Genomics, 7, 311.
https://doi.org/10.1186/1471-2164-7-311 - 17. Deutsch, M. and Long, M. (1999) Intron-Exon Structures of Eukaryotic Model Organisms. Nucleic Acids Research, 27, 3219-3228.
https://doi.org/10.1093/nar/27.15.3219 - 18. Bon, E., Casaregola, S., Blandin, G., Llorente, B., Neuveglise, C., Munsterkotter, M., Guldener, U., Mewes, H.W., Van Helden, J., Dujon, B. and Gaillardin, C. (2003) Molecular Evolution of Eukaryotic Genomes: Hemiascomycetous Yeast Spliceosomal Introns. Nucleic Acids Research, 31, 1121-1135.
https://doi.org/10.1093/nar/gkg213 - 19. Rodriguez-Medina, J.R. and Rymond, B.C. (1994) Prevalence and Distribution of Introns in Non-Ribosomal Protein Genes of Yeast. Molecular and General Genetics MGG, 243, 532-539.
https://doi.org/10.1007/BF00284201 - 20. Patel, A.A. and Steitz, J.A. (2003) Splicing Double: Insights from the Second Spliceosome. Nature Reviews Molecular Cell Biology, 4, 960-970.
https://doi.org/10.1038/nrm1259 - 21. Sterner, D.A., Carlo, T. and Berget, S.M. (1996) Architectural Limits on Split Genes. Proceedings of the National Academy of Sciences of the United States of America, 93, 15081-15085.
https://doi.org/10.1073/pnas.93.26.15081 - 22. Lim, L.P. and Burge, C.B. (2001) A Computational Analysis of Sequence Features Involved in Recognition of Short Introns. Proceedings of the National Academy of Sciences of the United States of America, 98, 11193-11198.
https://doi.org/10.1073/pnas.201407298 - 23. Rearick, D., Prakash, A., McSweeny, A., Shepard, S.S., Fedorova, L. and Fedorov, A. (2011) Critical Association of ncRNA with Introns. Nucleic Acids Research, 39, 2357-2366.
https://doi.org/10.1093/nar/gkq1080 - 24. Vinogradov, A.E. (2001) Intron Length and Codon Usage. Journal of Molecular Evolution, 52, 2-5. https://doi.org/10.1007/s002390010128
- 25. Castillo-Davis, C.I., Mekhedov, S.L., Hartl, D.L., Koonin, E.V. and Kondrashov, F.A. (2002) Selection for Short Introns in Highly Expressed Genes. Nature Genetics, 31, 415-418.
https://doi.org/10.1038/ng940 - 26. Berget, S.M. (1995) Exon Recognition in Vertebrate Splicing. The Journal of Biological Chemistry, 270, 2411-2414.
https://doi.org/10.1074/jbc.270.6.2411 - 27. Ruby, S.W. and Abelson, J. (1991) Pre-mRNA Splicing in Yeast. Trends in Genetics, 7, 79-85.
- 28. Derelle, E., Ferraz, C., Rombauts, S., Rouze, P., Worden, A.Z., Robbens, S., Partensky, F., Degroeve, S., Echeynie, S., Cooke, R., Saeys, Y., Wuyts, J., Jabbari, K., Bowler, C., Panaud, O., Piegu, B., et al. (2006) Genome Analysis of the Smallest Free-Living Eukaryote Ostreococcus tauri Unveils Many Unique Features. Proceedings of the National Academy of Sciences of the United States of America, 103, 11647-11652.
https://doi.org/10.1073/pnas.0604795103 - 29. Cardol, P., Bailleul, B., Rappaport, F., Derelle, E., Beal, D., Breyton, C., Bailey, S., Wollman, F.A., Grossman, A., Moreau, H. and Finazzi, G. (2008) An Original Adaptation of Photosynthesis in the Marine Green Alga Ostreococcus. Proceedings of the National Academy of Sciences of the United States of America, 105, 7881-7886.
https://doi.org/10.1073/pnas.0802762105 - 30. Lander, E.S., Linton, L.M., Birren, B., Nusbaum, C., Zody, M.C., Baldwin, J., Devon, K., Dewar, K., Doyle, M., FitzHugh, W., Funke, R., Gage, D., Harris, K., Heaford, A., Howland, J., Kann, L., et al. (2001) Initial Sequencing and Analysis of the Human Genome. Nature, 409, 860-921.
https://doi.org/10.1038/35057062 - 31. Venter, J.C., Adams, M.D., Myers, E.W., Li, P.W., Mural, R.J., Sutton, G.G., Smith, H.O., Yandell, M., Evans, C.A., Holt, R.A., Gocayne, J.D., Amanatides, P., Ballew, R.M., Huson, D.H., Wortman, J.R., Zhang, Q., et al. (2001) The Sequence of the Human Genome. Science, 291, 1304-1351.
https://doi.org/10.1126/science.1058040 - 32. Meyer, A. and Van de Peer, Y. (2005) From 2R to 3R: Evidence for a Fish-Specific Genome Duplication (FSGD). BioEssays, 27, 937-945.
https://doi.org/10.1002/bies.20293 - 33. Shepard, S., McCreary, M. and Fedorov, A. (2009) The Peculiarities of Large Intron Splicing in Animals. PLoS ONE, 4, e7853.
https://doi.org/10.1371/journal.pone.0007853 - 34. Schwartz, S. and Ast, G. (2010) Chromatin Density and Splicing Destiny: On the Cross-Talk between Chromatin Structure and Splicing. The EMBO Journal, 29, 1629-1636.
https://doi.org/10.1038/emboj.2010.71 - 35. Ast, G. (2004) How Did Alternative Splicing Evolve? Nature Reviews Genetics, 5, 773-782.
https://doi.org/10.1038/nrg1451 - 36. Kim, E., Magen, A. and Ast, G. (2007) Different Levels of Alternative Splicing among Eukaryotes. Nucleic Acids Research, 35, 125-131.
https://doi.org/10.1093/nar/gkl924 - 37. Weir, M. and Rice, M. (2004) Ordered Partitioning Reveals Extended Splice-Site Consensus Information. Genome Research, 14, 67-78.
https://doi.org/10.1101/gr.1715204 - 38. Barbosa-Morais, N.L., Irimia, M., Pan, Q., Xiong, H.Y., Gueroussov, S., Lee, L.J., Slobodeniuc, V., Kutter, C., Watt, S., Colak, R., Kim, T., Misquitta-Ali, C.M., Wilson, M.D., Kim, P.M., Odom, D.T., Frey, B.J., et al. (2012) The Evolutionary Landscape of Alternative Splicing in Vertebrate Species. Science, 338, 1587-1593.
https://doi.org/10.1126/science.1230612 - 39. Bocco, S.S. and Csürös, M. (2016) Splice Sites Seldom Slide: Intron Evolution in Oomycetes. Genome Biology and Evolution, 8, 2340-2350.
https://doi.org/10.1093/gbe/evw157 - 40. Kornblihtt, A.R., Schor, I.E., Allo, M., Dujardin, G., Petrillo, E. and Munoz, M.J. (2013) Alternative Splicing: A Pivotal Step between Eukaryotic Transcription and Translation. Nature Reviews Molecular Cell Biology, 14, 153-165.
https://doi.org/10.1038/nrm3525
Appendix
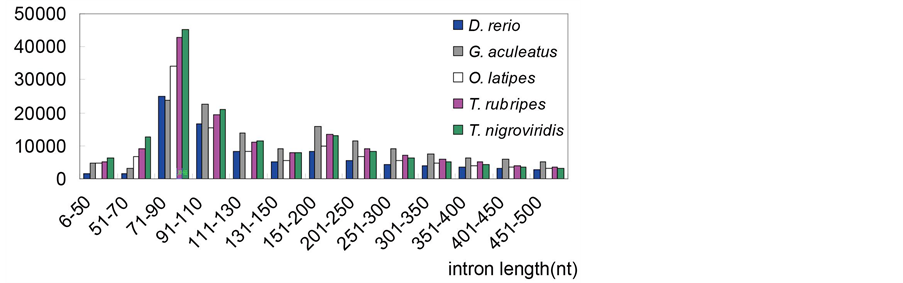
Figure S1. The distribution of intron length in the five teleost species.

Figure S2. A comparison of splicing signal motifs in six species within 6?50 nt introns.
Table S1. Synopsis of 72 genomes analyzed.
Table S2. Comparative analysis of eukaryotic genes with exons in some representative species.