Open Journal of Yangtze Oil and Gas
Vol.04 No.02(2019), Article ID:92006,13 pages
10.4236/ojogas.2019.42011
Characteristics of MBR Oily Sludge and Its Influence on Membrane Fouling under Two Aeration Modes
Yuansha Xie, Huiying Liu, Yan Wang, Jun Yi, Xianwei Wu, Mengxia Wu, Jie Dai*
School of Chemistry and Environmental Engineering, Yangtze University, Jingzhou, China

Copyright © 2019 by author(s) and Scientific Research Publishing Inc.
This work is licensed under the Creative Commons Attribution International License (CC BY 4.0).
http://creativecommons.org/licenses/by/4.0/


Received: December 3, 2018; Accepted: April 21, 2019; Published: April 24, 2019
ABSTRACT
A membrane bioreactor (MBR) with ordinary aeration (reactor R1) and a MBR with microporous aeration (reactor R2) are conducted in parallel to investigate the characteristics of oily sludge and its effect on membrane fouling. The results indicate that the order of membrane fouling rate from high to low is: reactor R1 dissolved oxygen (DO) (1 mg/L) > reactor R2 DO (1 mg/L) > reactor R1 DO (4 mg/L) > reactor R2 DO (4 mg/L). Membrane fouling rate is not related to oily sludge concentration but to oily sludge sedimentation performance and the small particle oily sludge is the key factor to affect the membrane fouling. The soluble microbial products (SMP) are examined by three-dimensional excitation-emission matrix (3DEEM) fluorescence spectra. 3DEEM spectra demonstrate that the main organic substances of the SMP in two reactors are tyrosine aromatic protein, fulvic acid-like substances and soluble microbial products under DO are1 mg/L and 4 mg/L, respectively. The proportion sum of fulvic acid-like substances and soluble microbial products is the key factor affecting membrane fouling, and membrane fouling accelerates as the ratio increases.
Keywords:
Aeration Mode, MBR, 3DEEM, Soluble Microbial Product, Membrane Fouling

1. Introduction
A membrane bioreactor (MBR) has the advantages of high efficiency and flexibility over traditional biological treatment [1] [2] [3] , while the problem of membrane fouling generated in MBR has limited the promotion of the technology in practical application during the operation [4] [5] [6] [7] . There are many factors that affect membrane fouling, some researchers think that the metabolites produced by microbial adhesion on the membrane surface are the main factors caused membrane fouling [8] [9] [10] [11] , and other researchers believe that the excess concentration of extracellular polymers (EPS) produced by activated sludge is the main pollution factor leading to membrane pore clogging [12] [13] [14] . At present, the mechanism of membrane fouling has not conclusive, but the direct relationship between sludge characteristics and membrane fouling rate has been recognized [15] [16] . The influence of process conditions on membrane fouling is generally achieved by regulating the characteristics of oily sludge, and it has become a research hotspot [17] [18] [19] .
Early studies have shown that the aeration device located at the bottom of the membrane module could reduce membrane fouling effectively [20] . At present, this idea has been incorporated into the design of MBR process, and the relationship between aeration mode and membrane fouling has attracted the attention of researchers. Yousef et al. [21] studied membrane fouling under different aeration rates and found that the membrane fouling rate was the lowest when the aeration rate was 151 L/h; Riccardo et al. [22] studied the effects of the formation of extracellular polymers on membrane fouling in three intermittent aeration conditions. It was found that the membrane fouling was different with each stage, and the greatest influence was the third stage. It was clear that the different aeration condition had a great influence on the membrane fouling [23] , but the most of the researches were devoted to the effects of aeration condition such as intermittent aeration and aeration rate on membrane fouling, and there was less attention to the effect of aeration bubbles. The deep relationship between sludge properties and membrane fouling caused by different aeration method has not been clarified.
In this study, self-assembled MBR is used to investigate the effect of microporous aeration and ordinary aeration on membrane fouling rate. MBR operating efficiency and the relationship between oily sludge properties and membrane fouling are studied when DO is set at 1 mg/L and 4 mg/L (guaranteed the maximum and minimum DO of processing efficiency) under microporous aeration and ordinary aeration conditions.
2. Materials and Methods
2.1. Raw Wastewater Characteristics
The wastewater is collected from an oil well fracturing fluid return tank in Karamay, China. The experimental wastewater is electrocatalyzed effluent and its characteristics are shown in Table 1.

Table 1. Characteristics of the influent to the MBRs.
2.2. Experimental Set-Up and Operating Conditions
The experimental system consists of two membrane bioreactors (MBRs) which are operated in parallel (Figure 1). Reactor R1 uses ordinary aeration, and Reactor R2 use microporous aeration. The size of the membrane device Is 50 cm × 36 cm × 52 cm. Each reactor has an identical effective volume of 77 L and has membrane module (from Hangzhou Kaihong Membrane Technology Co., Ltd.). The membrane modules are 23 cm × 23 cm with a mean pore size of 0.1 μm with an effective filtration area of 0.2 m2 and a membrane flux of 8 - 10 L/m2∙h for each module. Air diffusers are located at the bottom of each reactor to provide aeration demanded by the microorganisms and to induce a cross-flow velocity. The microporous aeration head has a mean pore size of 150 - 200 μm and ordinary aeration head has a mean pore size of 800 - 1500 μm. The mixture liquor is filtered by the membrane module under suction of the pump. The parameters of the experimental device are shown in Table 2.
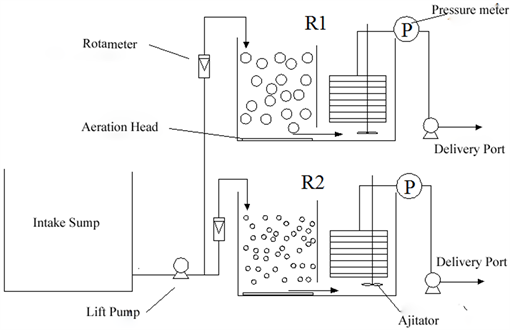
Figure 1. Process flow diagram of experimental facilities.
Table 2. Experimental equipment parameters of two MBRs.
During the operational process, the aeration head and the air diffuser work continuously, and the intermittent filtration mode of effluent is used, i.e., 1 min suction followed by 8 min relaxation is adopted for membrane in two MBRs. The hydraulic retention time (HRT) for each reactor is set for 10 h and the sludge retention time is 20 d. The activated sludge used in this study is collected from an aeration tank in Zhongshui Sewage Treatment Plant, Jingzhou, China.
2.3. Method of Analysis and Extraction of SMP
NH3-N, TN, COD, MLSS, pH and DO are measured by using their respective laboratory standard methods. Ammonia nitrogen (NH3-N) is measured according to the standard method by using visible spectrophotometer (V-5600, Metash Inc., China) [24] . Total nitrogen (TN) is determined by using anultraviolet-visible spectrophotometer (UV-2450, Shimadzu Inc, Japan) [25] . COD is measured by using the potassium dichromate method [26] . pH values, DO and water temperature are measured by using a dissolved oxygen analyzer (YSI550A, YSI Inc, USA). MLSS is measured in accordance with the standard method (gravimetric method). Suspended oily sludge particle size is measured by using a laser particle analyzer (S3500, Microtrac Inc., USA).
For the extraction of SMP, mixed liquor samples are collected from the aeration room of two MBRs when the systems are stable. The mixed liquor samples were are initially centrifuged for 15 min at 5000 r/min. The supernatant obtained from each sample is filtrated through 0.45 μm cellulose acetate membrane. The filtrate is collected as SMP sample. The concentration and composition of EPS are analyzed by 3DEEM fluorescence spectra.
2.4. 3DEEM Fluorescence Spectra
All the 3DEEM spectra are measured by using a luminescence spectrometry (LS-55, Perkin-Elmer, Japan). In this study, 3DEEM spectra are collected with corresponding scanning emission wavelength (Em) from 280 nm to 600 nm by varying the excitation wavelength (Ex) from 200 nm to 500 nm. The excitation and emission slits are maintained at 10 nm and the scanning speed is set at 1200 nm/min in this study. The spectra of Milli-Q water is recorded to eliminate water Raman scattering and to reduce other background noise.
3. Results and Discussion
3.1. Removal of Pollutants under Two Kinds of Aeration Conditions
The two MBR reactors are operated for 60 days under the conditions of DO of 1 mg/L and 4 mg/L. The removal efficiency of each pollutant is shown in Figure 2. Figure 2(a) depicts when DO is 1 mg/L, the removal rates of chemical oxygen demand (COD) between Reactor R1 and Reactor R2 are stable, with at about 80%; When DO is 4 mg/L, the removal rate of Reactor R1 is better than that of Reactor R2, and the microorganisms in Reactor R1 have slightly higher activity because the ordinary aeration can provide higher dissolved oxygen. Figure 2(b) illustrates the removal rates of NH3-N by Reactor R1 and Reactor R2 is basically the same, when DO is 1 mg/L and 4 mg/L, the average removal rates are 85% and 93% respectively. Figure 2(c) shows for the removal of total nitrogen (TN), the in Reactor R1 it is higher than the that in Reactor R2 when the DO is 1 mg/L, because when the DO is not high, the ordinary aeration produces more bubbles, which will enhance the degree of internal turbulence and denitrification was is more sufficient; whereas when the DO is 4 mg/L, the removal rates of Reactor R1 and Reactor R2 are not much different, the reason for this is the sludge in the two reactors mixed evenly and the growth environment is also consistent.
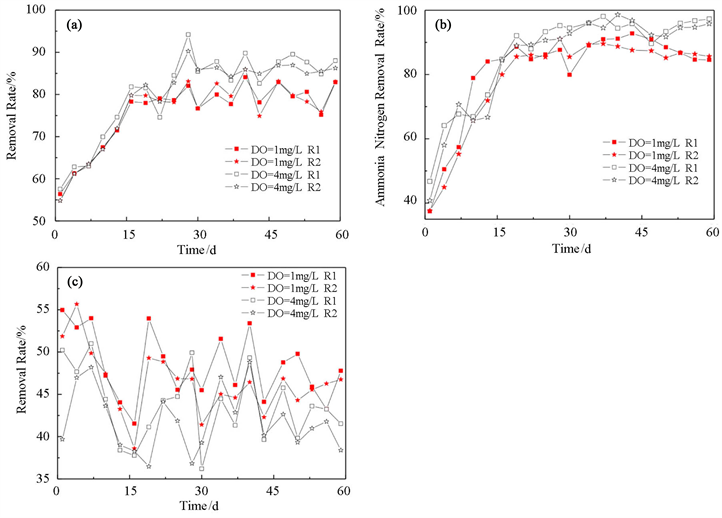
Figure 2. Pollutants removal effect under two kinds of aeration mode.
Comparing the removal of COD, NH3-N and TN in Reactor R1 at 1 mg/L and 4 mg/L, it is found that with the increase of DO, the removal rates of COD and NH3-N increase, while the removal rate of TN decreases. This is because of DO increases, the degradation rate and nitrification process of the internal carbonization bacteria in the reactor is accelerated, and the denitrification process is suppressed. The removal of COD, NH3-N and TN in Reactor R2 at 1 mg/L and 4 mg/L is similar to that of Reactor R1, but the change is slightly slower, due to the mitigation of bubble turbulence caused by microporous aeration.
3.2. The Condition of Two Kinds of Aeration Membrane Pollution
Figure 3 shows the difference of trans-membrane pressure (TMP) in Reactor R1 and Reactor R2 changes with the running time. As shown in the figure, when DO is 1 mg/L, Reactor R1 shows the membrane fouling at 15th day and increases at 21st day; Reactor R2 shows the membrane fouling at 21st day and increases at 33rd day. When DO is 4 mg/L, the sequence of membrane fouling of Reactor R1 and Reactor R2 is consistent with that of DO of 1 mg/L, and membrane fouling begins to occur after 40 days of Reactor R2 operation. The results demonstrate that under the same DO conditions, MBR operation in microporous aeration can alleviate more membrane fouling than ordinary aeration, because microporous aeration is more moderate, microbial impact is more moderate, and microporous aeration is more moderate, the microbial impact is more moderate, and the high molecular weight hydrophobic extracellular polymer (EPS) produced by microorganisms in the sludge mixture is less. Therefore, membrane fouling is lighter under microporous aeration condition.
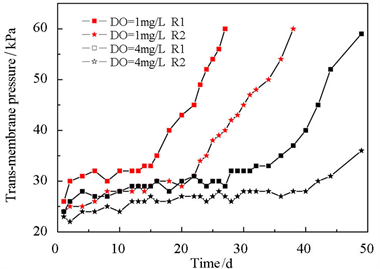
Figure 3. The TMP variation of different conditions of the MBR.
It can be seen from Figure 3 that for DO from 1 mg/L to 4 mg/L, the degree of membrane fouling of Reactor R1 and Reactor R2 is significantly reduced, the higher the DO is, the greater the fluid turbulence inside the reactor is. To some extent, the formation of concentration polarization on the outside of the membrane module is prevented, thereby delaying membrane fouling. This indicates that adjusting DO value is an effective means to alleviate the MBR membrane contamination, which deserves further study.
3.3. Relationship between Sludge Concentration and Sedimentation under Different Aeration Conditions
Table 3 shows the concentration and sedimentation performance of sludge in two reactors after the stable operation under different aeration conditions. The mixed liquid suspension solid concentration (MLSS) in two reactors is not much different when the DO is 1 mg/L or 4 mg/L. According to the curve of membrane fouling in the Figure 3, it is found that the MLSS in Reactor R1 and Reactor R2 is less changed much, but the membrane fouling has is changed, indicating that the MLSS value has no obvious relationship with the membrane fouling. It can also be seen from the Table 3 that when the DO is 1 mg/L, the sludge volume index (SVI) value in Reactor R1 and Reactor R2 are between 50 and 120 mL/L, and the sedimentation performance of the sludge is very good. DO can provide suitable microbial growth conditions; when DO is 4 mg/L, the sedimentation performance of Reactor R2 is still good, and the sedimentation performance of Reactor R1 is deteriorated. This is because when DO is 4 mg/L, the large bubbles in Reactor R1 cause the activated sludge in a state of tumbling for a long time, and thus partial sludge swelling occurs. Combined the SVI value of Reactor R1 with the curve of membrane fouling in Figure 3, when DO in Reactor R1 changes from 1 mg/l to 4 mg/L, the SVI value changes from 101 mL/g to 159 mL/g, and the sedimentation is deteriorated and membrane fouling is alleviated. This may be due to the proliferation of some filamentous bacteria [27] [28] , resulting in the formation of a small amount of granular sludge in the sludge, due to its high activity on the degradation of membrane surface pollutants, it achieves a reduction in membrane fouling. Comparing the SVI value and membrane fouling of DO in Reactor R2 at 1 mg/L and 4 mg/L, the SVI value is ranged from 107 mL/g to 84 mL/g, and membrane fouling is reduced, it is probably due to the fact that the microorganisms are in a more active state at a DO level of 4 mg/L. Therefore, under the same aeration mode, the SVI value of the sludge is related to the membrane fouling rate.
Table 3. Oily sludge concentration and settling properties.
Comparing the SVI values of Reactor R1 and Reactor R2 at a DO of 1 mg/L, it is known that the SVI value is slightly higher when microporous aeration is used, and the membrane fouling is alleviated, which confirms the above conclusion. Comparing Reactor R1 and Reactor R2 with DO of 4 mg/L, it is found that the SVI value is higher and the membrane fouling of Reactor R1 is higher. This is because the excessive SVI value in Reactor R1 caused some sludge to swell and the membrane fouling is slightly serious. Therefore, it is determine that the factors affecting the membrane fouling of the MBR system are SVI values rather than MLSS, and when SVI value is within the normal range, there is a certain relationship between the membrane fouling speed.
3.4. Relationship between Sludge Particle Size under Different Aeration Conditions
Oily sludge particle size distributions during the operation of two MBRs under different aeration conditions are shown in Figure 4. It is found that when DO is 1 mg/L, the median diameters of the sludges in Reactor R1 and Reactor R2 are 42.21 µm and 97.84 µm, respectively. When DO is 4 mg/L, the median diameters of the sludges in Reactor R1 and Reactor R2 are 101.40 µm and 105.90 µm, respectively. It can be seen that when DO is low, the median diameter of the sludge varies greatly, and when DO is high, the difference is not large. This is because when DO is low, the difference in aeration efficiency between the two is large, the ordinary aeration efficiency is low, a large number of bubbles are generated, and the shear stress caused is stronger, so the sludge size of Reactor R1 is smaller. The sludge of Reactor R2 has a large particle size. When DO is 4 mg/L, there are more bubbles in the two reactors, and the shear stress is larger, so the sludge particle size is not much different. It can also be seen from the figure that under the two aeration modes, when DO is raised to 4 mg/L, the sludge particle size is increased, which may also be a cause of sludge swelling in Reactor R1. It has been reported in the literature that in the MBR process, the strong shear stress generated by high aeration intensity can reduce the sludge particle size, and the smaller the sludge particle is, the more serious the membrane fouling is induced [29] [30] [31] . When DO is 1 mg/L, the smaller sludge size in Reactor R1 causes more serious membrane fouling. For the MBR under the same aeration mode, it can be seen from the figure that when DO is changed from 1 mg/L to 4 mg/L, the sludge particle size is increased. It can be inferred that when the DO was 4 mg/L, the large sludge particle size can alleviate the membrane fouling to a certain extent.
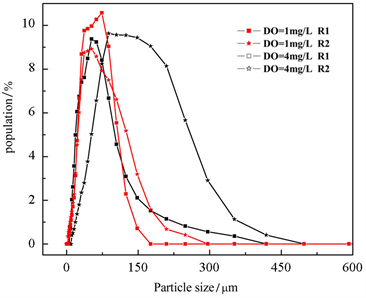
Figure 4. Particle size distribution (PSD) of oily sludge.
3.5. Analysis of SMP Characteristics under Different Aeration Conditions
It is reported that part of the reason for the membrane fouling during MBR operation is the concentration of extracellular polymer (EPS) in the sludge mixture [32] [33] . In order to explore the deeper causes of MBR membrane fouling, on the 15th day after the stable operation of the experiment, samples of oily sludge mixture are taken from two MBRs, and soluble microbial products (SMP) in each sample is extracted, and then deep analysis by 3DEEM spectroscopy, the fluorescent charts are shown in Figure 5. Each 3DEEM gives spectral information regarding the different chemical compositions of the sample. Two major peaks can be identified from the fluorescence spectra of SMP. For all samples, three main peaks are located at Ex/Em of 205 - 210/350 - 365 nm (Peak A), 260 - 265/350 - 365 nm (Peak B) and 325 - 330/430 - 440 nm (Peak C), respectively. There is also a shoulder Peak D. According to a classification scheme by Chen et al. [34] , the first peak (Peak A) and second peak (Peak B) are located in Regions II and IV whose fluorescence is due to the presence of tyrosine aromatic protein and soluble microbial by-product-like products compounds respectively. The third peak (Peak C) is located in Region V (humic acid-like), whereas the fourth peak (Peak D) is located in Region III, whose fluorescence is fulvic acid-like organics.
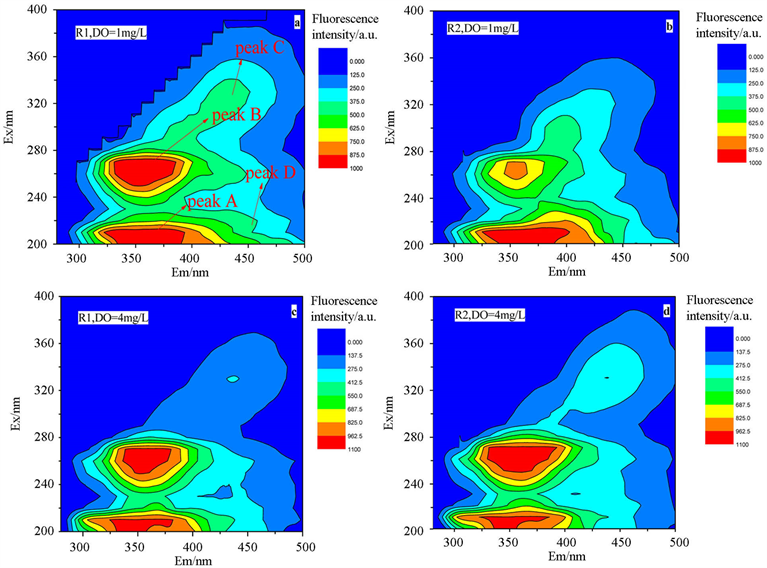
Figure 5. EEM fluorescence spectra of oily sludge SMP under different conditions.
When DO is 1 mg/L, the fluorescence intensity (FI) of Region IV in R2 is significantly lower than that of R1. When DO is 4 mg/L, the FI of Region III is lower than that of DO of 1 mg/L, and R2 is lower than R1. It is found that the sum of the proportions of Regions III and IV has a significant positive correlation with the membrane fouling rate. The results demonstrate that the key factor leading to membrane fouling is the content rate sum of III and IV of SMP in the oily sludge mixture fluid during the operation of MBR, that is, the content rate sum of the fulvic acid-like substances and soluble microbial products, and membrane fouling are accelerated as the ratio is increased.
4. Conclusions
1) When DO is 1 mg/L, it is found that COD removal efficiency of two MBRs are almost the same. When DO is 4 mg/L, the COD removal rate in Reactor R1 is better than that in Reactor R2. When DO is changed, there is a slight variation in NH3-N removal rate in two systems. When DO is 1 mg/L, the TN removal rate in Reactor R1 is higher than that in Reactor R2, whereas DO is 4 mg/L, the removal rates in Reactor R1 and Reactor R2 are basically the same.
2) The membrane fouling in Reactor R2 is slower relatively as compared to Reactor R1 when DO is set for either 1 mg/L or 4 mg/L. Under the condition of the same aeration bubble, when DO is 4 mg/L rather than 1 mg/L, the membrane fouling rate is slow.
3) The characteristics of MBR oily sludge mixture fluid under micropore aeration and ordinary aeration are analyzed. It is found that concentration of oily sludge has nothing to do with the membrane fouling, however, sedimentation of oily sludge can have a certain impact on membrane fouling, and the small particle size oily sludge caused by ordinary aeration is an important parameter as it can affect membrane fouling.
4) 3DEEM spectra demonstrate that the main organic substances of the SMP in two reactors are tyrosine aromatic protein, fulvic acid-like substances and soluble microbial products under DO are 1 mg/L and 4 mg/L, respectively.
5) 3DEEM fluorescence spectroscopy of SMP in the oily sludge mixture fluid is found that the key factor leading to membrane fouling is the content rate sum of III and IV, that is, the content rate sum of the fulvic acid-like substances, soluble microbial products and membrane fouling are accelerated as the ratio is increased.
Acknowledgements
We gratefully acknowledge the financial support by the National Natural Science Foundation of China (No. 21173026) and the Key Program of the Natural Science Foundation of Hubei Province (No. 2013CFA107).
Conflicts of Interest
The authors declare no conflicts of interest regarding the publication of this paper.
Cite this paper
Xie, Y.S., Liu, H.Y., Wang, Y., Yi, J., Wu, X.W., Wu, M.X. and Dai, J. (2019) Characteristics of MBR Oily Sludge and Its Influence on Membrane Fouling under Two Aeration Modes. Open Journal of Yangtze Gas and Oil, 4, 144-156. https://doi.org/10.4236/ojogas.2019.42011
References
- 1. Sheng, C. (2011) Application of Submerged Hollow Fiber Membrane in Membrane Bioreactors: Filtration Principles, Operation, and Membrane Fouling. Desalination, 283, 31-39. https://doi.org/10.1016/j.desal.2011.03.025
- 2. Li, J., Yu, D. and Wang, D. (2011) Performance of Membrane Bioreactor (MBR) Process Treating Wastewater Containing Different Content of Seawater. Environmental Engineering and Management Journal, 10, 887-891. https://doi.org/10.30638/eemj.2011.124
- 3. Johir, M.A., Vigneswaran, S., Sathasivan, A., Kandasamy, J. and Chang, C.Y. (2012) Effect of Organic Loading Rate on Organic Matter and Foulant Characteristics in Membrane Bio-Reactor. Bioresource Technology, 113, 154-160. https://doi.org/10.1016/j.biortech.2011.12.002
- 4. Zhang, J., Zhou, J., Liu, Y. and Fane, A.G. (2010) A Comparison of Membrane Fouling under Constant and Variable Organic Loadings in Submerge Membrane Bioreactors. Water Research, 44, 5407-5413. https://doi.org/10.1016/j.watres.2010.06.045
- 5. Bai, L., Liu, C. and Lan, W. (2011) Research of Membrane Fouling Performance in a Submerged Double-Shaft Rotary Anaerobic Membrane Bioreactor. Environmental Engineering and Management Journal, 10, 867-873. https://doi.org/10.30638/eemj.2011.121
- 6. Kale, M.M., Singh, K.S., Debnath, D. and Connor, D. (2017) Sludge-Bed Anaerobic Membrane Bioreactor Treating Prehydrolysis Liquor (PHL): Correlation of cATP (TM) with Performance Parameters. Water Quality Research Journal, 52, 42-50. https://doi.org/10.2166/wqrjc.2017.004
- 7. Meng, F., Zhang, S., Oh, Y., Zhou, Z., Shin, H.S. and Chae, S.R. (2017) Fouling in Membrane Bioreactors: An Updated Review. Water Research, 114, 151-180. https://doi.org/10.1016/j.watres.2017.02.006
- 8. Meng, F., Chae, S., Drews, A., Kraume, M., Shin, H.S. and Yang, F. (2009) Recent Advances in Membrane Bioreactors (MBRs): Membrane Fouling and Membrane Material. Water Research, 43, 1489-1512. https://doi.org/10.1016/j.watres.2008.12.044
- 9. Berman, T., Mizrahi, R. and Dosoretz, C.G. (2011) Transparent Exopolymer Particles (TEP): A Critical Factor in Aquatic Biofilm Initiation and Fouling on Filtration Membranes. Desalination, 276, 184-190. https://doi.org/10.1016/j.desal.2011.03.046
- 10. Xu, Q., Ye, Y., Chen, V. and Wen, X. (2015) Evaluation of Fouling Formation and Evolution on Hollow Fibre Membrane: Effects of Ageing and Chemical Exposure on Biofoulant. Water Research, 68, 182-193. https://doi.org/10.1016/j.watres.2014.10.004
- 11. Martín-Pascual, J., Reboleiro-Rivas, P., Muñio, M.M., González-López, J. and Poyatos, J.M. (2016) Membrane Fouling of a Hybrid Moving Bed Membrane Bioreactor Plant to Treat Real Urban Wastewater. Chemical Engineering & Processing Process Intensification, 104, 112-119. https://doi.org/10.1016/j.cep.2016.02.014
- 12. Bing, W., Shan, Y., Anthony, G. and Fane (2011) Microbial Community Developments and Biomass Characteristics in Membrane Bioreactors under Different Organic Loadings. Bioresource Technology, 102, 6808-6814. https://doi.org/10.1016/j.biortech.2011.04.012
- 13. Sun, F.Y., Li, P., Li, J., Li, H.J., Ou, Q.M. and Sun, T.T. (2015) Hybrid Biofilm-Membrane Bioreactor (Bf-MBR) for Minimization of Bulk Liquid-Phase Organic Substances and Its Positive Effect on Membrane Permeability. Bioresource Technology, 198, 772-780. https://doi.org/10.1016/j.biortech.2015.09.089
- 14. Su, X. and Zhang, Z. (2018) Structural Characteristics of Extracellular Polymeric Substances (EPS) in Membrane Bioreactor and Their Adsorptive Fouling. Water Science & Technology, 77, 1537-1546. https://doi.org/10.2166/wst.2018.033
- 15. Boltz, J.P. and Daigger, G.T. (2010) Uncertainty in Bulk-Liquid Hydrodynamics and Biofilm Dynamics Creates Uncertainties in Biofilm Reactor Design. Water Science & Technology, 61, 307-316. https://doi.org/10.2166/wst.2010.829
- 16. Hu, J., Xu, K., Ding, L., Xu, Y., Li, K. and Ren, H. (2012) Effect of Carriers on Sludge Characteristics and Mitigation of Membrane Fouling in Attached-Growth Membrane Bioreactor. Bioresource Technology, 122, 35-41. https://doi.org/10.1016/j.biortech.2012.05.029
- 17. Feng, Z.J., Wu, M., Sun, M.X., Liu, H.Y., Zhang, Y.Z. and Dai, J. (2016) The Effects of Different Carriers on Removal Performance and Membrane Fouling by HMBR in Treating Sewage with Low Carbon-to-Nitrogen Ratio. Process Safety and Environmental Protection, 102, 768-776. https://doi.org/10.1016/j.psep.2016.06.019
- 18. Chan, L.L.T., Chou, C.P. and Chen, J. (2016) Hybrid Model Based Control for Membrane Filtration Process. IFAC-PapersOnLine, 49, 1085-1090. https://doi.org/10.1016/j.ifacol.2016.07.347
- 19. Abbasi, H., élysée, C., Labelle, M.A., Laflamme, E., Gadbois, A. and Laporte, A. (2017) Organic Matter Capture by a High-Rate Inoculum-Chemostat and Mbbr System. Water Quality Research Journal, 52, 166-177.
- 20. Dalmau, M., Monclús, H., Gabarrón, S., Rodriguez-Roda, I. and Comas, J. (2014) Towards Integrated Operation of Membrane Bioreactors: Effects of Aeration on Biological and Filtration Performance. Bioresource Technology, 171, 103-112. https://doi.org/10.1016/j.biortech.2014.08.031
- 21. Rahimi, Y., Torabian, A., Mehrdadi, N., Habibi-Rezaie, M., Pezeshk, H. and Nabi-Bidhendi, G.R. (2011) Optimizing Aeration Rates for Minimizing Membrane Fouling and Its Effect on Sludge Characteristics in a Moving Bed Membrane Bioreactor. Journal of Hazardous Materials, 186, 1097-1102. https://doi.org/10.1016/j.jhazmat.2010.11.117
- 22. Campo, R., Capodici, M., Bella, G.D. and Torregrossa, M. (2017) The Role of EPS in the Foaming and Fouling for a MBR Operated in Intermittent Aeration Conditions. Biochemical Engineering Journal, 118, 41-52. https://doi.org/10.1016/j.bej.2016.11.012
- 23. Barwal, A. and Chaudhary, R. (2017) Optimization of Operational Parameters in Moving Bed Biofilm Reactor with Low Cost Polystyrene Biocarrier by the Response Surface Method. Water Quality Research Journal, 52, 26-41. https://doi.org/10.2166/wqrjc.2017.026
- 24. Chinese HJ535-2009 (2009) Water Quality—Determination of Ammonia Nitrogen-Nessler’s Reagent Spectrophotometry.
- 25. Chinese GB11894-89 (1989) Water Quality—Determination of Total Nitrogen—Alkaline Potassium Persulfate Digestion UV Spectrophotometric Method.
- 26. Chinese GB11914-89 (1989) Water Quality—Determination of the Chemical Oxygen Demand—Dichromate Method.
- 27. Villain, M. and Marrot, B. (2013) Influence of Sludge Retention Time at Constant Food to Microorganisms Ratio on Membrane Bioreactor Performances under Stable and Unstable State Conditions. Bioresource Technology, 128, 134-144. https://doi.org/10.1016/j.biortech.2012.10.108
- 28. Sun, Y., Shen, Y.X., Liang, P., Zhou, J., Yang, Y. and Huang, X. (2014) Linkages between Microbial Functional Potential and Wastewater Constituents in Large-Scale Membrane Bioreactors for Municipal Wastewater Treatment. Water Research, 56, 162-171. https://doi.org/10.1016/j.watres.2014.03.003
- 29. Jamal Khan, S., Visvanathan, C. and Jegatheesan, V. (2012) Effect of Powdered Activated Carbon (PAC) and Cationic Polymer on Biofouling Mitigation in Hybrid MBRs. Bioresource Technology, 113, 165-168. https://doi.org/10.1016/j.biortech.2011.12.107
- 30. Wang, Z., Meng, F., He, X., Zhou, Z., Huang, L.N. and Liang, S. (2014) Optimisation and Performance of NaClO-Assisted Maintenance Cleaning for Fouling Control in Membrane Bioreactors. Water Research, 53, 1-11. https://doi.org/10.1016/j.watres.2013.12.040
- 31. Tian, Y., Li, H., Li, L., Su, X., Lu, Y. and Zuo, W. (2015) In-Situ Integration of Microbial Fuel Cell with Hollow-Fiber Membrane Bioreactor for Wastewater Treatment and Membrane Fouling Mitigation. Biosensors and Bioelectronics, 64, 189-195. https://doi.org/10.1016/j.bios.2014.08.070
- 32. Tian, Y., Li, Z. and Lu, Y. (2012) Changes in Characteristics of Soluble Microbial Products and Extracellular Polymeric Substances in Membrane Bioreactor Coupled with Worm Reactor: Relation to Membrane Fouling. Bioresource Technology, 122, 62-69. https://doi.org/10.1016/j.biortech.2012.05.009
- 33. Su, X., Tian, Y., Sun, Z., Lu, Y. and Li, Z. (2013) Performance of a Combined System of Microbial Fuel Cell and Membrane Bioreactor: Wastewater Treatment, Sludge Reduction, Energy Recovery and Membrane Fouling. Biosensors and Bioelectronics, 49, 92-98. https://doi.org/10.1016/j.bios.2013.04.005
- 34. Chen, W., Westerhoff, P., Leenheer, J. and Booksh, K. (2003) Fluorescence Excitation-Emission Matrix Regional Integration to Quantify Spectra for Dissolved Organic Matter. Environmental Science & Technology, 37, 5701-5710. https://doi.org/10.1021/es034354c