Journal of Agricultural Chemistry and Environment
Vol.05 No.04(2016), Article ID:71745,12 pages
10.4236/jacen.2016.54022
Evaluation of Accuracy and Precision of IRMS by Using Standard Materials and Applications
J. Y. Hwang1*, B. K. Kim2, M. S. Kim2, J. W. Choi2, T. S. Kim1, W. S. Lee3
1Soil and Groundwater Research Division, National Institute of Environmental Research, Environment Research Complex, Incheon, Republic of Korea
2Environmental Measurement & Analysis Center, National Institute of Environmental Research, Environment Research Complex, Incheon, Republic of Korea
3Integrated Pollution Prevention and Control Task Force, National Institute of Environmental Research, Environment Research Complex, Incheon, Republic of Korea

Copyright © 2016 by authors and Scientific Research Publishing Inc.
This work is licensed under the Creative Commons Attribution International License (CC BY 4.0).
http://creativecommons.org/licenses/by/4.0/


Received: September 28, 2016; Accepted: October 31, 2016; Published: November 3, 2016
ABSTRACT
The isotope ratio mass spectrometer (IRMS) is an instrument that measures both of the elemental contents and isotope ratios of hydrogen, oxygen, carbon, nitrogen and sulfur in environmental samples at the same time. In this study, we want to try to get two main goals; first, to make up for setting the analytical conditions such as accuracy and precision, second, to apply for comparing of the carbon and nitrogen isotope ratio of sediments in the abandoned mine located in middle province of Korea. For the first goal, a recently introduced IRMS was used to analyze CRM (certified reference materials), which helped to make up the analytical conditions of carbon and nitrogen isotope ratios. So, the accuracy and precision of isotope ratios and elemental contents were also assessed simultaneously, and also the results were very satisfactory. The analytical results of carbon reference materials (EMA-P2) showed an accuracy of −2.801 × 10‰ ± 0.01‰ (2σ) and a precision of 0.009‰ in the mass range from 0.008 μg - 0.162 μg. For nitrogen reference materials (EMA-P2), an accuracy of −1.632‰ ± 0.72‰ (2σ) was obtained in the mass range from 0.082 - 0.162 mg. These values of accuracy and precision are higher than those reported by other studies. For the second goal, carbon and nitrogen isotopes in river sediment near abandoned mines were analyzed based on the established analytical conditions. The result suggested that carbon isotope ratios ranged from −22.5‰ - −27.5‰ and nitrogen isotope ratios from −1.9‰ - 7.9‰. By comparing the isotope ratios and sampling sites of sediment, we know that the nitrogen isotope values in samples of entrance area of mine are greater than those of the farm house area, which is indicating the effects of organic materials. So, we could guess that the newly accumulated organic materials were much more in the farm house area than mine entrance area. And a result of this study, the accuracy and precision tests of IRMS using certified reference materials were very satisfactory and optimum analytical conditions were established well. And also, it was found that the applications of isotopic analysis for environmental samples by using the IRMS could be very useful for the studies on tracing pollution sources.
Keywords:
Stable Isotope, Carbon Isotope, Nitrogen Isotope, Precision, Accuracy

1. Introduction
A few decades ago, mass spectrometry was considered as a very difficult and expensive study area because its complex and highly expensive instrument were maintained and operated by a few dedicated technicians and its output understood by only a few academics. But in recent years, a revolution occurred and MS became an affordable, easy to use and routine technique in many laboratories, and one of the MSs is IRMS (isotope-ratio mass spectrometer). IRMS is a specialization of mass spectrometry, in which mass spectrometric methods are used to measure the relative abundance of isotopes in a given sample [1] [2] . This technique has two different applications in the earth and environmental sciences. The analysis of stable isotopes is normally concerned with measuring isotopic variations arising from mass-dependent isotopic fractionation in natural systems. On the other hand, radiogenic isotope analysis involves measuring the abundances of decay-products of natural radioactivity, and is used in most long-lived radiometric dating methods [3] . The isotope-ratio mass spectrometer (IRMS) allows the precise measurement of mixtures of naturally occurring isotopic sources such as: soils, plants, grains, animals which is including all kinds of environmental matters [4] . Generally, most instruments used for precise determination of isotope ratios are of the magnetic sector type. This type of analyzer is superior to the quadrupole type in this field of research for two reasons. First, it can be set up for multiple-collector analysis, and second, it gives high-quality peak shapes. Both of these considerations are important for isotope-ratio analysis at very high precision and accuracy. The analysis process of IRMS can be divided into four steps: combustion or thermal diversion of the sample material using the elemental analyser, introduction of evolved gases into the ion source of mass spectrometer via the interface, ionization of the gas molecules followed by separation and detection of the ions in the mass spectrometer and evaluation of the raw data.
Earlier studies on isotopes were limited to research areas such as geology related to the creation of the earth; paleoclimatology; creation of lakes by glaciers [5] [6] ; and paleoclimate reconstruction by measuring hydrogen and oxygen delta values in ground water around glaciers. Technological progress in isotopic analysis equipment since the 1950s, however, has advanced research methods and performances, extending the use of isotopic data into more various areas. In recent years, isotopic analysis began to be applied to identifying contamination sources by comparing variability in oxygen and nitrogen isotope delta values of  (δ18O, δ15N) in natural and ground water. Isotope ratios of organic matters, based on which nutrition in lakes and rivers is determined, are also analyzed for investigating progress in lake eutrophication, seasonal variations in nutrients and tracing pollution sources [7] [8] [9] . Such an extension of isotopic analysis into new research areas contributed to establishing the macro-isotope ratio mass spectrometry as an area of environmental science [10] [11] [12] . Recently, IRMS has a wide range of applications for the forensic science; determining whether sample of chemically similar such drugs, explosives, fibres, paints, inks, distinguishing counterfeit products from genuine materials, comparing putative reactants with contraband products, identifying the source of pollutants such as oil spills, monitoring atmosphere gases to distinguishing between natural and anthropogenic sources. Based on the bases of IRMS, this study was conducted to assess the accuracy and precision of carbon and nitrogen isotope ratios of produced certified reference materials measured by isoprime IRMS, a recently introduced isotope ratio mass spectrometer (IRMS) [13] [14] . Carbon and nitrogen isotope ratios of stream sediments and soils near an abandoned mine were also compared in order to evaluate the applicability of the established isotopic analysis to environmental samples [15] [16] [17] .
2. Materials and Method
Certified reference materials used for assessing the accuracy and precision of isotopic analysis (Table 1) and sulfanilamide used for analyzing elements (Table 2) were both dried in the oven at 70˚C for 24 hours [18] [19] [20] [21] . For isotope ratios, delta values (δ13C, δ15N) were calculated based on Equation (1):
 (1)
(1)
In the above equation, R means 13C/12C and 15N/14N as the ratio of heavy isotope to light isotope; x stands for samples; and std. is an abbreviated form of standard. Fractionation factor ε was applied, so as to use fractionation factor αapplied (Equation (3)) of

Table 1. Delta values of reference standard and IRMS certified reference materials.
*Standard deviation (σ).
Table 2. Elemental contents (%) of IRMS certified materials and EA standards.
working standards and samples to calculate fractionation factor εapplied (Equation (4)) [22] [23] .
 (2)
(2)
 (3)
(3)
 (4)
(4)
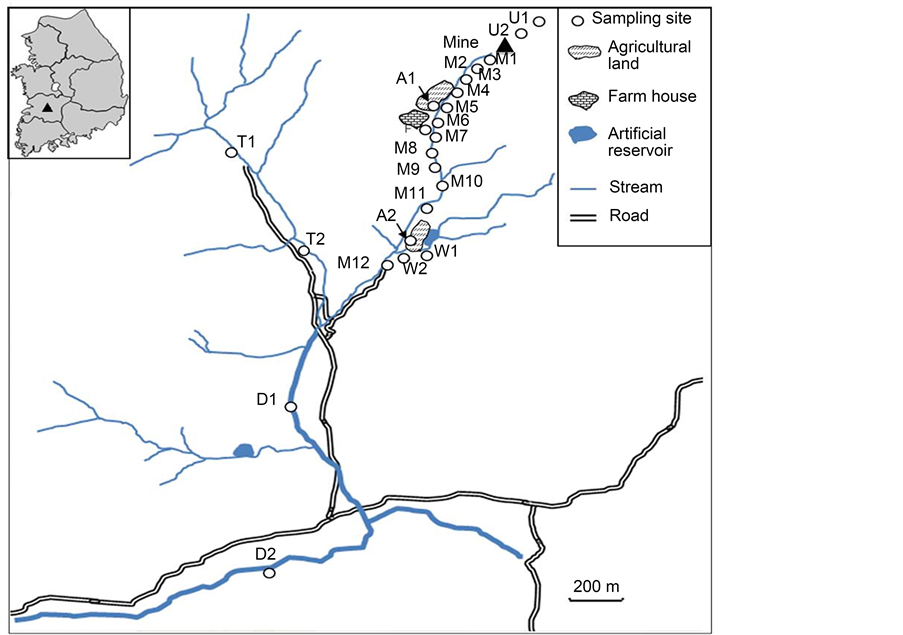
To assess the applicability of isotopic analysis to environmental samples, stream sediments near an abandoned mine located in middle Korea were sampled and measured for their isotope ratios. Various sampling sites were selected (Figure 1): two (U1 and U2) in the upstream area near the entrance of the abandoned mine; three (M1, M2 and M3) in the mainstream area around the mine; two (D1 and D2) in the downstream area; and two (T1 and T2) in an area where the mainstream and a tributary meet. To compare the sediments with soils in the neighboring area, additional sampling sites were chosen: three (M5, M6 and F) in a farming area near the mine and three (A2, W1 and W2) near an artificial reservoir. The sampled sediments were immediately delivered to the laboratory and stored in the freezer. They were sufficiently dried before being ground for analysis (Table 3).
3. Result and Discussion
3.1. Accuracy and Precision of Carbon Isotopes
The mass of certified reference materials used to measure carbon isotope ratios with the IRMS ranged between 0.082 mg and 1.66 mg. The value of δ13C was found to be −2.754 × 10‰ - −2.791 × 10‰, which is highly consistent with the isotope value of certified reference materials (−2.785 × 10‰). The precision of δ13C (the range of standard deviation) ranged between 0.0081‰ and 0.061‰. The peak height ratio was 0.511 × 10⁻² - 7.081 × 10⁻². Fractionation factor εapplied was calculated as 2.195 - 2.334. All these results indicate consistent ionization in the given analytic conditions. The precision calculated in this study was found much higher than the value reported by Hyodo [24] and Marín-Guirao (0.2‰) [23] . The reproducibility was high even in a wider sample weight range. Figure 2 shows the mass, δ13C value, peak height ratio and fractionation factor εapplied of certified reference materials used for measurement. The result of elemental content analysis also turned out to be very close to the values suggested by certified reference materials (Figure 3).
3.2. Accuracy and Precision of Nitrogen Isotopes
The mass of certified reference materials for measuring nitrogen isotope ratios with the IRMS ranged from 0.008 mg to 0.162 mg. It was found that δ13N was −4.033‰ - −1.142‰ (certified reference material: −1.57‰) and the precision (the range of standard deviation) was 0.363‰ - 0.027‰. Such a wider range was also found in the fractionation factor (3.091 - 0.078), compared to carbon’s range (2.195 - 2.334). When the mass was 0.040 mg or higher, however, the certified reference materials showed better precision than what Aguiñiga reported [25] . The peak height ratio was 0.069 × 10⁻² - 1.261 × 10⁻² as it consistently increased along with the mass of certified reference
 (a)
(a)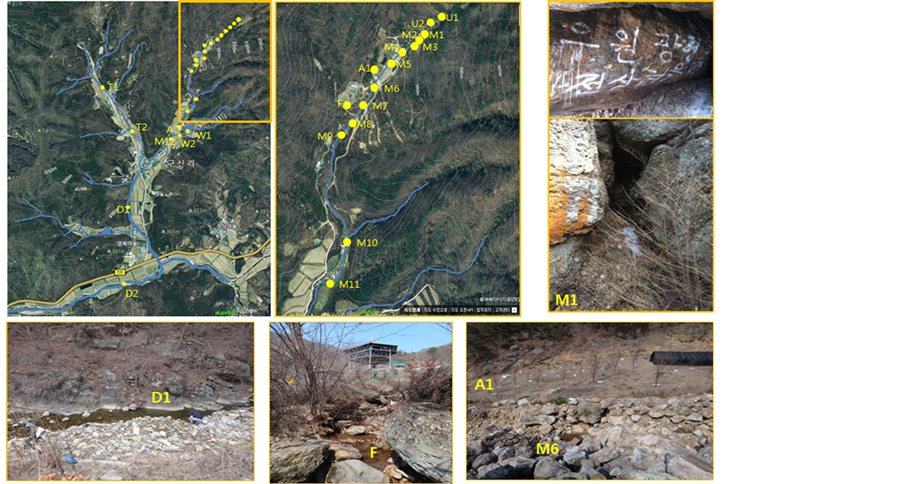 (b)
(b)
Figure 1. Sampling sites near an abandoned mine in Korea.
Table 3. Sampling sites near an abandoned mine in middle Korea.
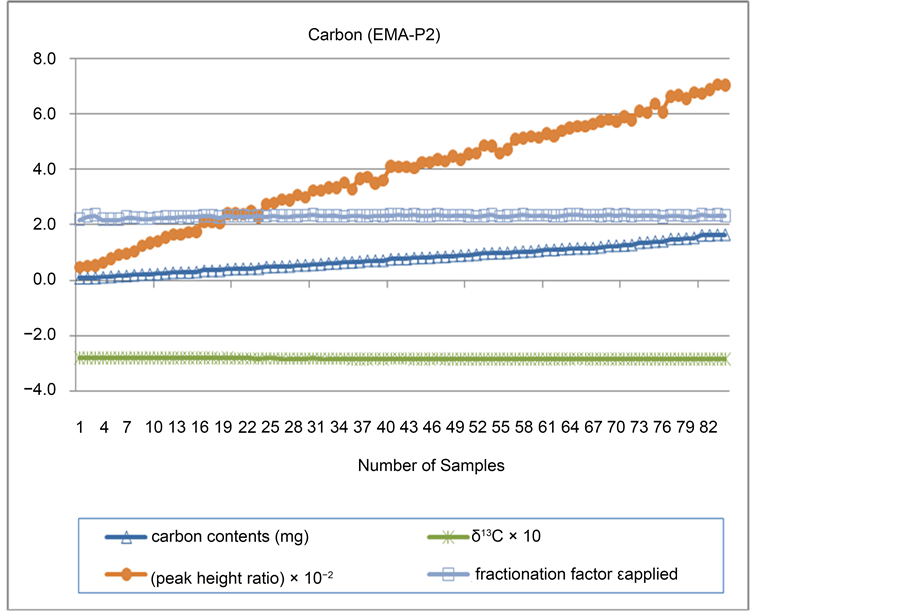
Figure 2. Accuracy and precision of carbon isotopes.
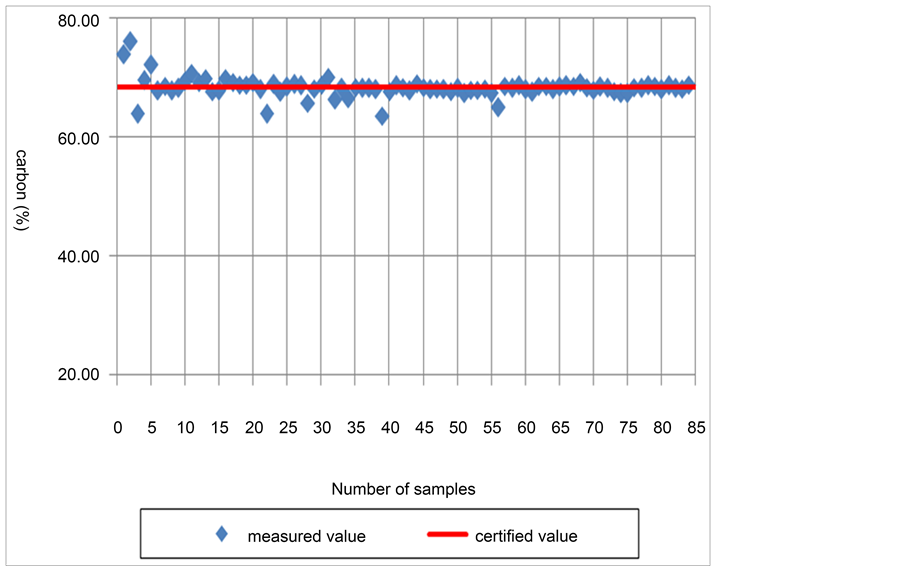
Figure 3. Carbon contents of EMA-P2.
materials. Figure 4 displays δ13N, peak height ratio and fractionation factor εapplied based on the nitrogen contents of certified reference materials used for measurement. The analysis result of elemental contents was also found very close to the values suggested by certified reference materials (Figure 5).
3.3. Application to Field Study
In various studies, carbon and nitrogen stable isotope ratios have been used as indicators showing origins of organisms. This study applied isotopic analysis to sediments and soils sampled from various sites near an abandoned mine. The result showed that the carbon and nitrogen isotope ratios of the samples were 23.1‰ - −27.3‰ and −1.5‰ - 7.1‰, respectively. As generally known, plants are categorized into C3 and C4 in accordance with the characteristics of metabolic synthesis matters created by carbon assimilation. Most C3 plants such as trees, beans, wheat and rice have the average carbon isotope ratio of around −27‰ while some C4 plants including corn and sugar cane have −14‰. The carbon isotope ratios of the sediment and soil samples analyzed in this study indicated that they were affected by organisms from C3 plants of land origin. Each flow distance in the sampling sites was characterized as follows: the carbon and nitrogen isotope ratios of samples from the upstream area near the entrance of the mine were −26.6‰ - −26.7‰ and 2.5‰ - 2.7‰, respectively. In the main stream area (M1, M2 and M3), on the other hand, it was turned out that carbon isotope ratios were lighter (−24.5‰ - −25.2‰) while nitrogen ratios were heavier (5.7‰ - 7.2‰). This may be because the main stream sites were affected by the influx of organisms that
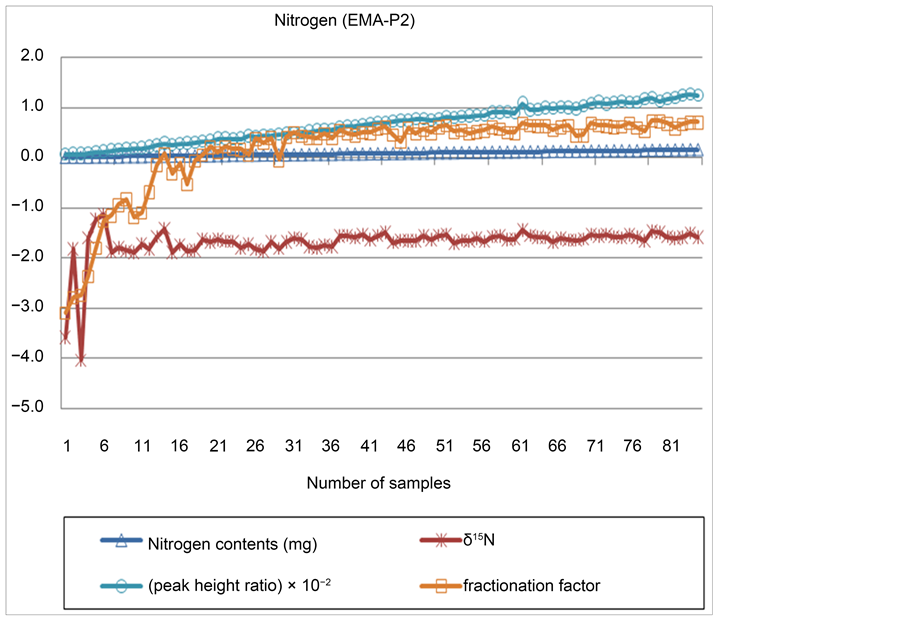
Figure 4. Accuracy and precision of nitrogen isotopes.
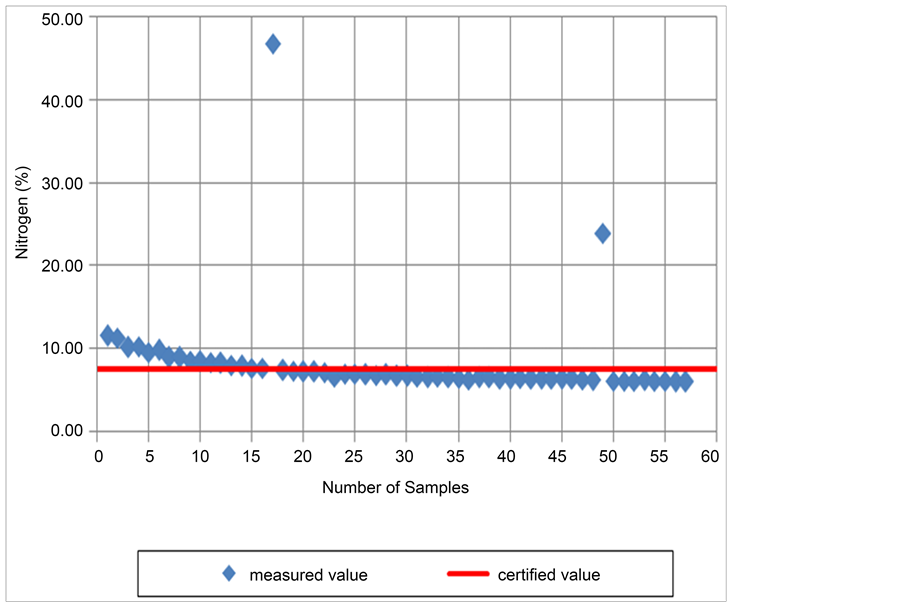
Figure 5. Nitrogen contents of EMA-P2.
stemmed from soils in the neighboring area of the mine. In farming sites including M7, M8, M9 and F, the stable isotope ratios of total organic carbon and total nitrogen were 26.2‰ - −27.3‰ and −1.5‰ - 1.9‰, each, showing a different distribution compared to the upstream and mainstream areas. The nitrogen isotope ratios, in particular, were found far lighter in these sites, which may be attributable to the inflow of synthetic fertilizers or livestock manure from soils in the neighboring area. The pilot application of isotope ratios in this study, where sediment and soil samples from various sites near an abandoned mine were analyzed and compared, helped assume that isotope ratios can appropriately be used for predicting different pollution sources (Figure 6).
4. Conclusion
The isotope ratio mass spectrometer (IRMS) is an instrument that measures both of the elemental contents and isotope ratios of hydrogen, oxygen, carbon, nitrogen and sulfur in environmental samples at the same time. In this study, a recently introduced IRMS was used to analyze certified reference materials (EMA-P1, EMA-P2), which helped establish analysis conditions of carbon and nitrogen isotope ratios. The accuracy and precision of isotope ratios and elemental contents were also assessed, and the results were satisfactory. Based on the accuracy and precision assessment results of certified reference materials, the established isotopic analysis conditions were pilot-applied to sediments and soils sampled from areas near an abandoned mine. The analysis of these
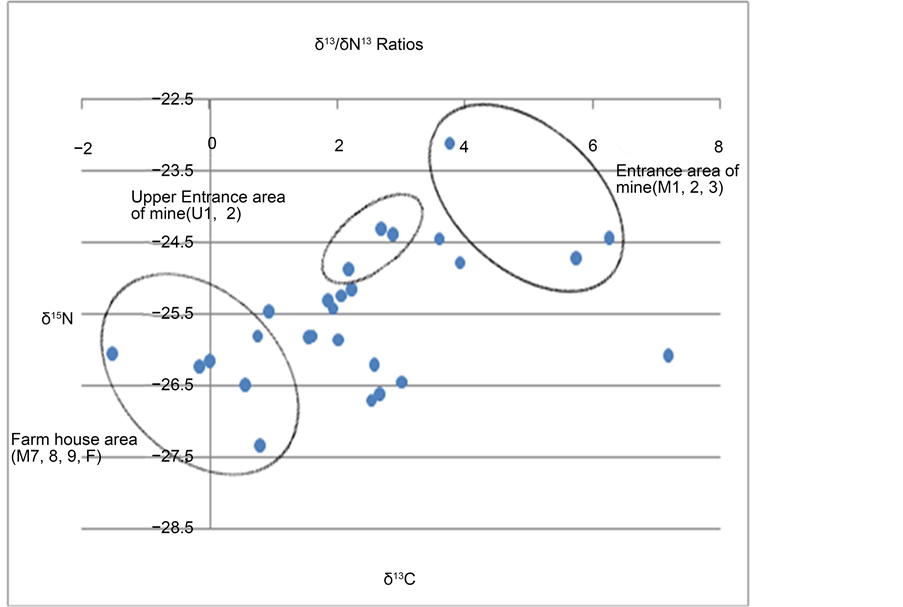
Figure 6. Carbon and nitrogen stable isotope ratio of sediments in stream areas near the abandoned mine.
sediments and soils showed distinct characteristics in isotope ratios between the upstream area including the mine entrance and the farming area. The assessment of accuracy and precision measured with the IRMS and the pilot application of isotopic analysis to sediments and soils indicated that isotopic analysis can appropriately be used for studies on tracing pollution sources. All in all, this study is summarized as follows: 1) The analysis of carbon reference materials (EMA-P2) showed that in the mass range of 0.082 mg - 1.662 mg, the accuracy of isotope ratios was −2.809 × 10‰ ± 0.18‰ (2σ) while the precision was 0.0091‰, a better result than what I. C. Torres et al. [26] suggested (0.1‰). 2) The analysis of nitrogen reference materials (EMA-P2) indicated that in the mass range of 0.008 mg - 1.663 mg, the accuracy of isotope ratios was −1.57‰ ± 0.71‰ (2σ). When the mass was 0.040 mg or over, however, the precision of the reference materials was measured as 0.16‰ (2σ), a more satisfactory result than what I. C. Torres et al. suggested (0.3‰) [26] . 3) The isotope ratios of sediments and soils sampled from the upstream area near the entrance of an abandoned mine and farming sites were analyzed, and the result suggested that the carbon isotope ratios ranged between −22.5‰ and −27.5‰, while the nitrogen isotope ratios were −1.9‰ - 7.9‰. Comparing the measurements of isotope ratios and the characteristics of sampling sites indicated that nitrogen isotope values were found lower in the farming area than in the upstream area near the mine, which implied that organic matters probably had influence on the values. 4) The accuracy and precision of IRMS measurements were assessed using certified reference materials, thereby establishing optimal analysis conditions. When the isotope ratios of sediments and soils were analyzed with these established conditions, it was found that the isotopic analysis of environmental samples could be very useful for studies on tracing pollution sources. Finally, for the development for high skills of managing IRMS, inter-laboratory comparison exercise or proficiency testing schemes provide a means for laboratories to check the quality of measurements and monitor long term reproducibility of sample preparation in comparison to those obtained by other laboratories. Participation in such schemes is a fundamental requirement of any laboratory seeking or managing accreditation to ISO/EC 17025 [27] . It is recommended that laboratories participate in an inter-laboratory ring test at least every two years to check for reliability and accuracy of the determined results. And also, to achieve accreditation to ISO/IEC 17025 or other internationally recognized quality standards analytical techniques must be validated. A laboratory must prepare a validation plane and a validation report presenting and interpreting the data obtained. The validation process will depend on the nature of samples to be analysed, the equipment to be measured, all of which must be defined in the validation plan. So, it is necessary to set up co-work programs for the extending of research ranges for using IRMS through the worldwide participations of scientists and technicians.
Cite this paper
Hwang, J.Y., Kim, B.K., Kim, M.S., Choi, J.W., Kim, T.S. and Lee, W.S. (2016) Evaluation of Accuracy and Precision of IRMS by Using Standard Materials and Applications. Journal of Agri- cultural Chemistry and Environment, 5, 211- 222. http://dx.doi.org/10.4236/jacen.2016.54022
References
- 1. Henderson, A.K., Nelson, D.M., Hu, F.S., Huang, Y., Shuman, B.N. and Williams, J.W. (2010) Holocene Precipitation Seasonality Captured by a Dual Hydrogen and Oxygen Isotope Approach at Steel Lake, Minnesota. Earth and Planetary Science Letters, 300, 205-214.
http://dx.doi.org/10.1016/j.epsl.2010.09.024 - 2. Kim, B.K., Nam, Y.J., Lee, W.S., Han, J.S. and Hwang, J.Y. (2012) The Study on Accuracy and Precision of Carbon Isotope Using Elemental Analyzer-Isotope Ratio Mass Spectrometer (EA-IRMS). Journal of the Korean Society for Environmental Research, 15, 245-255.
- 3. Kim, B.K., Hwang, J.Y., Lee, S.U., Kim, M.S. and Lee, W.S. (2013) The Study on Accuracy and Precision of Nitrogen Isotope Measurement Using Elemental Analyzer-Isotope Ratio Mass Spectrometer (EA-IRMS). Journal of the Korean Society for Environmental Research, 16, 1-9.
- 4. Shormar, B., Osenbrück, K. and Yahya, A. (2008) Elevated Nitrate Levels in the Groundwater of the Gaza Strip: Distribution and Sources. Science of the Total Environment, 389, 164- 174.
http://dx.doi.org/10.1016/j.scitotenv.2008.02.054 - 5. Kang, C.K., Choy, E.J., Hur, Y.B. and Myeong, J.I. (2009) Isotopic Evidence of Particle Size-Dependent Food Partitioning in Cocultured Sea Squirt Halocynthia roretzi and Pacific Oyster Crassostrea gigas. Aquatic Biology, 6, 289-302.
http://dx.doi.org/10.3354/ab00126 - 6. Hunkeler, D., Meckenstock, R.U., Lollar, B.S., Schmidt, T.C. and Wilson, J.T. (2008) A Guide for Assessing Biodegradation and Source Identification of Organic Ground Water Con- taminants Using Compound Specific Isotope Analysis (CSIA). Environmental Protection Agency, USA.
- 7. Xue, D., Botte, J., Baets, B.D., Accoe, F., Nestler, A., Taylor, P., Cleemput, O.V., Berglund, M. and Boeckx, P. (2009) Present Limitations and Future Prospects of Stable Isotope Methods for Nitrate Source Identification in Surface- and Groundwater. Water Research, 43, 1159-1170.
http://dx.doi.org/10.1016/j.watres.2008.12.048 - 8. Mützel (Rauch), E., Lehn, C., Peschel, O., Holmann, S. and RoBmann, A. (2009) Assign- ment of Unknown Persons to Their Geographical Origin by Determination of Stable Iso- topes in Hair Samples. International Journal of Legal Medicine, 123, 35-40.
http://dx.doi.org/10.1007/s00414-008-0286-7 - 9. Hyodo, F., Tsugeki, N., Azuma, J., Urabe, J., Nakanishi, M. and Wada, E. (2008) Changes in Stable Isotopes, Lignin-Derived Phenols, and Fossil Pigments in Sediments of Lake Biwa, Japan; Implications for Anthropogenic Effects over the Last 100 Years. Science of the Total Environment, 403, 139-147.
http://dx.doi.org/10.1016/j.scitotenv.2008.05.010 - 10. Bebout, G.E., Idleman, B.D., Li, L. and Hilkert, A. (2007) Isotope-Ratio-Monitoring Gas Chromatography Methods for High-Precision Isotopic Analysis of Nanomole Quantities of Silicate Nitrogen. Chemical Geology, 240, 1-10.
http://dx.doi.org/10.1016/j.chemgeo.2007.01.006 - 11. Pang, G.F., Fan, C.L., Cao, Y.Z., Zhang, J.J., Li, X.M., Li, Z.Y. and Jia, G.Q. (2006) Study on Distribution Pattern of Stable Carbon Isotope Ratio of Chinese Honeys by Isotope Ratio Mass Spectrometry. Journal of the Science of Food and Agriculture, 86, 315-319.
http://dx.doi.org/10.1002/jsfa.2328 - 12. Torres, I.C., Inglett, P.W., Brenner, M., Kenney, W.F. and Reddy, K.R. (2012) Stable Isotope (δ13C and δ15N) Values of Sediment Organic Matter in Subtropical Lakes of Different Trophic Status. Journal of Paleolimnology, 47, 693-706. http://dx.doi.org/10.1007/s10933-012-9593-6
- 13. Ehleringer, J.R., Cooper, D.A., Lott, M.J. and Cook, C.S. (1999) Geo-Location of Heroin and Cocaine by Stable Isotope Ratios. Forensic Science International, 106, 27-35.
http://dx.doi.org/10.1016/S0379-0738(99)00139-5 - 14. Elliott, K.H., Cesh, L.S., Dooley, J.A., Letcher, R.J. and Ellitt, J.E. (2009) PCBs and DDE, but Not PBDEs, Increase with Trophic Level and Marine Input in Nestling Bald Eagles. Science of the Total Environment, 407, 3867-3875.
http://dx.doi.org/10.1016/j.scitotenv.2009.02.027 - 15. Lee, K.S., Bong, Y.S., Lee, D., Kim, Y. and Kim, K. (2008) Tracing the Sources of Nitrate in the Han River Watershed in Korea, Using δ15N- and δ18O- Values. Science of the Total Environment, 395, 117-124.
http://dx.doi.org/10.1016/j.scitotenv.2008.01.058 - 16. Marín-Guirao, L., Lloret, J. and Marin, A. (2008) Carbon and Nitrogen Stable Isotopes and Metal Concentration in Food Webs from a Mining-Impacted Coastal Lagoon. Science of the Total Environment, 393, 118-130.
http://dx.doi.org/10.1016/j.scitotenv.2007.12.023 - 17. Zou, L., Sun, M.Y. and Guo, L. (2006) Temporal Variations of Organic Carbon Inputs into the Upper Yukon River: Evidence from Fatty Acids and Their Stable Isotope Compositions in Dissolved, Colloidal and Particulated Phases. Organic Geochemistry, 37, 944-956.
http://dx.doi.org/10.1016/j.orggeochem.2006.04.002 - 18. Goni, M.A., Monacci, N., Gisewhite, R., Ogston, A., Crockett, J. and Nittrouer, C. (2006) Distributin and Sources of Particulate Organic Matter in the Water Column and Sediments of the Fly River Delta, Gulf of Papua (Papua New Guinea). Estuarine Coastal and Shelf Sci- ence, 69, 225-245.
http://dx.doi.org/10.1016/j.ecss.2006.04.012 - 19. Itoh, M., Takemon, Y., Makabe, A., Yoshimizu, C., Kohzu, A., Ohte, N., Tumurskh, D., Tayasu, I., Yoshida, N. and Nagata, T. (2011) Evaluation of Wastewater Nitrogen Transformation in a Natural Wetland (Ulaanbaatar, Mongolia) Using Dual-Isotope Analysis of Nitrate. Science of the Total Environment, 409, 1530-1538.
http://dx.doi.org/10.1016/j.scitotenv.2011.01.019 - 20. Yun, M., Wadleigh, M.A. and Pye, A. (2004) Direct Measurement of Sulphur Isotopic Composition in Lichens by Continuous Flow-Isotope Ratio Mass Spectrometry. Chemical Geology, 204, 369-376.
http://dx.doi.org/10.1016/j.chemgeo.2003.11.008 - 21. Aguiniga, S., Sanchez, A. and Silverberg, N. (2010) Temporal Variations of C, N, δ13C, and δ15N in Organic Matter Collected by a Sediment Trap at Cuenca Alfonso, Bahía de La Paz, SW Gulf of California. Continental Shelf Research, 30, 1692-1700.
http://dx.doi.org/10.1016/j.csr.2010.07.005 - 22. Torres, I.C., Inglett, P.W., Brenner, M., Kenney, W.F. and Reddy, K.R. (2012) Stable Isotope (δ13C, and δ15N) Values of Sediment Organic Matter in Subtropical Lakes of Different Trophic Status. Journal of Paleolimnology, 47, 693-706.
http://dx.doi.org/10.1007/s10933-012-9593-6 - 23. Paul, D., Skrzypek, G. and Fórizs, I. (2007) Normalization of Measured Stable Isotopic Compositions to Isotope Reference Scales—A Review. Rapid Communications in Mass Spectrometry, 21, 3006-3014.
- 24. Stellard, F. and Elzinga, H. (2005) Analytical Techniques in Biomedical Stable Isotope Applications: (Isotope Ratio) Mass Spectrometry or Infrared Spectrometry? Isotopes in Environmental and Health Studies, 41, 345-361.
http://dx.doi.org/10.1080/10256010500384333 - 25. Dickin, A.P. (2005) Radiogenic Isotope Geology. Cambridge University Press, Cambridge.
http://dx.doi.org/10.1017/CBO9781139165150 - 26. Townsend, A. (Ed.) (1995) Encyclopedia of Analytical Science. Academic Press Limited, London.
- 27. ISO/IEC 17025 (2005) General Requirements for the Competence of Testing and Calibra- tion Laboratories. International Organization for Standardization.