Food and Nutrition Sciences
Vol.5 No.15(2014), Article
ID:49216,15
pages
DOI:10.4236/fns.2014.515163
The Use of Chloride, Citric and Ascorbic Acid Dip and Packaged Film to Extend the Shelf Life of Pejerrey (Odonthested bonaerensis) during Storage at Different Temperatures
Copes Julio1, Pellicer Karina1, Bigeon Giselda1, Giannuzzi Leda2*
1Cátedra de Tecnología y Sanidad de los Alimentos, Facultad de Ciencias Veterinarias, Universidad Nacional de La Plata, La Plata, Argentina
2Centro de Investigación y Desarrollo en Criotecnología de Alimentos (CIDCA), CONICET, Universidad Nacional de La Plata, La Plata, Argentina
Email: jcopes@fcv.unlp.edu.ar, pellicerk@fcv.unlp.edu.ar, *leda@biol.unlp.edu.ar
Copyright © 2014 by authors and Scientific Research Publishing Inc.
This work is licensed under the Creative Commons Attribution International License (CC BY).
http://creativecommons.org/licenses/by/4.0/


Received 28 May 2014; revised 3 July 2014; accepted 14 July 2014
ABSTRACT
The objective of this study was to analyze the effect of chloride, citric and ascorbic acid dip treatments in conjunction with two types of packaging films (with high and low gas permeability) on microbial growth in samples of pejerrey fillets (Odonthestes bonaerensis) at three storage temperatures (4˚C, 0˚C and −1.5˚C). Colour, pH, texture modification and chemical changes were also studied. Psychrotrophic microorganisms, sp. were modelled by the Gompertz’ equation. Lag phase duration, specific growth rate and maximum population density were calculated. The activation energy (E() was calculated reaching values of 147 and 177 kJ/mol when the low permeability packaging films were employed. We used psychrotrophic microorganisms, sp., as a predictor of the shelf life of product. The application of treatment with chloride, citric and ascorbic acids, extended 1 - 2 days the storage life of the product (time to reach 106 CFU/g) when the packaging material used was polyethylene. The use of chloride, citric and ascorbic acids and vacuum packaging produced shelf life values of 7.7, >25 and >25 days at 4˚C, 0˚C and −1.5˚C respectively. The products had very good organoleptic characteristics, maintained their colour and texture appropriate, and absence of pathogenic microorganisms. These values indicated that the growth models were acceptable for expressing the growth of microorganisms on pejerrey fillets, which can be applied to ensure the safety of fish and to establish standards for avoiding microbial contamination.
Keywords:Mathematical Modeling, Preservatives, Vacuum-Packaging, Fish Spoilage, Storage Life, Chill and Superchilling Storage

1. Introduction
Pejerrey (Odontesthes bonariensis) is one of the pelagic fish species belonging to the Atherinopsidae family in the southern area of the Río de La Plata basin, in Argentina. Fresh Odontesthes bonariensis is popular in Argentina, especially during the early summer-fall period, and is commonly sold for immediate consumption at retail fish stores or at markets as steaks (slices) or as chunks to be either grilled or barbequed at home [1] . Ice storage is the conventional method to preserve fresh fish. In spite of the availability of modern cold-chain and transport facilities, distribution of fresh fish remains a problem, especially in temperate and tropical climate countries [2] . Storage of fish at temperatures between 0˚C and −4˚C is called superchilling or partial freezing. The shelf life of various fish and shellfish can be extended by storage at subzero temperatures. However, a negative effect on freshness/prime quality has been observed for some fish species. It has been found [3] that cold stored at −2˚C for 10 days had an appearance and texture inferior to fish stored at 0˚C in ice. Spoilage microflora produces enzymes that cause proteolysis, deamination, and decarboxylation resulting in accumulation of unpleasant metabolites and loss of taste substances [4] -[7] . Changes in the sensory characteristics related to appearance, odour, taste and texture on fresh fish are mainly due to the activity of spoilage organisms [8] . Storage life extension and potential microbiological hazard in fish products are highly dependent on initial bacterial counts and storage temperature. A very strict control of temperature is therefore vital for a correct handling of fish products. Vacuum packaging is increasingly used as a technique for extending the shelf life of perishable foods, and in combination with refrigeration has proven to be an effective preservation method for the extension of shelf-life of fresh fish and fish products [9] [10] . Additionally, the antimicrobial effect of ascorbic and citric acids is an attractive alternative because these acids appear naturally in many foods; they are an essential nutrient and have been generally recognized as safe. No information was found in bibliography about the combined application of chloride, citric and ascorbic acids and vacuum packaging to extend the shelf life of this kind of fish. The presence and performance of microorganisms in fish products, especially the psychrotrophs are closely related to the spoilage of fish and its shelf life. The modelling of these microorganisms to predict shelf life becomes a highly essential concern. Other quality factors such as colour and texture also contribute to the shelf life of fresh fish. The impacts of different storage times and temperatures on the growth of specific spoilage microorganisms, and on changes in colour and texture quality attributes of pejerrey, have not been reported. The objective of this study was to analyse the simultaneous effect of dip treatments (chloride, citric and ascorbic acid) in conjunction with two types of packaging films (with high and low gas permeability) and three storage temperatures (4˚C, 0˚C and −1.5˚C) on microbial growth, colour and texture modifications in samples of pejerrey fillets (Odonthestes bonaerensis). The effects of the different types of treatments on psychrotrophic microorganisms, sp. growth were mathematically modeled in order to predict the shelf life of the product under different conditions.
2. Material and Methods
Pejerrey (Odonthestes bonaerensis) of reproductive age (35 cm long) were caught from lakes in the district of Chascomus, Province of Buenos Aires, Argentina (Latitude 35˚36'S Longitude 58˚02'S) during February-March, 2005. Pejerrey weighing approximately 0.20 - 0.25 kg, served as research material throughout this study. The fish were immediately de-headed, gutted, washed with tap water and put on ice, packaged in insulated polystyrene boxes with ice and delivered to the laboratory within less than 3 h of landing. The fish were filleted manually in the laboratory. The fillets were then dipped during 1 minute in: treatment 1 (0.8 ppm of chloride water) or treatment 2 (a mixture of 0.8 ppm chloride water, 0.25% of citric acid (Sigma St. Louis, USA) and 0.10% of ascorbic acid (Sigma St. Louis, USA)). Treatment 1 is the common treatment used for fish and was considered as a control. After draining, samples were packaged using two types of plastic films of different oxygen permeability. For ambient pressure packaging, low density polyethylene of 80 μm thick, water vapour permeability WVP = 12 g/m2∙day∙atm at 30˚C and RH = 78%, oxygen transmission rate OTR = 6500 cm3/m2∙day∙atm at 23˚C, heat sealing was used. For vacuum packaging, a composite EVA SARAN EVA (ESE) coextruded film (Grace, Buenos Aires; Argentina) 90 μm tick, WVP 7.2 g/m2∙day∙atm at 30˚C and RH = 78%, OTR = 37 cm3/m2day∙atm at 23˚C, vacuum and mechanical sealing was used.
Samples were stored at 3 different temperatures (4˚C, 0˚C and −1.5˚C) for a total period of 25 days. Each temperature mimicked common commercial conditions associated with transportation, storage, and processing.
The factorial design was: 2 kinds of treatments, 2 types of permeability films and 3 storage temperatures, for a total of 12 study conditions.
All samples were stored at three temperatures 4˚C, 0˚C and −1.5˚C and at each sampling time triplicate samples from each treatment were removed for subsequent analysis.
2.1. Microbiological Assessments
At the initial and at different storage times, 25 g of sample were obtained aseptically from each treated fish, transferred to a stomacher bag (Seward Medical, London, UK) and 225 ml of 0.1% peptone water (Oxoid, Hampshire, UK) were added, after which the mixture was homogenized for 60 s in a stomacher (Lab Blender 400; Seward Medical).
Appropriate serial dilutions were performed to determine different microorganisms according to the following procedures.
1) The psychrotrophic microorganisms, sp. counts were obtained by means of a pour plate technique in Plate count agar (PCA; Merck KGaA, Darmstadt, Germany) and incubation at 4˚C for 7 days [11] .
2) Molds and yeasts counts were obtained via surface plating in YGC agar (Yeast extract, glucose, chloramphenicol; Merck KGaA, Darmstadt, Germany) and incubation at 25˚C for 5 days.
3) Sulfite-reducing microorganisms counts were obtained by means of MPN/g technique in SPS agar (sulfitepolymyxin agar Sulfadiazine; Merck KGaA, Darmstadt, Germany) and incubation at 37˚C for 48 h in anaerobic jars (Gas Pack Plus D-G100, Merck KGaA, Darmstadt, Germany).
4) Enterobacteriaceae counts were obtained by surface plating in Violet red bile dextrose agar (Merck KGaA, Darmstadt, Germany) and incubation at 37˚C for 24 h.
5) Pseudomonas sp. and Aeromonas sp. counts were obtained by surface plating in GSP (Glutamate, starch, phenol red agar, Merck Darmastadt, Germany) and incubation at 37˚C for 48 h; colony isolates were confirmed by oxidase and Hugh Leifson (oxidation-fermentation of glucose; Oxoid, Hampshire, United Kingdom) tests [12] .
6) Staphylococcus aureus counts were obtained by surface plating in Baird-Parker agar (Merck KGaA, Darmastadt, Germany) and incubation at 37˚C for 48 h, and were then characterized by coagulase production (rabbit plasma EDTA, Difco Laboratories, Detroit, USA).
Each determination was done twice and results were expressed as logN (N: Colony Forming Units (logCFU/g)).
7) The presence of Vibrio cholerae and Vibrio parahaemolyticus were evaluated at the beginning and the end of the storage period in TCBS agar (Thiosulphate citrate bile salts sucrose agar; Merck Darmastadt, Germany).
8) The presences of Escherichia coli and Salmonella sp. in the product were determined according to AOAC methods 46,016 and 46,115, respectively [13] .
At the beginning and end of the experiment approximately 70 colonies growing on PCA were isolated in order to determine the percentage distribution of the microbial flora. The isolates were examined microscopically for morphology, motility testing and Gram staining. Diagnostic schemes and procedures used for identification of isolates were those presented by [14] .
2.2. Mathematical Modelling of Microbial Growth
The psychrotrophic microorganisms, sp. counts obtained as a result of the effect of different treatments, packaging and storage temperatures on microbial growth parameters were modeled using Gompertz equation (Equation (1)), a double exponential function based on 4 parameters which describe an asymmetric sigmoid curve:
 (1)
(1)
where logN is the decimal logarithm of the microbial counts (log(CFU/g)) to time t, expressed in days, a is the logarithm of the asymptotic counts when time decreases indefinitely (roughly equivalent to the logarithm of the initial levels of bacteria (log(CFU/g)); c is the logarithm of the asymptotic counts when time is increased indefinitely (it is the number of log cycles of growth) (log(CFU/g)); m is the required time to reach the maximum growth rate (day), b is the growth rate relative to time m (1/day).
The specific growth rate (µ = b∙c/e with e = 2.7182 (log(CFU/g)/day)), the duration of the lag phase (LPD = m − 1/b, (day)) and the maximum population density (MPD = a + c, (logCFU/g)) were derived from these parameters [15] .
The equation was applied to microbial growth data by nonlinear regression using the program Systat (Systat, Inc. 1990). The selected algorithm calculates the set of parameters with the lowest residual sum of squares (RSS) and a 95% confidence interval for microbial growth.
2.3. Chemical Analysis
pH was determined according to [13] using a digital pH meter (Cyberscan 510, UK) after blend 10 g of the fish sample with the same amount of distilled water. Total volatile base nitrogen (TVB-N) and trimethylamine (TMA) were estimated by the microdiffusion method [16] . The determinations were performed at time when the psychrotrophic microorganisms, sp. counts reach 6 logCFU/g.
2.4. Colour Measurements
The surface colour of the samples was measured with a tristimulus reflectance colorimeter (Minolta CR-300; Minolta Corp., Ramsey, NJ, USA) on 4 defined points of internal surface of each fillet. Colour was recorded by using the CIE-L*a*b* scale, where L* indicates lightness, a* indicates chromaticity on a green (−) to red (+) axis, and b* chromaticity on a blue (−) to yellow (+) axis. Numerical values of the parameters were converted into Δa* (Δa*= a* − a * i), (Δb* = b * i − b*), (ΔL* = L * i − L*) and chromaticity difference [chromaticity difference = (Δa * 2 + Δb * 2)1/2]. Additionally, Chroma* function was calculated = (a * 2 + b * 2)1/2. Initial colour was measured on the surface of the fillet after immersion for 1 minute in treatment 1 or treatment 2. Colour determinations were evaluated at the time when the psychrotrophic microorganisms, sp. counts reach 6 logCFU/g. All measurements were repeated four times.
2.5. Texture Measurements
Compression assays (Texture Analyser TA-TX2i, Stabile Micro Systems, UK, with a cylindrical probe with a flat contact surface of 7.5 cm diameter) were performed on five cubes of 1 × 1 cm after 2 cycles of compression. The compression rate was of 1mm/s during 5 s interval between the two cycles. The measure was performed at the time when the psychrotrophic microorganisms, sp. counts reach 6 logCFU/g and reported as the mean of five determinations.
2.6. Sensory Assessment
Sensory assessment was performed at the time when the psychrotrophic microorganisms, sp. counts reach 6 logCFU/g. The evaluations were performed on samples of pejerrey treated with different storage conditions and packaged films. Thirty non-trained panellists evaluated the following attributes: appearance (including colour, brightness, delimitation structures and the presence of exudates), consistency, odour and general acceptability using a hedonic scale of 10 points. One end corresponded to the qualification “dislike extremely,” the middle to “neither like nor dislike” and the opposite end to “like extremely.” A sensory score of four was taken as the borderline of acceptability [17] .
2.7. Statistical Analysis
The ANOVA test (Analysis of Variance) provides the coefficients and their corresponding Standard Deviations. It has been recommended as one of the best methods to identify relevant variables [18] . ANOVA was applied, with significance levels of 0.05 using a statistical package for computers (SYSTAT Inc. 1990, version 5.0, USA) for the comparison of microbial counts with different treatments, packaging and storage temperatures.
3. Results and Discussion
3.1. Analysis of Microbial Flora
The microbial flora at the beginning of the storage period did not contain Vibrio cholerae, Vibrio parahaemolyticus, Salmonella sp. and E. coli.
Coagulase-positive S. aureus and Sulphite-reducing microorganisms counts were lower than 2 logCFU/g and 3 MNP/g respectively. The Enterobacteriaceae counts were 2.54 - 2.72 logCFU/g; Proteus sp. was the most frequent genus isolated. Similar results were found by others in freshwater fish, Proteus sp. being the most frequently isolated deterioration bacteria [19] [20] .
The psychrotrophic microorganisms, sp. counts were in the range of 2.40 - 3.08 logCFU/g, which agrees with previous reports [21] . The isolates consisted of Gram-positive (49.8%) and Gram-negative (46.2%) microorganisms. Many authors have described that the microbial flora associated with fish consists primarily of Gramnegative bacteria and psychrotrophic non fermentative bacilli [22] .
Moulds and yeasts counts were in the range of 2.25 - 2.43 logCFU/g, the majority of which consisted of yeasts (81%).
Pseudomonas sp. counts were in the range of 2.18 - 2.38 logCFU/g in accordance with the views expressed by different authors [20] [23] which make this genus the most important in the process of spoilage of freshwater fish. The amount of Aeromonas sp. isolated was very low (<1 logCFU/g) which may be due to the rapid cooling and maintenance temperature of samples (0˚C).
3.2. Application of a Mathematical Model of Microbial Growth Curves
Considering that fish spoilage bacteria contributed to limit the shelf life of samples, the counts of psychrotropic microorganisms sp. were studied during storage.
Figures 1(a)-(c) shows the fitting of Gompertz model to experimental data of microbial growth of psychrotrophic microorganisms, sp. counts in pejerrey fillet samples with two different treatments and packaged in polyethylene and ESE films, and stored at 4˚C, 0˚C and 1.5˚C respectively.
Significant differences (p < 0.05) were observed with storage time, temperature and type of packaging film. At least 8 points were obtained for each growth curve. In all cases, a good agreement between experimental data and predicted values was obtained.
Table 1 shows Gompertz parameters and derivatives (m, LPD and MPD) for the psychrotrophic microorganisms, sp. evaluated at different storage conditions.

Table 1. Parameters and standard errors of the Gompertz equation (a, b, c and m) and derived parameters (specific growth rate (m), duration of the lag phase (LPD), maximum microbial population (MPD) for counts of total for psychrotrophs microorganisms, sp. in pejerrey fillets treated with chlorine, citric, ascorbic and packaged in different gas permeability films: polyethylene and ESE and stored at different temperatures (4˚C, 0˚C and −1.5˚C).
a [log(CFU/g)], b [1/day], c [log(CFU/g)], m [day], m [log(CFU/g)/day], LPD [day], MPD [log(CFU/g)]. Treatment 1 (0.8 ppm chlorine water), treatment 2 (0.8 ppm chlorine water with 0.25% citric acid and 0.1% ascorbic acid. Different letter in each column indicating significant difference (p < 0.05).
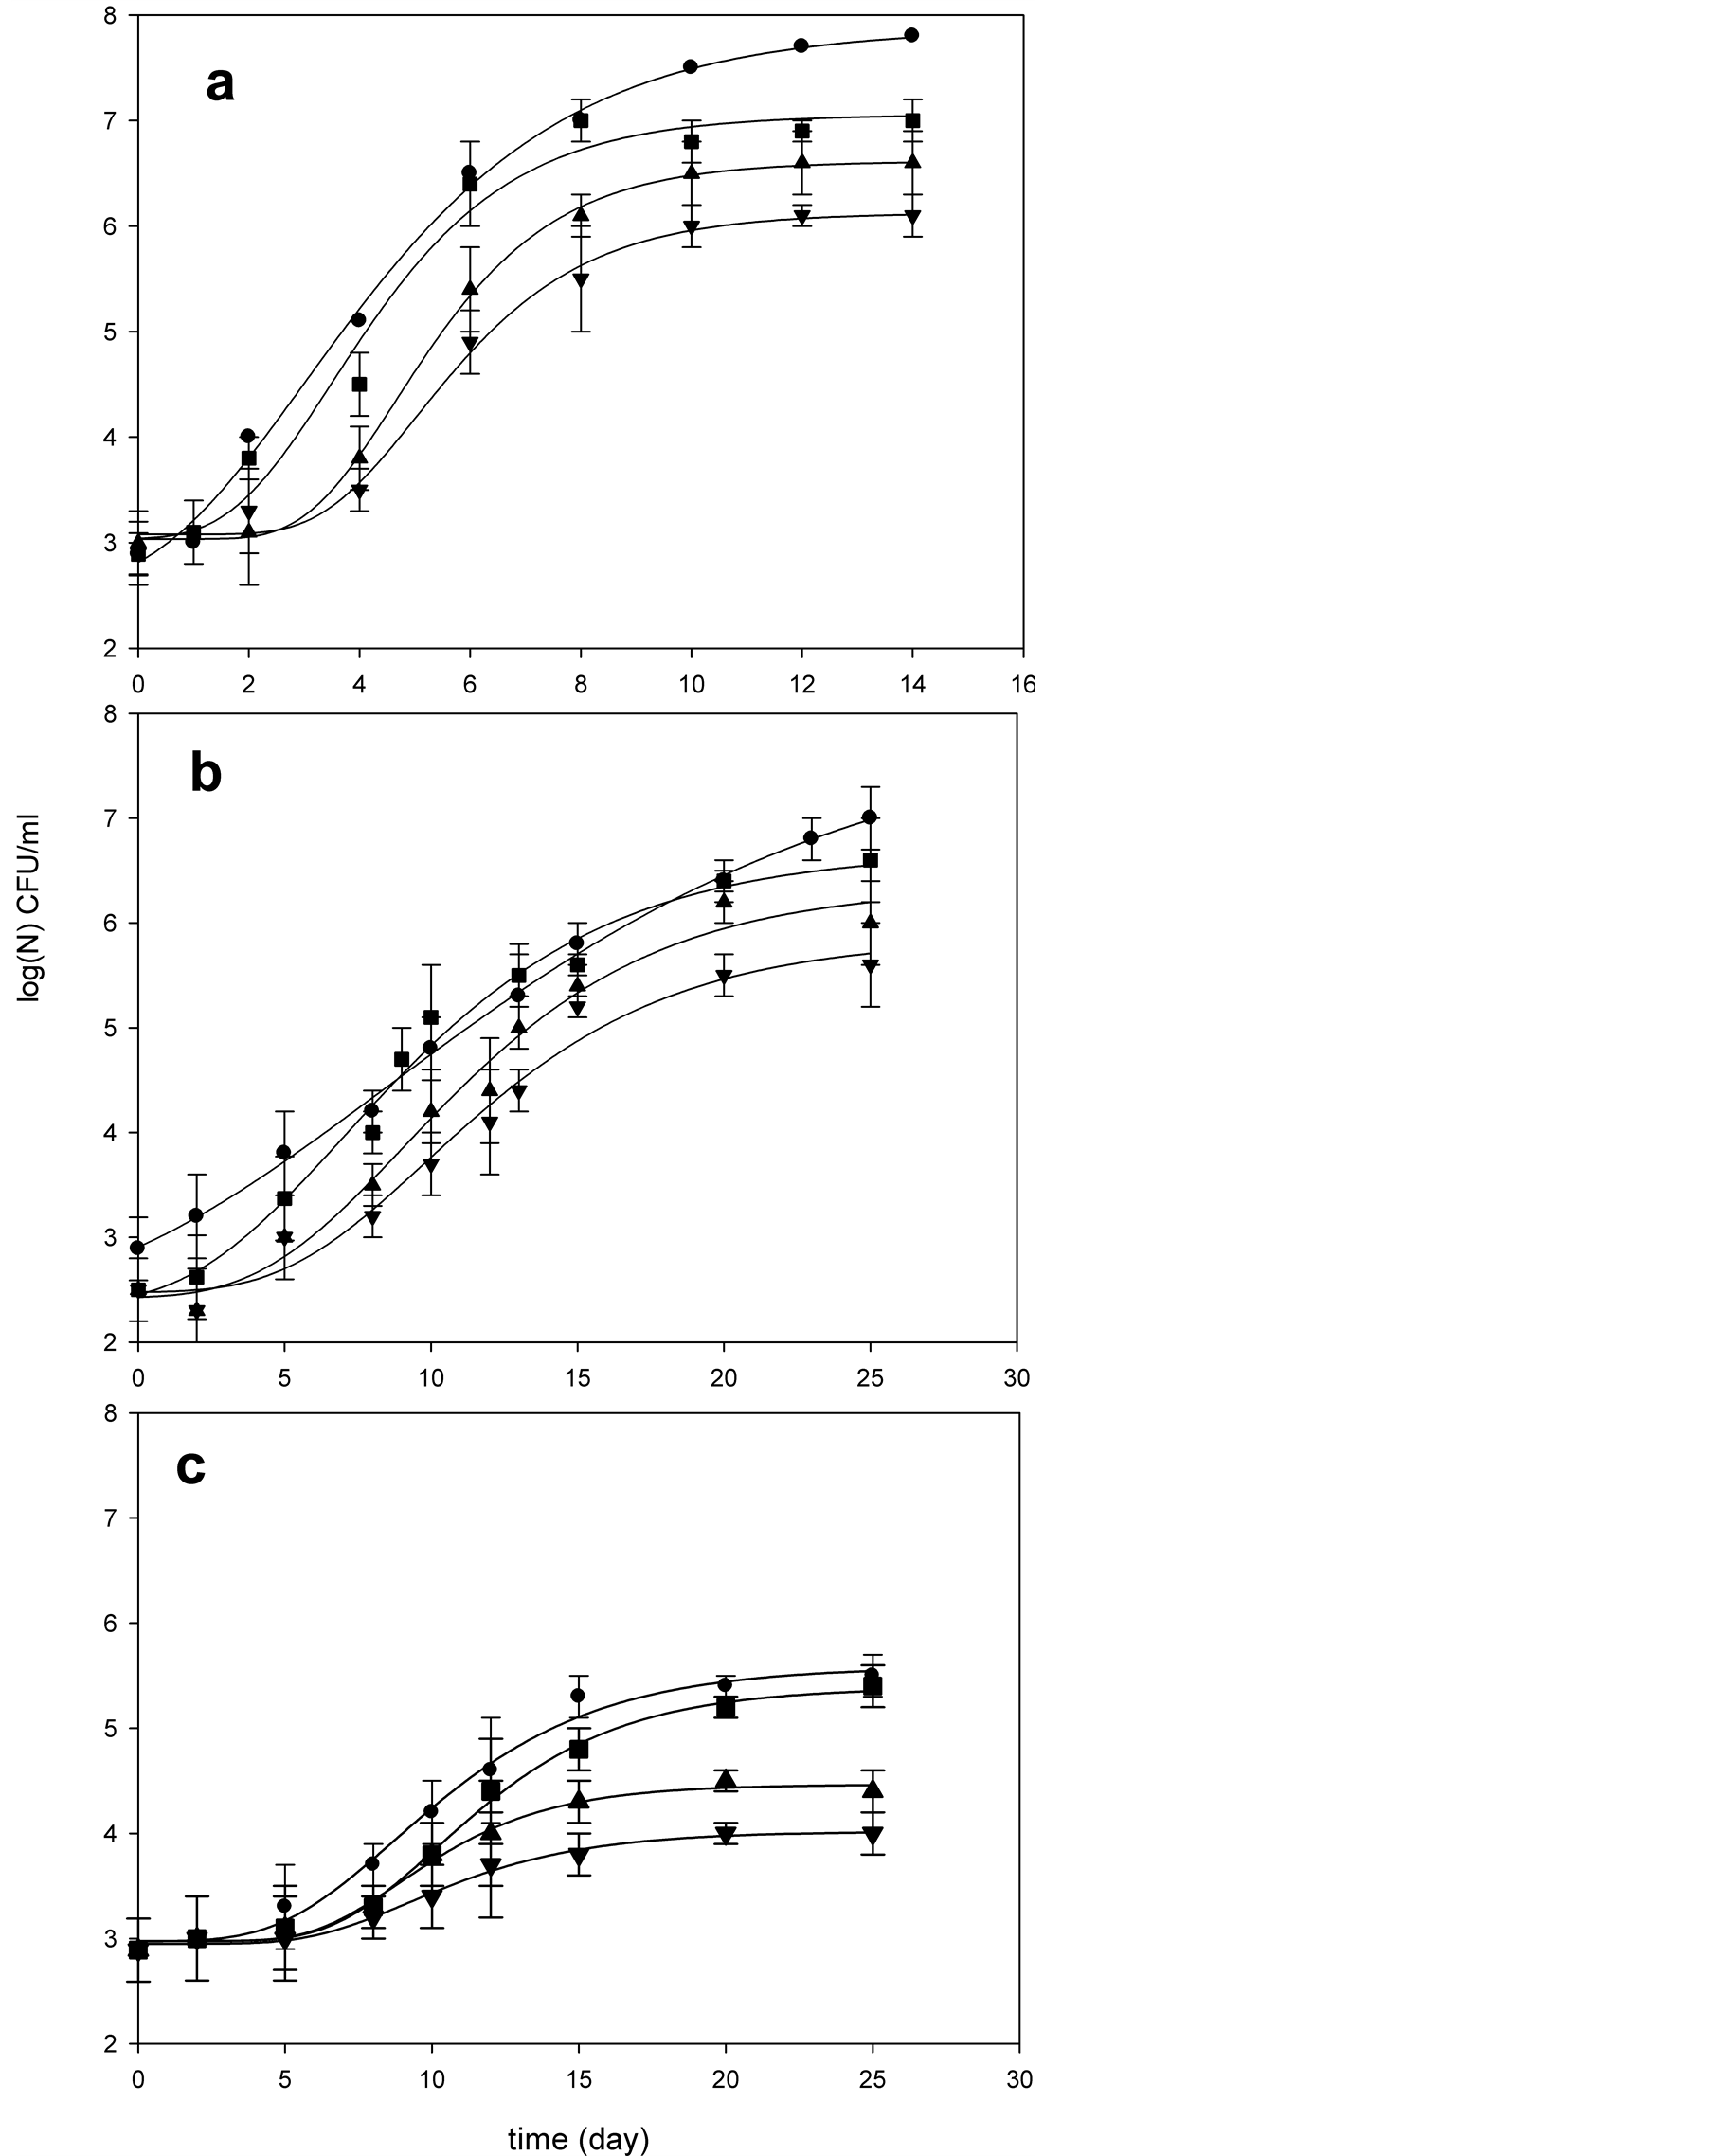
Figure 1. Psychrotrophic microorganisms, sp. counts in pejerrey samples stored at (a) 4˚C; (b) 0˚C; (c) −1.5˚C with different dip treatments: ● treatment 1 (0.8 ppm of chloride) and packaged in polyethylene, ■ treatment 2 (a mixture of 0.8 ppm chloride water, 0.25% citric acid and 0.1% ascorbic acid) and packaged in polyethylene, ▲ treatment 1 (0.8 ppm of chloride) and packaged in ESE film, q treatment 2 (a mixture of 0.8 ppm chloride water, 0.25% citric acid and 0.1% ascorbic acid) and packaged in ESE film.
The samples stored at −1.5˚C showed the lowest m values (0.10 to 0.24 log(CFU/g)/day) compared to the two other temperatures, with a bigger effect when citric and ascorbic acid were added. At this temperature there was a marked effect on the extension of the lag phase (LPD) varying between 4.72 and 6.60 days depending on the type of treatment and packaging film used, compared with storage at 4˚C and 0˚C (Table 1). The MPD values reached values between 4.01 and 5.48 log(CFU/g) been lower than values at 4˚C and 0˚C. At 4˚C the µ values ranged between 0.64 - 0.77 (log(CFU/g)/day), the LPD values were 0.23 - 3.31 days and MPD ranged 6.12 - 7.90 log(CFU/g). At 0˚C the highest differences were obtained in LPD values in ESE packaged with values between 4.08 - 5.06 days.
Regarding the use of weak acids as preservatives, their antimicrobial activity is related to the values of the dissociation constant (pKa) because the ionized form is more lipophilic, enabling a better penetration of the bacterial membrane in order to exert their action. Vacuum packaging may also be used, by means of films with low permeability to oxygen. It is known that oxygen removal by vacuum or modified atmosphere is a commonly used strategy to inhibit the growth of aerobic and facultative anaerobic deteriorative microorganisms that are found in fish meat.
The effect of temperature stored on Gompertz parameters (µ and LPD) of psychrotrophic microorganisms, sp. was study.
3.2.1. Effect of Temperature on Specific Growth Rate of Psychrotrophic Microorganisms, sp.
The effect of storage temperature (4˚C, 0˚C and −1.5˚C) on the specific growth rate (m) was described by the following equations:
1) Arrhenius model
 (2)
(2)
where m is (log(CFU/g)/day), T is the absolute temperature (˚K), Em is the activation energy (kJ/mol), A is the pre-exponential factor (log(CFU/g)/day) and R is the gas constant (8.31 J/mol∙˚K).
2) Linear model
 (3)
(3)
where m is the specific growth rate (log(CFU/g)/day) evaluated at T (˚C), m0 is the specific growth rate at 0˚C (log (CFU/g)/day), d is the slope of the linear regression (log(CFU/g)/day ˚C) [24] .
3) Square root equation Ratkowsky et al., (1983) [25] proposed the following relationship:
 (4)
(4)
where g is the regression coefficient (log(CFU/g/day)1/2/˚C), T is the incubation absolute temperature (˚K), T0 is the conceptual temperature without metabolic significance for psychrophilic, psychrotrophic and mesophilic microorganisms [25] . Equation (4) has been modified as follows:
 (5)
(5)
where T is the storage temperature (˚C), q is the slope of the regression line (log(CFU/g)/day (1/2/˚C), and p (log(CFU/g/day)½) is the intercept at 0˚C.
Figures 2(a)-(c) shows the effect of temperature on m values of psychrotrophic microorganisms, sp.
Table 2 summarizes the parameters and regression coefficients (R2) obtained with the three models applied to psychrotrophic microorganisms, sp. growing in pejerrey fillets at different conditions.
The highest correlation coefficients were obtained with Arrhenius model. The lowest values of activation energy Eµ (120.3 and 128.5 kJ/mol) were observed for samples packaged in polyethylene film with treatment 1 and 2 respectively. The highest values of activation energy Em (147.3 and 177.3 kJ/mol) were obtained for samples packaged in ESE with treatment 1 and 2 respectively indicating that under these conditions psychrotrophic microorganisms, sp. was more sensitive to thermal changes.
3.2.2. Effect of Temperature on Lag Phase Duration (LPD)
The lag phase duration (LPD) of spoilage microorganisms in fish is an important parameter to consider for the shelf life of the product. Reference [26] modified the Ratkowsky model in order to describe the latency time as a
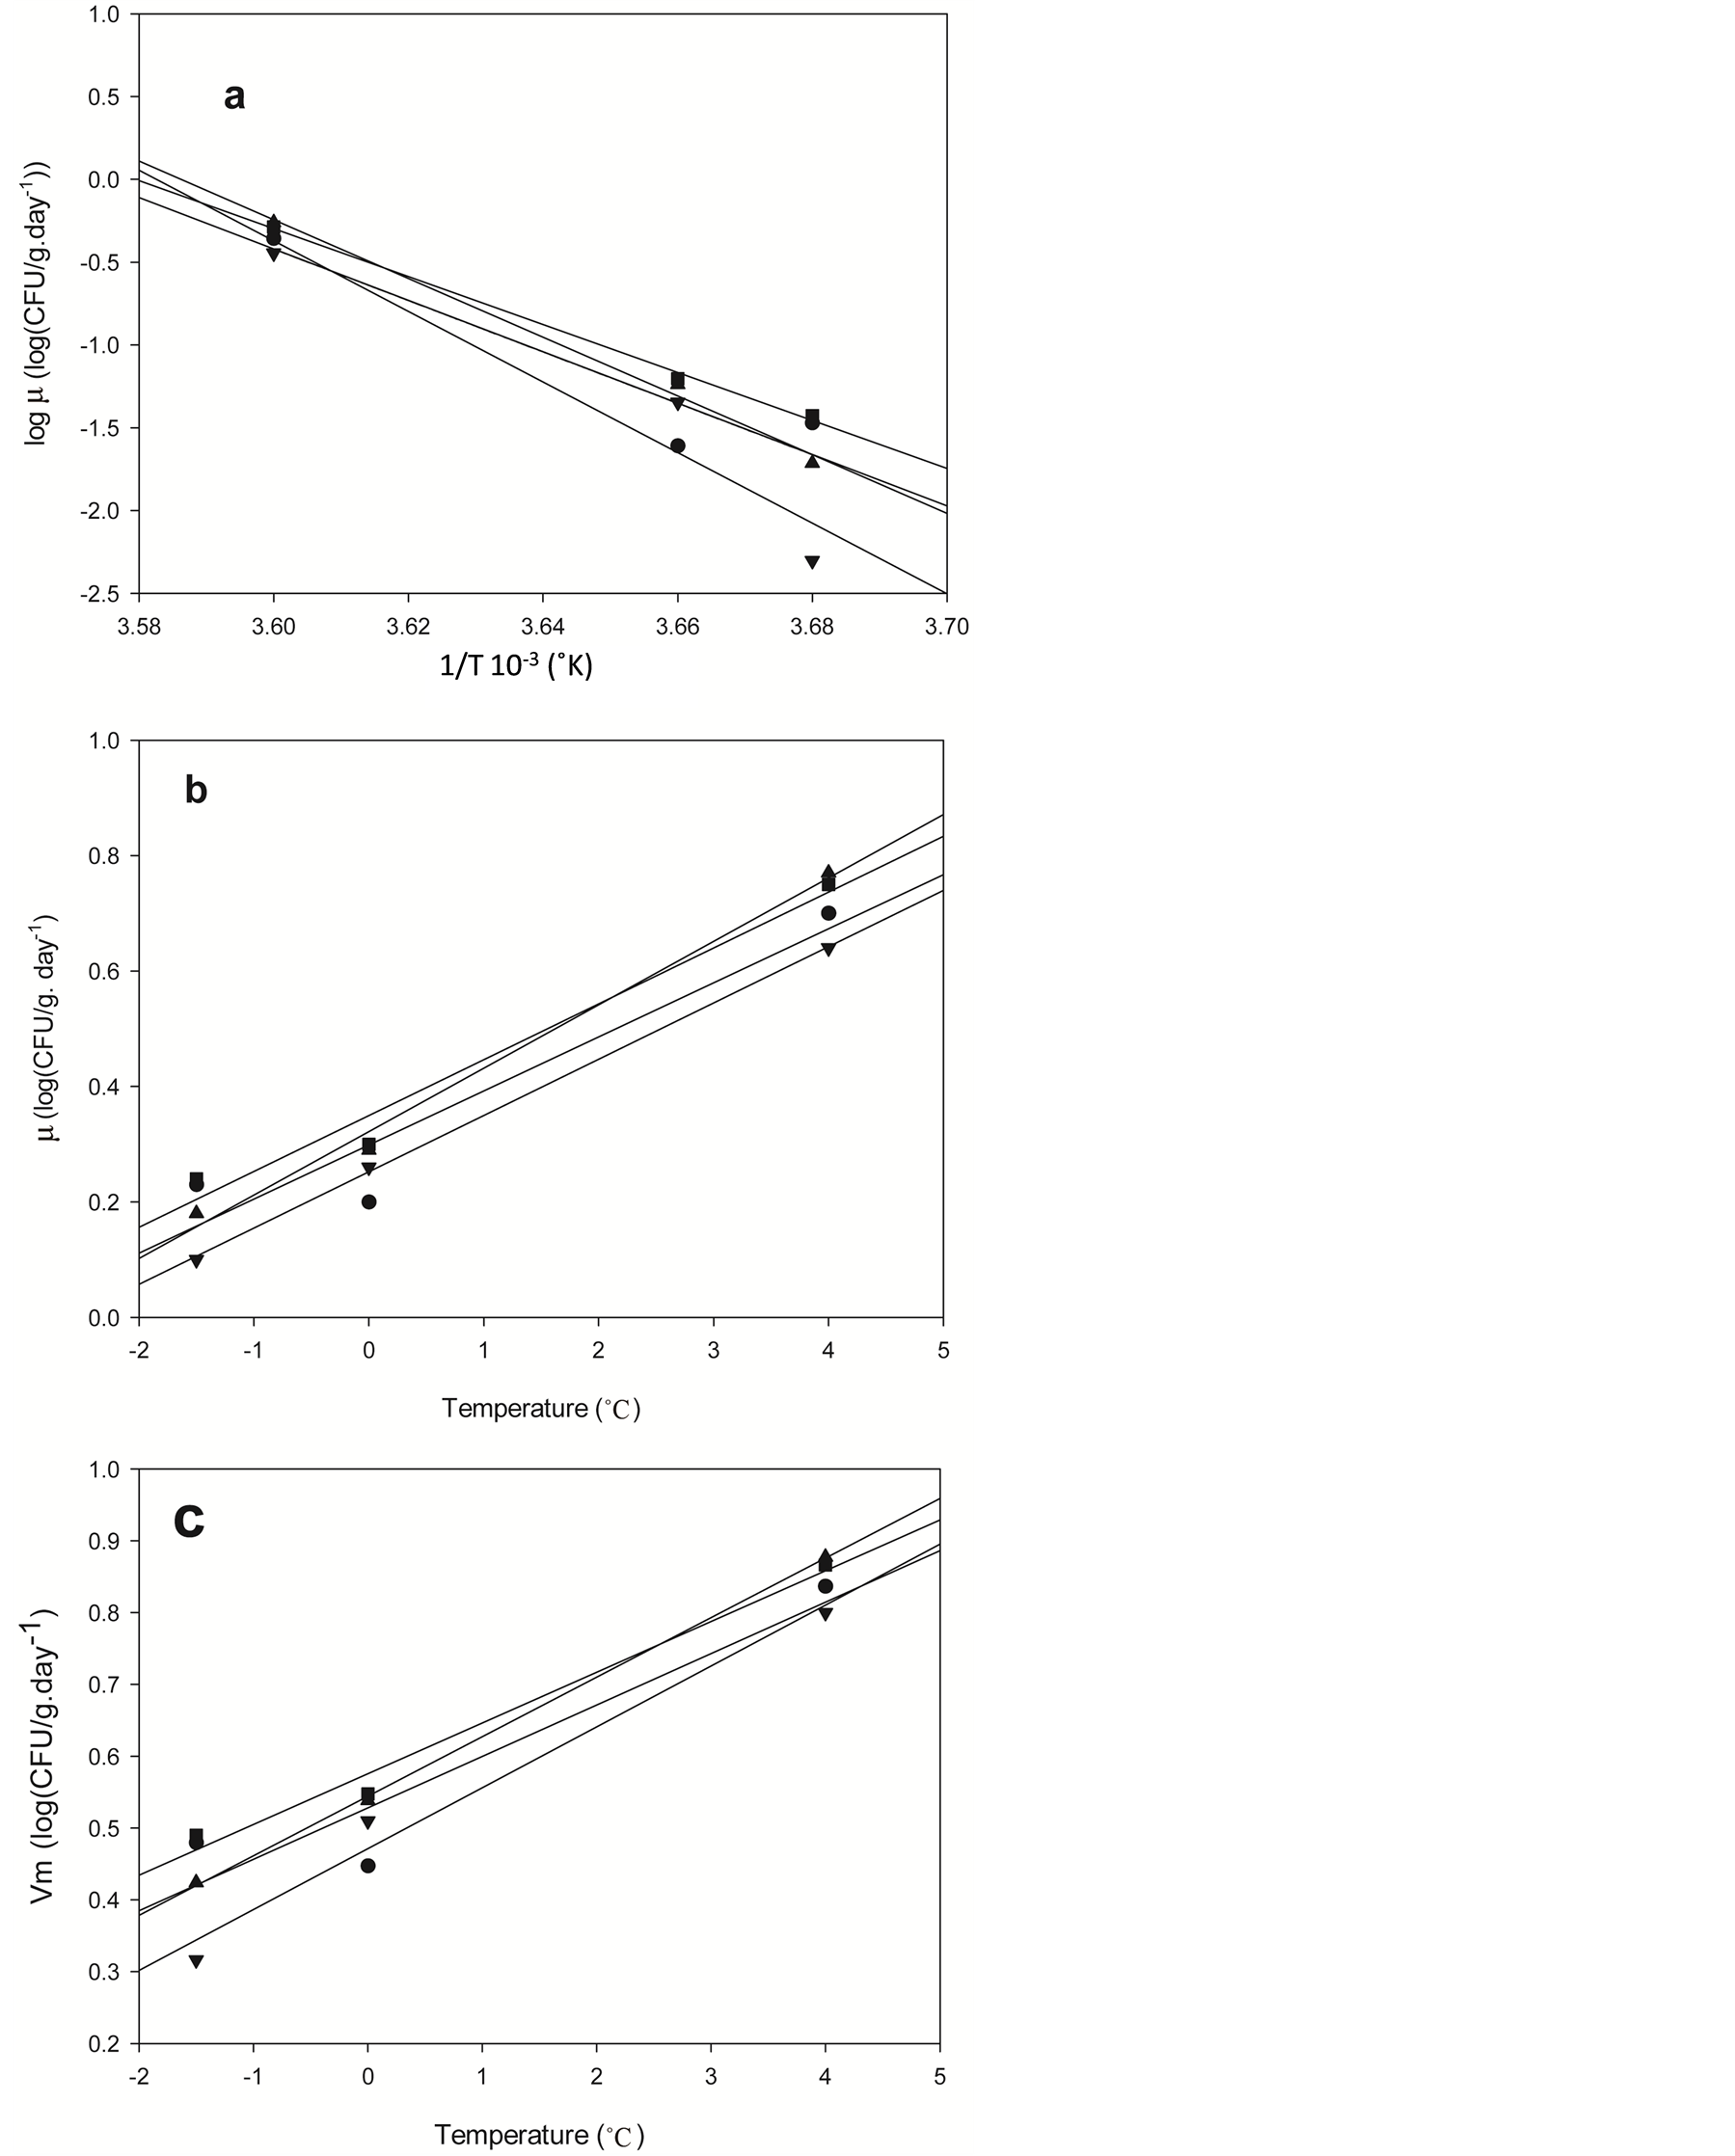
Figure 2. Effect of temperature on the specific growth rate of psychrotrophic microorganisms, sp. in pejerrey samples (a) Arrhenius model; (b) Linear model; (c) Square root model. ● treatment 1 (0.8 ppm of chloride) and packaged in polyethylene, ■ treatment 2 (a mixture of 0.8 ppm chloride water, 0.25% citric acid and 0.1% ascorbic acid) and packaged in polyethylene, ▲ treatment 1 (0.8 ppm of chloride) and packaged in ESE film, q treatment 2 (a mixture of 0.8 ppm chloride water, 0.25% citric acid and 0.1% ascorbic acid) and packaged in ESE film.
Table 2. Application of the Arrhenius model, linear and square root model to evaluate the effect of temperature on the specific growth rate and lag phase duration on psychrotrophs microorganisms, sp. in pejerrey fillet samples subjected to two different treatments and packaged in two different plastic films.
A [log(CFU/g)/day], Eμ [kJ/mol], μ0 [log(CFU/g)/day], d [log(CFU/g)/day. ˚C], q [log(CFU/g)/day]1/2, p [logCFU/g)/day)1/2/˚C], D [1/day], ELPD [kJ/mol], D [day−1], ELPD [KJoule∙mol−1].
function of temperature. The effect of temperature on the LPD can be interpreted as the period of adaptation of microorganisms to their new environment, which changes according to temperature.
The adaptation rate of microorganism defined as the reciprocal of LPD (1/LPD) [27] [28] was fitted to an Arrhenius type equation:
 (6)
(6)
where 1/LPD is adaptation rate [1/day] at temperature T (˚K); D is the preexponential factor [1/day], ELPD corresponds to the energy of activation (kJ/mol), and R corresponds to the value of the gas constant (8.31 J/mol∙˚K).
Figure 3 shows the plot of adaptation rate for psychrotrophic microorganisms, sp. in pejerrey fillets with different treatments and packaged in polyethylene and ESE films. The correlation coefficients (R2) ranged from 0.70 to 0.98 (Table 2). The lowest values of ELPD were obtained in samples packaged in ESE (59.6 and 76.5 kJ/mol) with treatment 1 and 2 respectively. The highest ELPD values (138.7 and 343.2 kJ/mol) were obtained in samples packaged in polyethylene with treatment 1 and 2 respectively which indicates their greater sensitivity to thermal changes.
3.3. pH Variation
The initial pH of the freshly fished pejerrey fillets was 6.86. This values was significantly higher than that samples treated with treatment 1 (6.86) and 2 (6.61). The initial pH decrease may be attributed to the dissolution of citric and ascorbic acid in the fish samples.
The pH values at the time when the psychrotrophic microorganisms, sp. counts reach 6 logCFU/g are present in Table3 Storage time had significant differences between (p < 0.05) effect on the final pH values, which tends to increase in samples treated with treatment 1 and packaged in polyethylene film. The values were 7.1, 6.8 and 7.4 in samples storage at 4˚C, 0˚C and −1.5˚C. These values are lower than the maximum pH level allowed in Argentina low for fish that is 7.4 for Argentine Food Code [29] .
The increase of pH may be attributed to the production of volatile basic components, such as ammonia and trimethylamine by fish spoilage bacteria [30] [31] .
The lower pH values were obtained in samples with treatment 2 and packaged in ESE film with values of 6.8, 7.0 and 6.9 at 4˚C, 0˚C and −1.5˚C respectively. It can be concluded that the lower pH of treatment 2 can enhance microbial inhibition and contributes to the extending of the preservation of fish samples for inhibiting the activity of the endogenous proteases by citric and ascorbic acid.
3.4. TVB-N and TMA-N Changes
Total volatile basic nitrogen (TVB-N) and trimethylamine (TMA-N) have been reported as spoilage compounds and proposed as fish spoilage indicators in many studies [32] [33] . TVB-N is widely used as an indicator for meat deterioration [34] . TVB-N in fish is mainly composed of ammonia and primary, secondary and tertiary amines [35] .
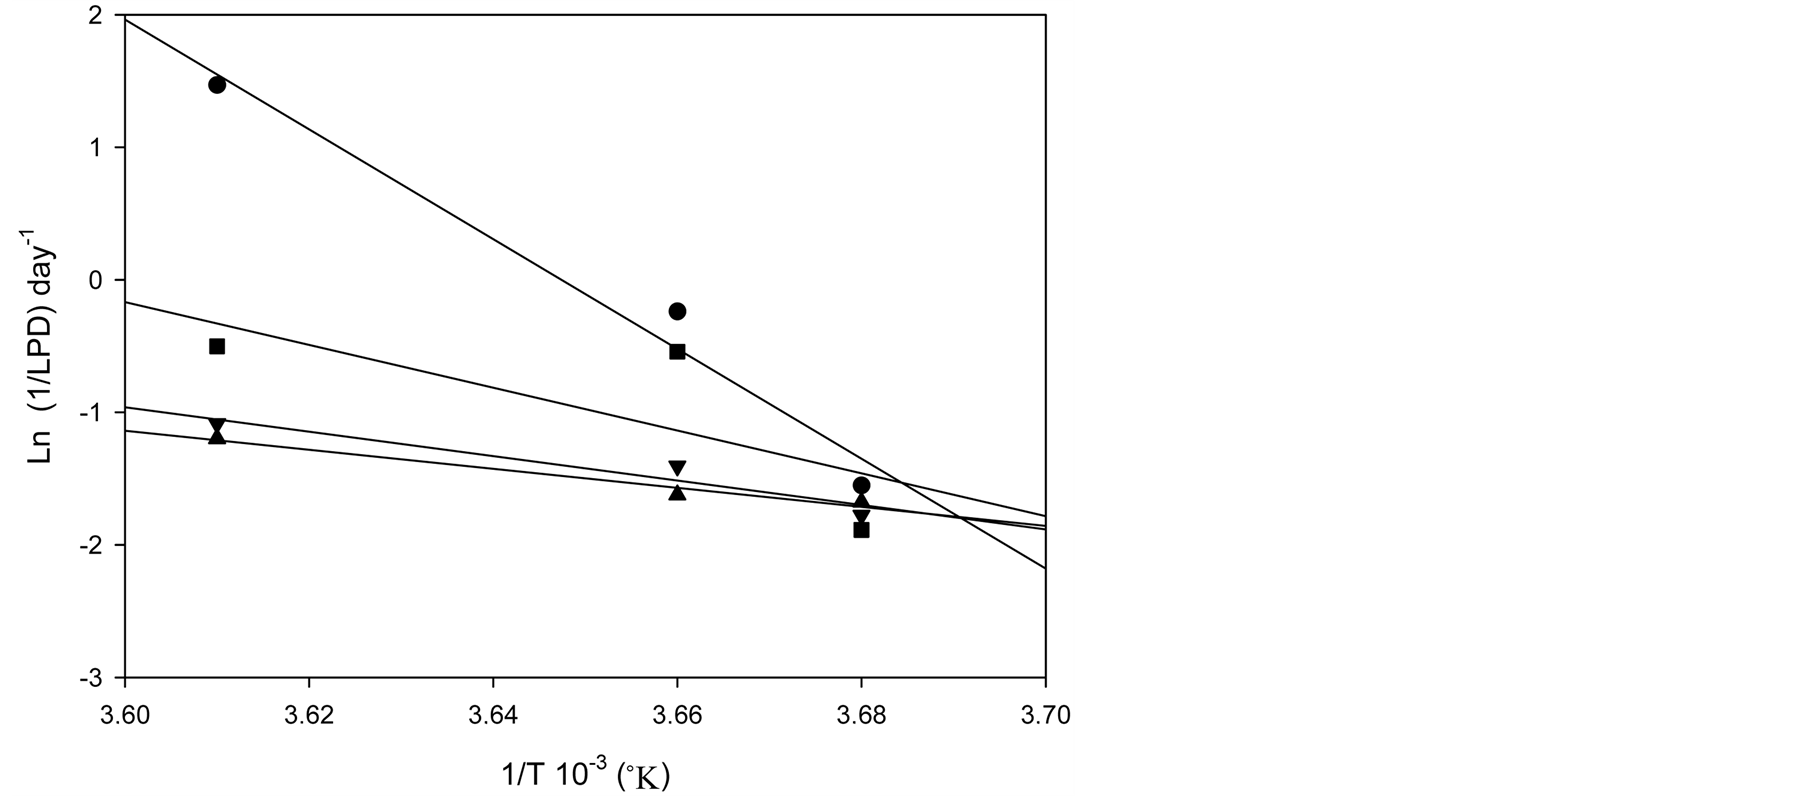
Figure 3. Arrhenius Plot of the adaptation rate (1/LPD) for Psychrotrophic microorganisms, sp. in pejerrey samples: ● treatment 1 (0.8 ppm of chloride) and packaged in polyethylene, ■ treatment 2 (a mixture of 0.8 ppm chloride water, 0.25% citric acid and 0.1% ascorbic acid) and packaged in polyethylene, ▲ treatment 1 (0.8 ppm of chloride) and packaged in ESE film, q treatment 2 (a mixture of 0.8 ppm chloride water, 0.25% citric acid and 0.1% ascorbic acid) and packaged in ESE film.
Table 3. Shelf life (day) at 4˚C, 0˚C and −1.5˚C of pejerrey fillet samples treated with different permeability of packaged film.
Different letter indicating significant difference (p < 0.05).
In the present work, pejerrey fresh muscle showed a level of 10 mg TVB-N/100 g. Similar amounts of TVB-N have been reported for other fish species [33] [34] . TVB-N values increased in all samples at the time when the psychrotrophic microorganisms, sp. counts reach 6 logCFU/g (Table 3). At 4˚C the lower value of TVB-N was found in samples treated with treatment 2 and packaged in ESE film (8.4 mg%); these may be due to either a reduced bacterial population or decreased capacity of bacteria for oxidative deamination of non-protein nitrogenous compounds or both. The highest values of TVB-N were observed in all samples stored by 25 days at −1.5˚C (14.3 - 20.1 mg%), these values were below the maximum limit of 33 mg% as defined by the Argentine Food Code [29] . A level of TVB-N of 35 - 40 mg% of fish muscle is usually regarded as spoiled [36] .
There were no significant differences (p < 0.05) between TMA-N contents of fish samples at the end of the storage period with different types of treatments and permeability films.
TMA-N contents increased from 1.4 mg% initially in fresh samples to 3.15 mg% - 4.0 mg% in samples with treatment 1 and 2 and polyethylene and ESE films respectively at the end of the storage period. This can be attributed to either a more rapidly reduced bacterial population or decreased capacity of bacteria for oxidative deamination of non-protein nitrogen compounds or both [35] , which was due to the effect of acid treatment.
The results of the present study agree with those of [37] who reported that at low temperature storage, such as refrigeration above 0˚C, TMA-N formation slows down noticeably.
TMA-N levels of 10 to 15 mg/100 g of muscle are considered as the limit of acceptability for human consumption in chilled fish [38] .
Reference [39] reported that TMA-N provided an adequate quality index for air-packed as well as modified atmosphere-packed fish fillets stored at 1.6˚C and could be used as a quality index for refrigerated fish fillets.
3.5. Colour Changes
Chroma* function of fillets under different conditions showed initial values that ranged between 9 and 10 in all the samples. At the time when the psychrotrophic microorganisms, sp. counts reach 6 logCFU/g, the Chroma* values measured in samples with treatment 1 and packaged in polyethylene and ESE films decreased in the range of 2 to 4. However, these changes were not observed by sensory evaluation. The Chroma* values in samples treated with treatment 2 and packaged in ESE film decreased in the range of 5 - 6; in polyethylene films the values obtained ranged of 3 - 4.
The results of colour variation allow us to conclude that treatment with chloride, citric and ascorbic acid and vacuum packaging minimizes the loss of colour conditions during storage, which could be explained by the inhibitory action of organic acids on poliphenoloxydase enzyme, which is responsible for the enzymatic browning on fish.
3.6. Texture Changes
Freshly fished pejerrey samples showed firmness values of 4.94 ± 1.45 N. During stored at different temperature, texture changes were modified due the activity of some enzymes such us calpain, cathepsin and collagenase which are involved in organoleptic changes like softness and split off of fillets. This concept agreed with Technical Document of Fish 348 [40] . At the time when the psychrotrophic microorganisms, sp. counts reach 6 logCFU/g, the texture changes were measured and the results are showed in Table3 No significant differences between treatment and packaged films were observed in firmness stored at 4˚C (p < 0.05). The fillets stored at 0˚C, packaged with polyethylene and treatment 1 and 2, showed firmness values not higher than 3.07 N. However, samples stored at 0˚C, vacuum packaged and treated with treatments 1 and 2 showed higher firmness values (5.20 and 4.83 N respectively).
Samples stored at −1.5˚C showed the highest firmness values, ranging between 4.67 - 6.69 N, this could be explained by the effect of temperature on the immobilization of no binding water, which delays spoilage caused by microorganisms and by endogenous enzymes of the fillets [41] .
3.7. Sensory Assessment
The acceptability of fish and fishery products during storage depends on the changes in their sensory attributes. The results were evaluated at the time when the psychrotrophic microorganisms, sp. counts reach 6 logCFU/g. The fish samples were considered to be acceptable for human consumption until the sensory score reached 4 [42] .
Results of the sensory assessment of samples with treatment 1 and stored at 4˚C indicate that sensory scores were 7 and 6 for samples packaged in ESE and polyethylene films respectively. Thus, samples with treatment 2 and packaged in ESE were acceptable up to 25 days and presented general acceptability score of 8 during the storage at −1.5˚C. The results indicated that samples with treatment 2 and packaged in ESE could be retaining their good quality characteristics in terms of sensory assessment. These conclusions were supported by the results for chemical quality analyses.
3.8. Shelf Life
Shelf life was defined as the refrigeration storage time at which the product reaches microbial counts of 6 ± 0.69 logCFU/g without any pathogens [43] , with TVB-N <20 mg%, TMA-N < 4 mg%, texture <7 N, colour modification chroma* values >4 and sensory evaluation >4. We used the psychrotrophic microorganisms, sp. counts as a predictor of the shelf life of the products. Shelf life values were calculated using the parameters obtained from the application of the Gompertz model, as the time at which psychrotrophic counts reached 6 logCFU/g. These values are shown in Table3 Confidence limits for the shelf life were calculated considering the average experimental error in microbial counts (−0.69 logCFU/g).
Shelf life in samples stored at 4˚C ranged from 3.4 to 7.7 days according to the type of treatment and the permeability film used. In samples stored at 0˚C the shelf life ranged from 8.6 to >25 days. In samples of pejerrey fillets stored at −1.5˚C the storage life was extended to >25 days.
The percentage of frozen water in superchilled fish is highly temperature-dependent (−1˚C = 19%; −2˚C = 55%; −3˚C = 70%; −4˚C = 76%) [44] . It has been suggested that negative effects of superchilling on drip loss, appearance, and texture of cod and haddock are due to formation of large ice crystals, protein denaturation and increased enzymatic activity in the partially frozen fish [45] ; however, no significant differences were found in texture and chemical deterioration of pejerrey fillets stored at 0˚C and at −1.5˚C. Superchilling has been used industrially with a few fish species such as tuna and salmon. The negative effects on sensory quality found for some other species may have limited the practical application of the technique. Nevertheless, it seems that shelf life of at least some seafood products is improved considerably by superchilling.
It was possible to obtain products with a shelf life of higher than 25 days by using treatment 2 and packaging with low gas permeability films and storage at −1.5˚C. These products had very good organoleptic characteristics, maintained their colour and texture appropriately, and absence of pathogenic microorganisms.
It has been suggested that vacuum packaging increases both sensory and shelf life [46] , varying with the type of fish used. Some authors have reported a significant increase in shelf life -between two and three times longerin modified-atmosphere packaged fish compared with that obtained in fish packaged in air or vacuum [47] .
Other authors [48] evaluated fresh trout fillets vacuum-packaged and stored at 3˚C, and they found that the products retained their acceptability for 7 days. It has been reported [49] that the organoleptic characteristics of whole golden perch (Bidyanus bidyanus), stored between 0˚C and 2˚C, treated with potassium sorbate as a preservative was acceptable during the first 10 days of storage. Steaks of tuna (Thunnus alalunga) stored under modified atmosphere conditions at 2˚C, showed that their organoleptic characteristics remained acceptable up to 8 days of storage [50] [51] .
It has been indicated that salmon fillets (Salmo salar) packaged in modified atmosphere conditions, maintained the same organoleptic conditions up to 13 days of storage [52] . In other marine fish, Salmo salar and Merluccius merluccius, the use of modified atmosphere packaging extended the shelf life of these products to 18 and 21 days [53] [54] . In marine fish such as mackerel fillets stored in a modified atmosphere, organoleptic characteristics were maintained for 21 days [55] .
It was mentioned that when using vacuum in weakfish (Cynoscion regalis) and storing the product in ice, duration of shelf life was between 14 and 17 days [46] .
4. Conclusions
In this work, treatment 2 and maintenance of the fillets at −1.5˚C yielded the most satisfactory results. At this temperature, the shelf life of fillets packaged in polyethylene was >25 days. Similar results were obtained in the case of the fillets packaged in low permeability film. The latter result was of great value as it was felt that this holding time is very satisfying. We found no literature data concerning this fish and this methodology [2] [9] [10] [31] [32] [34] -[36] [39] [41] [44] [47] [49] -[51] [53] -[55] .
Analysis of variance (ANOVA) applied to all the experimental data at three temperatures (4˚C, 0˚C and −1.5˚C), with the two types of washing solution and the type of packaging film (polyethylene and ESE) indicated that there were significant differences with storage time (p < 0.05), with the storage temperature and the type of packaging film. Taking into account that consumption of fresh pejerrey fillets (Odontesthes bonariensis) is popular in Argentina, and that potential microbiological hazard in fish products are highly dependent on initial bacterial counts and storage temperature, the fish industry could apply this methodology as a main tool to extend the shelf life and to ensure the safety of fish and to establish standards for avoiding microbial contamination.
References
- Bonetto, A.A. and Castello, H.P. (1985) Fishing and Fisheries in Inland Waters of Latin America. General Secretary of the Organization of American States, Regional Scientific and Technological Development Program, Washington DC, 67-70.
- Pantazi, A., Papavergou, A., Pournis, N., Kontominas, M.G. and Savvaidis, I.G. (2008) Shelf-Life of Chilled Fresh Mediterranean Swordfish (Xiphias gladius) Stored under Various Packaging Conditions: Microbiological, Biochemical and Sensory Attributes. Food Microbiology, 25, 136-143. http://dx.doi.org/10.1016/j.fm.2007.06.006
- Merritt, J.H. (1965) Superchilling on Board Trawlers. 6 Supplement au Bull. Institute International of Froid, 6, 183-190.
- Connell, J.J. and Shewan J.M. (1980) Past, Present, and Future of Fish Science. In: Connell, J.J., Ed., Advances in Fish Science and Technology, Farnham, Surrey, 56-65.
- Huss, H.H. (1988) Fresh Fish-Quality and Quality Changes. Food and Agricultural Organization, Fisheries Series No. 29, Rome.
- Sikorski, Z.E. (1990) Seafood: Resources, Nutritional Composition, and Preservation. CRC Press Inc., Boca Raton.
- Sikorski, Z.E., Pan, B.S. and Shahidi, F. (1994) Seafood Proteins. Chapman and Hall, New York.
- Olafsdóttir, G., Martinsdóttir, E., Oehlenschläger, J., Dalgaard, P., Jensen, B., Undeland, I., Mackie, I., Henehan, G., Nielsen, J. and Nilsen, H. (1997) Methods to Evaluate Fish Freshness in Research and Industry. Trends in Food Science and Technology, 8, 258-265. http://dx.doi.org/10.1016/S0924-2244(97)01049-2
- Stammen, K., Gerdes, D. and Caporaso, F. (1990) Modified Atmosphere Packaging of Seafood. Critical Reviews of Food Science and Nutrition, 29, 301-331. http://dx.doi.org/10.1080/10408399009527530
- Sivertsvik, M., Jeksrud, W.K. and Rosnes, J.T. (2002) A Review of Modified Atmosphere Packaging of Fish and Fishery Products—Significance of Microbial Growth Activities and Safety. International Journal of Food Science and Technology, 37, 107-127. http://dx.doi.org/10.1046/j.1365-2621.2002.00548.x
- Giannuzzi, L. and Zaritzky N. (1990) Sulfur Dioxide Effect on Microbial Growth in Refrigerated Pre-Peeled Potatoes Packaged in Plastic Film. Journal of Science and Food and Agriculture, 51, 369-379. http://dx.doi.org/10.1002/jsfa.2740510309
- Ali, F.H.M. (2011) Quality Evaluation of Some Fresh and Imported Frozen Seafood. Advance Journal of Food Science and Technology, 3, 83-88.
- AOAC (1984) Official Methods of Analysis. 17th Edition, Association of Official Analytical Chemists, Washington DC.
- Mac Faddin, J.F. (1979) Biochemical Test for Identification of Medical Bacteria. The Williams & Wilkins Company, Baltimore.
- Giannuzzi, L., Pinotti, A. and Zaritzky, N. (1998) Mathematical Modelling of Microbial Growth in Packaged Refrigerated Beef Stored at Different Temperatures. International Journal of Food Microbiology, 39, 101-110. http://dx.doi.org/10.1016/S0168-1605(97)00127-X
- Conway, E.J. (1962) Micro-Diffusion Analysis and Volumetric Error. 5th Editon, Crosby Lockwood & Sons Ltd., London.
- Amerine, M.A., Pongborn, R.H. and Roescler, E.B. (1965) Principles of Sensory Evaluation of Food. Academic Press, New York.
- Draper, N.R. and Smith, H. (1981) Applied Regression Analysis. John Wiley and Sons, Inc., Hoboken.
- Hatton, A.D. and Gibb, S.G. (1999) A Technique for the Determination of Trimethylamine-N-Oxide in Natural Waters and Biological Media. Analytical Chemistry, 71, 4886-4891. http://dx.doi.org/10.1021/ac990366y
- Gram, L., Webell-Neergaard, C. and Huss, H.H. (1990) The Bacteriology of Fresh and Spoiling Lake Victorian Nile Perch (Lates nilotocus). International Journal of Food Microbiology, 10, 303-316. http://dx.doi.org/10.1016/0168-1605(90)90077-I
- Liston, J. (1980) Microbiology in Fishery Science. In: Connel, J.J., Ed., Advances in Fishery Science and Technology, Fishing New Books, Farnham, 138-157.
- Aguilera, M., Amor, M., Ballabene, A., Barañano, S., Carella, E., Castagliola, M., Elbusto, C., Fagotti, A., Fritz, R., Jurquiza, V., Manca, E., Martinez Souto, L., Musmeci, J., Valle, M. and Zamora, A. (2001) Pautas microbiológicas para productos pesqueros en la República Argentina. La Industria Cárnica Latinoamericana, 22, 42-45.
- Lima dos Santos, C.A.M. (1981) The Storage of Tropical Fish in Ice: A Review. Journal of Tropical Science, 23, 97-127.
- Spencer, R. and Baines, C.R. (1964) The Effect of Temperature on Spoilage of Wet White Fish. Food Technology, 18, 769-773.
- Ratkowsky, D.A.R., McMeekin, T.A., Lowny, R.K., Stokes, A.N. and Chandler, R.E. (1983) Model for Bacterial Culture Growth Rate throughout the Entire Biokinetic Temperature Range. Journal of Bacteriology, 154, 1222-1226.
- Zwietering, M.H., Jongenburger, I., Rombouts, F.M. and Vant Riet, K. (1991) Modelling of the Bacterial Growth Curve. Applied and Environmental Microbiology, 56, 1875-1881.
- Li, K.Y. (1988) Microbial Stability of Intermediate Moisture Foods. Ph.D. Thesis, Oregon State University, Corvallis.
- Li, K.Y. and Torres, J.A. (1993) Microbial Growth Estimation in Liquid Media Exposed to Temperature Fluctuations. Journal of Food Science, 58, 644-648. http://dx.doi.org/10.1111/j.1365-2621.1993.tb04347.x
- CAA (2006) Argentine Food Code. Capitulo VI, Carnes y afines. http://www.anmat.gov.ar/
- Hyytia, E., Hielm, S., Mokkila, M., Kinnunen, A. and Korkeala, H. (1999) Predicted and Observed Growth and Toxigenesis by Clostridium botulinum Type E in Vacuum-Packaged Fishery Products Challenge Tests. International Journal of Food Microbiology, 47, 161-169. http://dx.doi.org/10.1016/S0168-1605(98)00173-1
- Ruiz-Capillas, C. and Moral, A. (2001) Residual Effect of CO2 on Hake (Merluccius merluccius L.) Stored in Modified and Controlled Atmospheres. European Food Research and Technology, 212, 413-420. http://dx.doi.org/10.1007/s002170000270
- Dalgaard, P., Gram, L. and Huss, H.H. (1993) Spoilage and Shelf Life of Cod Fillets Packed in Vacuum or Modified Atmospheres. International Journal of Food Microbiology, 19, 283-294. http://dx.doi.org/10.1016/0168-1605(93)90020-H
- Koutsoumanis, K. and Nychas, G.J.E. (2000) Application of a Systematic Experimental Procedure to Develop a Microbial Model for Rapid Fish Shelf Life Predictions. International Journal of Food Microbiology, 60, 171-184. http://dx.doi.org/10.1016/S0168-1605(00)00309-3
- Oehlenschlager, J. (1997) Stability of Ammonia-N, Dimethylamine-N, Trimethylamine-N, Trimethylamine Oxide-N and Total Volatile Basic Nitrogen as Freshness Indicators in Seafoods. In: Olafsdóttir, G., Luten, J., Dalgaard, P., Careche, M., Verrez-Bagnis, V. and Martinsdottir, L., Eds., Methods to Determine the Freshness of Fish in Research and Industry, Proceedings of the Final Meeting of the Concerted Action Evaluation of Fish Freshness-Air, International Institute of Refrigeration, Nantes, 92-99.
- Banks, H., Nickelson, R. and Finne, G. (1980) Shelf Life Studies on Carbon Dioxide Packaged Finfish from Gulf of Mexico. Journal of Food Science, 45, 157-162. http://dx.doi.org/10.1111/j.1365-2621.1980.tb02566.x
- Fan, W., Chi, Y. and Zhang, S. (2008) The Use of a Tea Polyphenol Dip to Extend the Shelf Life of Silver Carp (Hypophthalmicthys molitrix) during Storage in Ice. Food Chemistry, 108, 148-153. http://dx.doi.org/10.1016/j.foodchem.2007.10.057
- Ishida, Y., Fuji, T. and Kodata, H. (1976) Microbiological Studies on Salted Fish Stored at Low Temperature. I. Chemical and Microbial Changes of Salted Fish during Storage. Bulletin of the Japanese Society for the Science of Fish, 42, 351-358. http://dx.doi.org/10.2331/suisan.42.351
- Connell, J.J. (1990) Methods of Assessing and Selecting for Quality. Control of Fish Quality, 3rd Edition, Fishing News Books, Oxford, 240 p.
- Parkin, K.L., Wells, M.J. and Brown, W.D. (1981) Modified Atmosphere Storage of Rockfish Fillets. Journal of Food Science, 47, 181-184. http://dx.doi.org/10.1111/j.1365-2621.1982.tb11054.x
- FAO (Food and Agriculture Organization) (1988) Food Analysis. In: Martin, P.G., Ed., Manuals of Food Quality Control, FAO, Rome, 248.
- Uchiyama, H. and Ehira, S. (1974) Relation between Freshness and Acid-Soluble Nucleotides in Aseptic Cod and Yellowtail Muscles during Ice Storage. Bulletin Tokai Regulation Fishing Laboratory, 78, 23-31.
- Amerine, M.A., Pongborn, R.H. and Roescler, E.B. (1965) Principles of Sensory Evaluation of Food. Academic Press, New York, 602.
- Giannuzzi, L. (1998) Shelf Life of Fresh Filled Pasta. Hazard Analysis and Critical Control Points of the Manufacturing Process and Household Practice. Journal of Food Processing and Preservation, 22, 449-461. http://dx.doi.org/10.1111/j.1745-4549.1998.tb00362.x
- Ronsivalli, L.J. and Baker, D.W. (1981) Low Temperature Preservation of Seafoods: A Review. Marine Fisheries Review, 43, 1-15.
- Love, R.M. and Elerian, M.K. (1964) Protein Denaturation in Frozen Fish. VIII.—The Temperature of Maximum Denaturation in Cod. Journal of the Science of Food and Agriculture, 15, 805-809. http://dx.doi.org/10.1002/jsfa.2740151110
- Huang, Y., Kouadio, K. and Gates, K.W. (1993) Microbiological, Sensorial and Chemical Assessment of Pre-Packaged Weakfish during Iced Storage. Journal of Aquatic Food Product Technology, 2, 135-144. http://dx.doi.org/10.1300/J030v02n01_10
- Randell, K., Ahvenainen, R. and Hattula, T. (1995) Effect of the Gas/Product Ratio and CO2 Concentration on the Shelf-Life of MA Packed Fish. Packaging Technology and Science, 8, 205-218. http://dx.doi.org/10.1002/pts.2770080404
- González-Rodríguez, M.N., Sanz, J.J., Santos, J.A., Otero, A. and García-López, M.L. (2002) Numbers and Types of Microorganisms in Vacuum-Packed Cold-Smoked Freshwater Fish at the Retail Level. International Journal of Food Microbiology, 77, 161-168. http://dx.doi.org/10.1016/S0168-1605(02)00048-X
- Gelman, A., Glatman, L., Drabkin, V. and Harpaz, S. (2001) Effects of Storage Temperature and Preservative Treatment on Shelf Life of the Pond-Raised Freshwater Fish, Silver Perch (Bidyanus bidyanus). Journal of Food Protection, 64, 1584-1591.
- López-Gálvez, D.E., de la Hoz, L. and Ordóñez, J.A. (1995) Effect of Carbon Dioxide and Oxygen Enriched Atmospheres on Microbiological and Chemical Changes in Refrigerated Tuna (Thunnus alaluga) Steaks. Journal of Agricultural and Food Chemistry, 43, 483-490. http://dx.doi.org/10.1021/jf00050a042
- López-Gálvez, D.E., de la Hoz, L., Blanco, M. and Ordóñez, J.A. (1998) Refrigerated Storage (2°C) of Sole (Solea solea) Fillets under CO2-Enriched Atmospheres. Journal of Agricultural and Food Chemistry, 46, 1143-1149. http://dx.doi.org/10.1021/jf9706383
- Sivertsvik, M., Rosnes, J.T. and Kleiberg, G.H. (2003) Effect of Modified Atmosphere Packaging and Superchilled Storage on the Microbial and Sensory Quality of Atlantic Salmon (Salmo salar) Fillets. Journal of Food Science, 68, 1467-1472. http://dx.doi.org/10.1111/j.1365-2621.2003.tb09668.x
- Pastoriza, L., Sampedro, G., Herrera, J.R. and Cabo, M.L. (1996) Effect of Modified Atmosphere Packaging on Shelf-Life of Iced Fresh Hake Slice. Journal of the Science of Food and Agriculture, 71, 541-547. http://dx.doi.org/10.1002/(SICI)1097-0010(199608)71:4<541::AID-JSFA615>3.0.CO;2-H
- Pastoriza, L., Sampedro, G., Herrera, J.J. and Cabo, M. (1996) Effect of Carbon Dioxide Atmosphere on Microbial Growth and Quality of Salmon Slices. Journal of the Science of Food and Agriculture, 72, 348-352. http://dx.doi.org/10.1002/(SICI)1097-0010(199611)72:3<348::AID-JSFA666>3.0.CO;2-O
- Sccoll, M. and Oetterer, M. (2003) Use of Modified Atmosphere in Seafood Preservation. Brazilian Archives of Biology and Technology, 46, 569-580.
NOTES

*Corresponding author.