Food and Nutrition Sciences
Vol.5 No.8(2014), Article ID:44231,9 pages DOI:10.4236/fns.2014.58083
Physicochemical and Sensory Characterization of Banana and Araçá-Boi Jam
Eliseth de Souza Viana1, Jaciene Lopes de Jesus1, Ronielli Cardoso Reis1*, Marcos Vinícius Silva de Andrade2, Celio Kersul do Sacramento3
1Brazilian Agricultural Research Corporation, EMBRAPA, National Cassava & Fruits Research Center, Cruz das Almas, Brazil
2Federal University of Recôncavo Baiano, Cruz das Almas, Brazil
3State University of Santa Cruz, Ilhéus, Brazil
Email: *ronielli.reis@embrapa.br
Copyright © 2014 by authors and Scientific Research Publishing Inc.
This work is licensed under the Creative Commons Attribution International License (CC BY).
http://creativecommons.org/licenses/by/4.0/


Received 22 January 2014; revised 22 February 2014; accepted 5 March 2014
ABSTRACT
This study evaluated the physicochemical and sensory properties of mixed jam elaborated with banana and araçá-boi. Four banana extract (BE) and araçá-boi (AB) jams were prepared using the following proportions: F1 (70% BE:30% AB), F2 (60% BE:40% AB), F3 (40% BE:60% AB) and F4 (30% BE:70% AB). The jams were analyzed for physicochemical and sensory properties. The sensory acceptance test was performed by 50 panelists who were asked to indicate how much they liked/ disliked the jams based on the following attributes: color, aroma, flavor and texture. The formulations that contained more BE (F1 and F2) showed a lower titratable acidity (TA), higher ratio (SS/TA) and higher total sugar. A global analysis of the internal preference mapping verified that formulations F1 and F2 were preferred for flavor and had good acceptance levels for the other evaluated attributes, which indicated that the consumers favored jams with lower concentrations of AB and higher concentrations of BE. The formulation F1 was considered the most accepted for all attributes evaluated and showed high purchase intent (68%), and was therefore appropriate for industrialization and consumption.
Keywords:Musa spp.; Eugenia stipitata; Acceptance; Preference Mapping; Fruits Processing

1. Introduction
Banana (Musa spp.) is one of the most consumed fruits around the world (28 kg/habitant/year), ranking second place among tropical fruits for the volume of production (7.4 million tons in 2010) only behind orange (18.1 million tons in 2010) [1] . The good acceptance of the fruit is due to its sensory and nutritional aspects, which constitute a good source of energy, vitamins and minerals, such as potassium.
Araçá-boi (AB; Eugenia stipitata McVaugh) is a fruit native of western Amazon and the Guianas, and it is adapted to subtropical and tropical climates. In Brazil, AB is found in the Amazon region, Mato Grosso and Bahia State, but it has not been commercially explored. The fruit is a globe-shaped berry with a thin shell of canary yellow color when ripe, and it weighs between 30 and 800 g. The AB pulp is juicy with a pale yellow color, and it is not fibrous. Due to its high acidity, AB is not consumed fresh, but it has a great potential to be used in formulating juices, ice creams, jams and nectars, especially when combined with low acidity fruits [2] .
The development of new products with high proportions of fruit in their formulations and good functional and nutritional properties contributes to the diversification of the market possibilities, especially if they are attractive, practical and have a long shelf life [3] [4] . Jam is a product of intermediate moisture that is prepared using the pulp of fruits, sugar, pectin, acid and other ingredients that allow the conservation of such products for long periods of time, which allows the association of fruits to create new flavors [5] . The diversity of fruits on Brazilian region with adequate properties for this process demonstrates that this is a market with great growth potential [6] .
Mixed jams associate the characteristics of two or more fruits, allowing the achievement of a product with higher nutritional value and pleasant sensory properties and thereby adding value and creating the possibility of conquering a larger space in the consumer market. Some research has been made in this direction. Viana et al. [7] conducted study with mixed jellies with papaya and araçá-boi, and the jellies showed a high sensory acceptance. Singh et al. [8] evaluated the acceptance of different mixed fruit jellies and found a greater acceptance for papaya jam with pineapple, indicating the potential of the tropical fruits in the preparation of these products. Thus, with the great variety of fruits produced in Brazil, there is a possibility to associate flavors to make mixed jams using common fruits such as bananas, and unwell-known fruits such as AB.
The success of a food in the market depends on its performance with consumers. In the process of developing new products, evaluating its acceptance and/or preference becomes indispensable, and the most used sensory tests to obtain information on acceptance of a new product are affective preference tests [9] .
Therefore, the present study aimed to develop different formulations of mixed jams of banana and AB to obtain a product with a high sensory acceptance.
2. Materials and Methods
2.1. Processing of the Banana and AB Mixed Jam
Bananas of the “Prata” type in ripeness stage 6 were bought from local markets, and ripe AB fruits were produced at the Ouro Verde Farm in the Vila Brasil district of the county of Una, BA, Brazil.
The fruits were washed and sanitized in a solution of sodium hypochlorite with 50 mg·L−1 active chlorine for 15 minutes.
In preliminary tests, whole banana pulp did not result in a product with the characteristics of jam.
Thus, a methodology was developed to use these fruits for producing jams. The bananas were peeled, cut in slices and cooked in water for 30 minutes (1 L of water for each kg of sliced banana) to obtain a banana extract (BE), which was used in the product’s formula. The AB pulp was obtained using a semi-industrial depulper.
The jams were produced using different proportions of BE and AB as well as added sucrose in a 60:40 ratio (pulp:sucrose) and pectin GENU 105 of the trademark CP Kelco (high metoxilation content) in a 0.5% concentration (m/m). Four formulations were developed as follows: F1 (70% BE:30% AB), F2 (60% BE:40% AB), F3 (40% BE:60% AB) and F4 (30% BE:70% AB).
The pulp was mixed with sucrose (75% of total), and the pectin was added at the end of the process when the soluble solids achieved 63 °Brix to avoid its degradation.
2.2. Physicochemical Analyses of the Pulps and Jams
The BE, AB pulp and jams were analyzed for soluble solids (SS; in °Brix), pH, titratable acidity (TA; in % of malic acid), ratio (SS/TA), ash (%) and moisture (%) according to IAL [10] .
The reducing and total sugars were determined by spectrophotometry according to IAL [10].
The L*, a* and b* color parameters (luminosity, intensity of green/red and intensity of blue/yellow, respectively) were determined using a Minolta® CR400 colorimeter and the CIELAB color scale [11] . The calibration of the device was performed with a white ceramic plate using the D65 illuminant (z = 93.6; x = 0.3133; y = 0.3195).
2.3. Sensory Analysis
The sensory acceptance test was performed in individual cabins under white light by 50 panelists. The samples, which were coded with random three-digit numbers, were presented to panelists with salted biscuits at room temperature. The panelists washed their mouths with water intermittently to evaluate samples. The panelists were asked to indicate how much they liked/disliked the jams based on the following attributes: color, aroma, flavor and texture, according to a 7-point hedonic scale with the terms “disliked very much” (1) and “liked very much” (7) in the extremes of the scale [12] .
Preference ranking test was also conducted. A score of 1 was attributed to the “most preferred” jam, and a score of 4 was attributed to the “least preferred” jam.
To evaluate the consumer attitude in a hypothetical product purchase situation, a 5-point purchase intention scale was used, and the extremes were “certainly would not buy” and “certainly would buy”.
2.4. Experimental Design and Result Analysis
The experiment was conducted in a completely randomized design with three repetitions.
The physicochemical analysis data underwent a variance analysis (ANOVA) and contrast between means by Tukey’s test at 5% probability.
The acceptance test data underwent a variance analysis (ANOVA), contrast between means by Tukey’s test at 5% probability, frequency analysis, principal component analysis (PCA) to obtain the internal preference mapping and cluster analysis.
The frequency analysis of the hedonic scores was performed according to the following acceptance ranges: rejection, scores 1 - 3 indicate that consumers disliked the sample; and acceptance, scores 4 - 7 indicate that consumers liked the sample.
A cluster analysis of the different jam formulations was performed using the acceptance data independently of the sensory attributes using a similarity coefficient and the unweighted pair-group method with arithmetical average (UPGMA). The analyses were conducted using Statistica 7.0 software [13] and Genes software [14] .
Preference ranking data were analyzed by the Friedman test using the data from Newell and MacFarlane [15] .
3. Results and Discussion
3.1. Physicochemical Characterization
The AB pulp presented low SS content (4.59 °Brix) and pH (2.51). Such values are close to those reported by Rogez et al. [16] and Viana et al. [7] for the same fruit (Table 1). The acidity of the AB pulp was approximately 15 times greater than the acidity of the BE, which demonstrated that the association of these two fruits was an excellent combination for the production of jams.
The SS content of the formulations varied between 63.00 (F3) and 68.83 °Brix (F4) in accordance with the results obtained by Viana et al. [7] with papaya and AB jam. Similar values were obtained by Lago-Vanzela et al. [6] in mango jam (69 °Brix). Higher SS content values were obtained by Singh et al. [8] in mixed jams of pineapple and papaya (70.5 °Brix) as well as in mixed jams of papaya and orange (72.5 °Brix). The SS content is an important quality parameter for the process of making jams. The SS content values lower than 60 °Brix make the gel weak and the SS content values higher than 70 °Brix may cause crystallization of the sugar, an undesirable change in the texture of the jam. The SS content is also responsible for a higher or lower acceptance of the product, and jams with SS content between 65 and 70 °Brix have a good sensory acceptance according to several authors [17] [18] .
The TA of the different formulations ranged from 1.07% (F1) to 1.94% (F4), which was within the predetermined acidity range for fruit jams [7] [8] . These variations were attributed to the acid content of the pulps and its proportions within the formulations. Formulations F3 and F4 presented lower pH values and higher acidity due

Table 1 . Physicochemical characteristics of the pulps and jams made with banana extract (BE) and araçá-boi (AB). Means of three repetitions(2).
(1)Jam formulations evaluated. F1 = 70% BE:30% AB; F2 = 60% BE:40% AB; F3 = 40% BE:60% AB; F4 = 30% BE:70% AB. (2)Different letters within the lines indicate significant difference (p ≤ 0.05).
to the higher content of AB used in these formulations. Viana et al. [7] also verified an increase in acidity and a reduction of the pH in mixed jams made with papaya and AB in which higher proportions of AB were used.
The ratio (SS/TA) was higher for the F1 (63.90) and F2 (59.21) formulations because these formulations had lower acidity. The ratio is a quality index related to the sweetness of the product. Thus, higher ratio values indicate that the product presents a more pronounced sweetness, which directly affects consumer acceptance.
The moisture content ranged from 24.66% (F4) to 31.05% (F3), which were similar values to those observed by Viana et al. [7] in mixed jams of papaya with AB (25.99 and 29.93%). Lago-Vanzela et al. [6] observed moisture content values 29.5% in cajá manga jam. It is important to note that moisture content is directly related to the conservation of the product in storage, and jams with lower moisture content have a longer shelf life.
The sugar contents ranged from 50.71 (F3) to 60.86% (F1) for total sugars and from 39.02 (F1) to 50.89% (F4) for reducing sugars. Formulation F4 presented the highest reducing sugars content, which was significantly different (p ≤ 0.05) from the other reducing sugar contents. This result may be caused by the high acidity of this formulation (1.94%), which favored the inversion of the sucrose during the production of the jam. The same result was observed by Viana et al. [7] in mixed jams of papaya and AB in which the inversion process was greater for the formulation with higher AB content. Lago-Vanzela et al. [6] also verified high rates of hydrolysis of sugars in jams made with cajá manga, and they attributed this effect to the acidity of the fruit. The inversion process is desirable when elaborating jams as the reducing sugars give a more shiny aspect to the jam, minimize the crystallization of the sucrose, stop exudation and reduce the sweetness of the jams. Thus, jams with higher reducing sugar contents tend to present less crystallization during storage, which is favorable to the stability of the products.
The formulation with the highest percentage of BE (F1) showed higher ash content indicating that the BE contains higher mineral content than the AB pulp.
The formulations with greater AB content (F3 and F4) presented higher values for the L*, a* and b* parameters, indicating that these jams had lightness colors and higher intensity for yellow and red.
3.2. Sensory Acceptance
The mean acceptance scores for the four formulations are presented in Table2 There was a significant difference (p ≤ 0.05) among the four formulations for aroma and flavor, which indicated that these attributes were responsible for the differentiation among the jam samples.
Formulations F1 and F2, which contained lower concentrations of AB, presented higher acceptance for aroma and flavor and were classified by consumers as “like it” and “like it very much” according to the hedonic scale. A similar acceptance was observed for the other evaluated attributes, but there were no significant differences
Table 2 . Hedonic scores obtained by the acceptance test regarding the attributes of color, aroma, texture and flavor of jams made from banana extract (BE) and araçá-boi (AB). Means of three repetitions(1).
(1)Different letters within the columns indicate significant difference (p ≤ 0.05). (2)F1 = 70% BE:30% AB; F2 = 60% BE:40% AB; F3 = 40% BE:60% AB; F4 = 30% BE:70% AB. (3)Not significant at 5% probability level according to the F-test. (4)Significant at 5% probability level by the test-F. (5)Least significant difference.
(p > 0.05) among the formulations.
Acceptance and rejection frequencies of the formulations for each attribute are shown in Figure 1. All of the formulations presented acceptance levels greater than 84% for the attributes of color, aroma and texture. For the flavor, the jams with higher AB content (F3 and F4) presented the highest rejection indexes (22 and 32%, respectively), which indicated that the higher acidity and lower ratio of these jams (Table 1) negatively contributed to the flavor acceptance of the product.
The result of the preference ranking test is presented in Table3 The values with the lowest sums of the orders indicated that such samples were preferred by consumers. Formulations F1 and F4 differed among themselves (p ≤ 0.05) with F1 presenting a higher preference (lower sum of the orders) and F4 a lower preference (higher sum of the orders) by the consumers. The results of the preference test confirmed those obtained by the acceptance test (Table 2), as the preference of the jams decreased as the AB content increased.
By the cluster analysis (Figure 2) the consumers differentiated the samples for acceptance by forming two groups. The first group was comprised of formulations F3 (40% BE:60% AB) and F4 (30% BE:70% AB), and the second group was comprised of formulations F1 and F2. Thus, jams F1 (70% BE:30% AB) and F2 (60% BE:40% AB) were considered to be similar for acceptance.
The internal preference mapping generated from the acceptance data for the attributes of color, aroma, flavor and texture for the four formulations is presented in Figure 3. The consumers located in the central area of the graph did not present significant correlations (p > 0.05) with the two principal components. Such consumers did not differentiate the samples considering the evaluated attributes.
For every attribute evaluated, the two first components were greater than 70%, which was enough to represent the dispersion of the formulations, thereby explaining most of the data variation.
For the color attribute (Figure 3A), the spatial separation of the formulations suggested a difference in the acceptance among the four formulations. The consumers who positively correlated with PC 1 gave higher grades to F1 and F2, and the consumers who negatively correlated with PC 1 preferred formulations F3 and F4. The consumer dispersion suggested that the four jams had a similar preference for this attribute, which agreed with the results obtained from the mean test (Table 2) where there was no difference in acceptance among the four formulations.
Figure 3B represents the preference mapping for aroma. The two principal components explained 88.3% of the data variation, and PC 1 explained the greatest variation (68.4%). The spatial position of the samples indicated the creation of three distinct groups, and jams F1 and F2 were considered similar for aroma. As well as the color attribute, the consumers were homogenously distributed on all four quadrants, which indicated that the samples had similar acceptance levels for this attribute.
For flavor, the two principal components explained 90.1% of the acceptance data variance (Figure 3C). Formulations F1 and F2, which were positioned at the left side of the chart, were considered similar concerning PC 1, differing from formulations F3 and F4. Most consumers were negatively correlated with PC 1, preferring formulations F1 and F2. A small group of consumers was positively correlated with PC 1, indicating that this group liked the jams F3 and F4.
For the texture attribute, the two principal components were responsible for 78.4% of the total acceptance data variance (Figure 3D). Formulations F1 and F2 were considered to be similar regarding texture, differing from formulations F3 and F4. However, the consumers were dispersed among the four quadrants, indicating that there
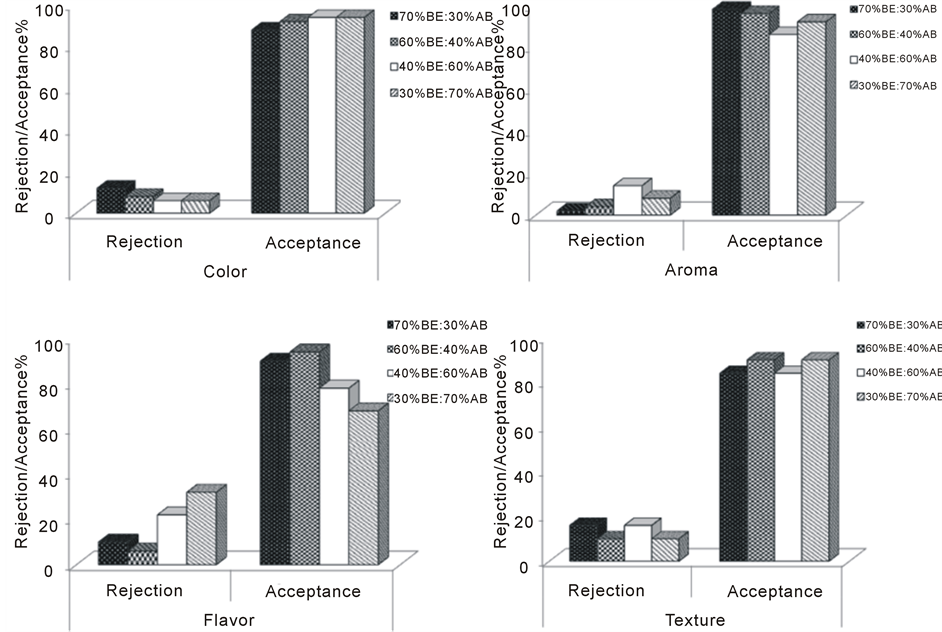
Figure 1. Consumer acceptance and rejection frequencies for the four jam formulations made with banana extract (BE) and araçá-boi (AB).
Table 3. Hedonic scores obtained by the acceptance test regarding the attributes of color, aroma, texture and flavor of jams made from banana extract (BE) and araçá-boi (AB). Means of three repetitions(1).
(1)F1 (70% BE:30% AB); F2 (60% BE:40% AB); F3 (40% BE:60% AB); F4 (30% BE:70% AB). (2)Values with the lowest sums of the orders indicate that such samples are more preferred by the consumers as a decreasing preference scale was used. Values followed by the same letter within the lines did not differ among themselves according to the Friedman test (p > 0.05). (ns) Not significant. (*)Significant. DMS = 34.
was acceptance for all four jam formulations.
A global analysis of the internal preference mapping verified that formulations F1 and F2 were preferred for flavor and had good acceptance levels for the other evaluated attributes, which indicated that the consumers favored jams with lower concentrations of AB and higher concentrations of BE.
For the purchase intent among the “certainly would buy” and “possibly would buy” categories, 68% indicated that they would buy formulation F1 (70% BE:30% AB) and 64% would buy F2 (60% BE:40% AB) if they were commercialized (Figure 4). The purchase intent percentage decreased as the AB content increased in product. For formulations containing 30% BE and 70% AB (F4), only 36% of the consumers had purchase intent for this product.
The same result was obtained by Viana et al. [7] . The authors observed that jam with lower percentages of araçá-boi showed higher sensory acceptance and high purchase intent by consumers. Therefore, the araçá-boi
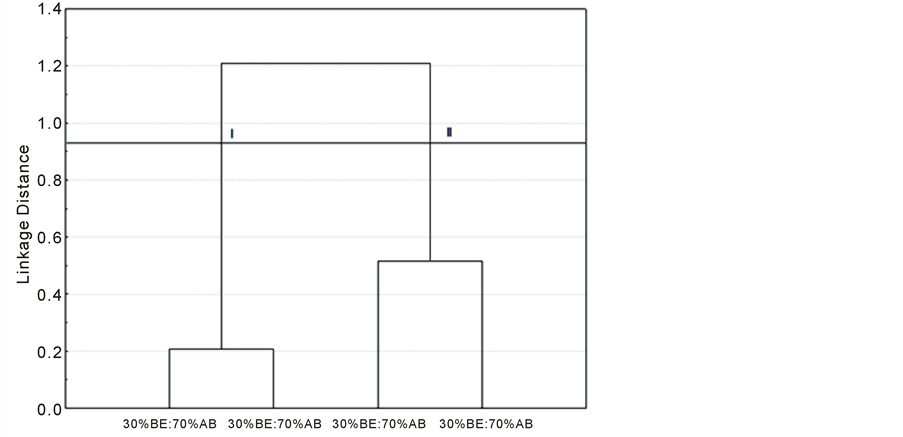
Figure 2. Cluster analysis of the acceptance test of the jams formulated with different proportions of banana extract (BE) and araçá-boi (AB).
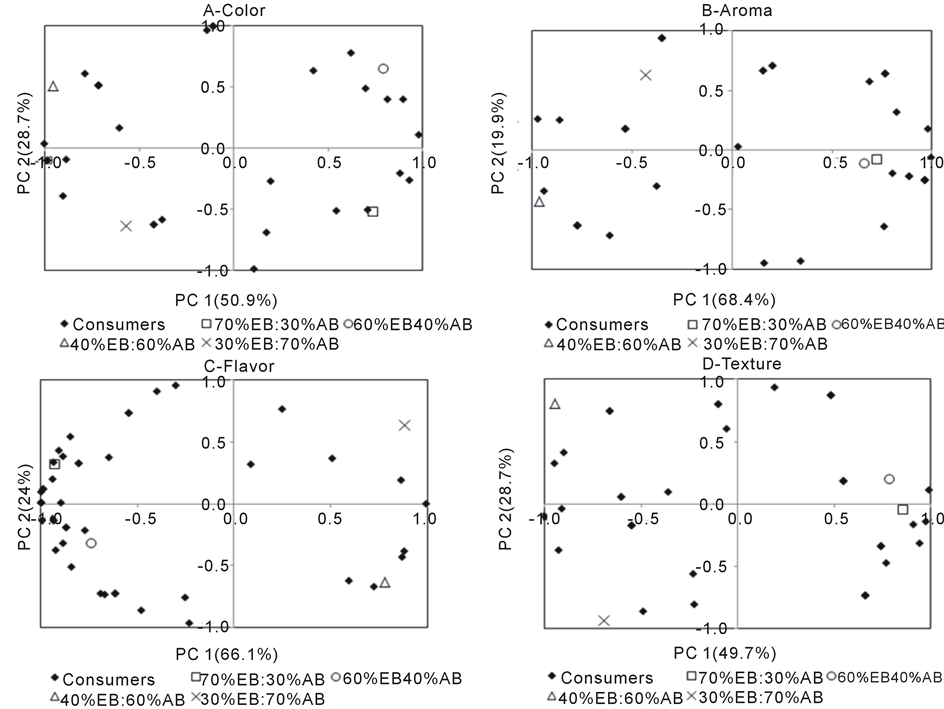
Figure 3. Internal preference mapping for the four jam formulations made from banana extract (BE) and araçá-boi (AB) regarding the evaluated sensory attributes. The acceptance grades given to each formulation determine the position of each formulation according to the two principal components for each evaluated attribute. Each point represents the acceptance data correlation of a consumer to the two first principal components, i.e., each point represents a consumer.
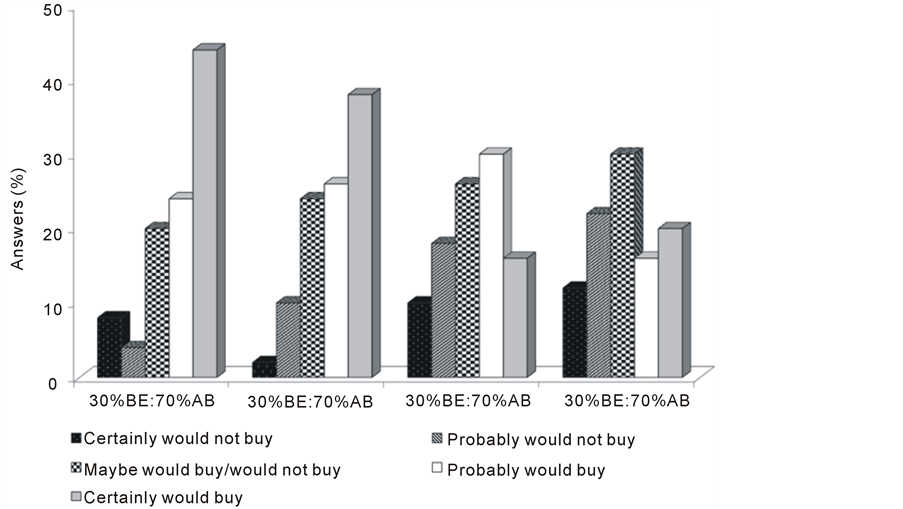
Figure 4. Purchase intent for jams made with banana extract (BE) and araçá-boi (AB) in different proportions.
can be used for preparation of jellies but in low concentration due to its high acidity.
4. Conclusion
Jam formulations containing 70% and 60% BE and 30% and 40% AB presented a good sensory acceptance and high purchase intent of consumers, thereby indicating that these formulations are adequate for industrialization and consumption. Increasing the AB concentration was detrimental for the acceptance of the jam.
Acknowledgements
The authors would like to thank the Bahia Research Foundation (FAPESB) for the financial support of this project.
References
- FAOSTAT—Food and Agriculture Organization of the United Nations (2012) http://faostat.fao.org/site/567/DesktopDefault.aspx?PageID=567
- Sacramento, C.K., Barretto, W.S. and Faria, J.C. (2008) Ara?á-Boi: Uma Alternativa para Agroindústria. Revista Bahia Agrícola, 8, 22-24.�
- Martín-Esparza, M.E., Escriche, I., Penagos, L. and Matínez-Navarrete, N. (2011) Quality Stability Assessment of a Strawberry-Gel Product during Storage. Journal of Food Process Engineering, 34, 204-223. http://dx.doi.org/10.1111/j.1745-4530.2008.00349.x
- Martín-Esparza, M.E., Escriche, I., Penagos, L. and Matínez-Navarrete, N. (2011). Significance of Osmotic Temperature Treatment and Storage Time on Physical and Chemical Properties of a Strawberry-Gel Product. Journal of Science and Food Agriculture, 91, 894-904. http://dx.doi.org/10.1002/jsfa.4262
- Basu, S., Shivhrare, U.S., Singh, T.V. and Beniwal, V.S. (2011) Rheological, Textural and Spectral Characteristics of Sorbitol Substituted Mango Jam. Journal of Food Engineering, 105, 503-512. http://dx.doi.org/10.1016/j.jfoodeng.2011.03.014
- Lago-Vanzela, E.S., Ramin, P., Guez-Umsza, M.A., Samtps, G.V., Gomes, E. and Silva, R. (2011) Chemical and Sensory Characteristics of Pulp and Peel Cajá-Manga (Spondias cytherea Sonn.) Jelly. Ciência e Tecnologia de Alimentos, 31, 398-405. http://dx.doi.org/10.1590/S0101-20612011000200018
- Viana, E.S., Jesus, J.L., Reis, R.C., Fonseca, M.D. and Sacramento, C.K. (2012) Physicochemical and Sensorial Characterization of Papaya and Ara?á Boi Jelly. Revista Brasileira de Fruticultura, 34, 1154-1164. http://dx.doi.org/10.1590/S0100-29452012000400024�
- Singh, S., Jain, S., Singh, S.P. and Singh, D. (2009) Quality Changes in Fruit Jams from Combinations of Different Fruit Pulps. Journal of Food Processing and Preservation, 33, 41-47. http://dx.doi.org/10.1111/j.1745-4549.2008.00249.x
- Stone, H. and Sidel, J.L. (2004) Sensory Evaluation Practices. 3rd Edition, Academic, London, 408 p.
- IAL—Instituto Adolfo Lutz (2005) Métodos fíSico-Químicos para Análise de Alimentos. 4th Edition, Instituto Adolfo Lutz, S?o Paulo.�
- (2007) Minolta, Chroma Meter CR-400/410: Instruction Manual, Osaka, 156 p.
- Minim, V.P.R. (2006) Análise Sensorial: Estudos com Consumidores. Vi?osa, Ed. UFV, 225 p.�
- Statsoft, Inc. (2008) Statistica for Windows (Data Analysis Software System), Version 8.0. 298 p. Computer Program Manual, Quick Reference. Statsoft. Inc., Tulsa.
- Cruz, C.D. (2001) Genes Software. UFV, Vi?osa.�
- Newell, G.J. and Macfarlane, J.D. (1987) Expanded Tables for Multiple Comparison Procedures in the Analysis of Ranked Data. Journal of Food Science, 52, 1721-1725. http://dx.doi.org/10.1111/j.1365-2621.1987.tb05913.x
- Rogez, H., Buxan, R., Mignolet, E., Souza, J.N.S., Silva, E.M. and Larondelle, Y. (2004) Chemical Composition of the Pulp of Three Typical Amazonian Fruits: Araca-Boi (Eugenia stipitata), Bacuri (Platonia insignis) and Cupua?u (Theobroma grandiflorum). European Food Research and Technology, 218, 380-384. http://dx.doi.org/10.1007/s00217-003-0853-6�
- Lago, E.S., Gomes, E. and Silva, R. (2006) Production of Jambolan (Syzygium cumini Lamarck) Jelly: Processing, Physical-Chemical Properties and Sensory Evaluation. Ciência e Tecnologia de Alimentos, 26, 847-852. http://dx.doi.org/10.1590/S0101-20612006000400021
- Damiani, C., Vilas Boas, E.V.B., Soares Junior, M.S., Caliari, M., Paula, M.L., Pereira, D.E.P. and Silva, A.G.M. (2008) Physical, Sensory and Microbiological Analysis of Mango Jams Formulated with Different Levels of Peels in Substitution to Pulp. Ciência Rural, 38, 1418-1423. http://dx.doi.org/10.1590/S0103-84782008000500035
NOTES

*Corresponding author.