Food and Nutrition Sciences
Vol. 4 No. 9A2 (2013) , Article ID: 36230 , 5 pages DOI:10.4236/fns.2013.49A2006
Sensing the Moisture Content of Dry Cherries—A Rapid and Nondestructive Method
![]()
1United States Department of Agriculture, Dawson, USA; 2R&D, Cherry Central, Traverse City, USA; 3Department of Biotechnology, K.L. University, Vaddeswaram, India; 4New Mexico State University, Clovis, USA.
Email: *chari.kandala@ars.usda.gov
Copyright © 2013 Chari Venkatkrishna Kandala et al. This is an open access article distributed under the Creative Commons Attribution License, which permits unrestricted use, distribution, and reproduction in any medium, provided the original work is properly cited.
Received July 15th, 2013; revised August 15th, 2013; accepted August 22nd, 2013
Keywords: Cherries; Moisture Content; Capacitance; Impedance; Phase Angle; Regression; CI Meter
ABSTRACT
Impedance (Z), and phase angle (θ) of a parallel-plate capacitor with a single cherry fruit between the plates were measured using a CI meter (Chari’s Impedance meter), at 1 and 9 MHz. Capacitance C was derived from Z and θ, and by using the C, θ, and Z values of a set of cherries whose moisture content (MC) values were later determined by the hot air-oven method, a calibration equation was developed. Using this equation, and their measured C, θ, and Z values, the MC of a group of cherries, not used in the calibration, was predicted. The predicted values were compared with their vacuum-oven values. The method worked well with an R2 value of 0.98 and a standard error of prediction (SEP) of 1.24, in the measured moisture range between 5% and 20%.
1. Introduction
The United States is the second-largest producer of cherries in the world, right behind Turkey, the leading producer. Cherries are of two varieties, prunusavium L, the sweet one, and prunuscerasus L, the tart one. The later variety is predominantly grown in the state of Michigan. Cherries are highly perishable, and to preserve them for longer periods, they are subjected to drying to decrease their moisture content to a safe level [1]. Dried cherries have a much longer shelf life, and are available to the consumer, at any time during the year [2]. However, dried fruits are also susceptible to damage by microorganisms as in the case of cereals and nuts. High moistures are known to be conducive to such damages that leave the fruits unfit for human consumption. Drying the fruit was found to have a minimal effect on its nutritional value, and have the advantage of occupying less storage place than the fresh fruit. Drying of cherries is usually done by atmospheric forced-air driers, by passing hot air over them at controlled relative humidity, till they dry to the required MC value. During the process the MC has to be measured repeatedly to ensure that the heating is stopped when the required moisture value is obtained. Over-heating could increase the drying costs, and adversely affect the quality of the fruit. Presently available methods for moisture determination in fruits such as cherries are the standard vacuum-oven method [3] and the Karl Fisher titration method [4]. In the vacuum-oven method, the MC is determined by heating the samples in a vacuum-oven at 70˚C till a constant weight is obtained. The method is time-consuming and destructive. In the Karl Fisher method, the fruit is ground to a pulp and used in the titration. This method is also time-consuming and destructive. Thus, a method which is rapid and nondestructive would be of great use in the fruit industry to measure the MC content repeatedly, and without sample preparation or destroying the sample. In this work, an electrical method is described that would be suitable for cherries and similar fruits.
2. Basic Principles
Previous research showed that the variation in dielectric constant with MC for shelled yellow field-corn was more pronounced between 1 and 5 MHz [5]. Thus, (εr1 − εr2), the difference in the dielectric constants at 1 and 5 MHz or any other higher frequency, should be a good indicator of the moisture present in the material. The difference in capacitance of a parallel-plate system of plate area A and separation d at two frequencies can be written as
 (1)
(1)
where, εr1 and εr2 are the dielectric constants of the material between the plates at the two frequencies, and ε0 is the permittivity of free space (8.854 × 10⁻¹² Farad/m). Though (C1 − C2) has to be a good estimate of the MC, it was highly influenced by the size and shape of the sample held between the plates [6]. Variations in two other related electrical parameters, phase angle (θ) and dissipation factor (D) were also considered and empirical equations were developed, to estimate MC of corn, wheat, shelled and in-shell peanut samples, that included terms, (C1 − C2), (θ1 − θ2), and (D1 − D2) at 1 and 5 MHz [7]. This minimized the errors due to the variations in the size and shape of the samples.
The phase angle change, (θ1 − θ2) accounts for the loss factor. Dissipation factor is a measure of energy loss that results from subjecting a dielectric to an alternating current electric field. It is related to the Q factor of the peanut material and is a measure of the energy stored in the electric field relative to energy dissipated in any one period. The power dissipated depends on the equivalent resistance of the complex circuit, and thus the variation in the impedance values, (Z1 − Z2) of the system at the two frequencies adequately represents the term (D1 − D2). Thus, from the values of (C1 − C2), (θ1 −θ2) and (Z1 − Z2) measured with a two parallel-plate system fitted inside a cylinder, the MC of the grain, nuts or any other aqueous sample could be estimated to an acceptable accuracy [8]. For a single parallel-plate system the semi-empirical equation used was:
 (2)
(2)
where, C1, θ1, Z1, and C2, θ2, Z2 are the capacitance, phase angle and impedance at 1 MHz and 5 MHz respectively. A0 … A6 are the calibration constants. The calibration constants were evaluated from measurements on several samples of known MC values, and applying a least squares computation. The square terms were included to compensate for the nonlinearity in the dependence of MC on these variables. In the case of cherries, the measurements at 1 and 9 MHz were used as they gave the best predictions of the moisture.
3. Moisture Meter
An impedance meter called the CI meter (Chari’s Impe-

Figure 1. Block diagram of the electronic circuit of CI meter.
dance meter) designed and developed by the first author was used to measure the two parameters, impedance (Z) and phase angle (θ). Three frequencies 1, 5 and 9 MHz are generated by crystal oscillators as shown in the block diagram (Figure 1) drawn for 1 MHz. The electronic circuits for the three frequencies are similar. These signals are applied to the parallel-plate electrode system (z) alternately, by switching through a multiplexer. Initially, at 1 MHz, the current, flowing through this system with an impedance Z, is fed into an op-amp. The same current flows through the range resistor Rr. The output voltage of the op-amp and the original 1 MHz signal from the oscillator are rectified and measured as em1 and er1 respectively. This is done similarly, at 5 and 9 MHz. The capacitance of the parallel-plate system is computed as: C = −1/2πfX, where X = |Z|Sinθ.
4. Electrode System
The electrode system made for this study consisted of two circular plane and parallel electrodes, made of brass and 25-mm in diameter, between which the samples were held. During the measurements five or six dry cherries were placed on the lower electrode and held in position by the upper electrode which can be moved up and down under a light spring pressure (Figure 2). Care was taken to make sure that the samples were sitting well within the parallel-plates to avoid any possible edge-effects of the transmitted radiation. The CI meter measured the phase angle and impedance of the parallel-plate system, with the cherry samples between them, at each of the frequencies 1, 5, and 9 MHz. The separation between the parallel-plates was initially adjusted such that even the thinnest cherry sample would be in contact with both the
Figure 2. Parallel-Plate Electrode System with cherry sample between them.
upper and lower plates. The spring pressure on the upper plate was adjusted according to the softness of the samples used, and the measurements were taken after the upper plate comes to rest in a fixed position, as indicated by the thickness gauze. A computer program was used to control, and collect data from the CI meter.
5. Cherry Samples
The cherry samples used in this work were supplied by Cherry Central1, Traverse City in Michigan, a processing and marketing corporation for cherries. The cherries samples were dried and processed, and were packaged for marketing. The initial moisture content of the samples received was about 11.5% as determined by the Karl Fischer titration method. The cherries were divided into seven groups of about 200 g each. Leaving one group at the original MC level of 11.5%, two groups were dried by hot-air blowers for different durations to get two lower MC levels. To the rest of the four groups appropriate quantities of distilled water was added to develop four higher MC levels. Thus, a total seven moisture groups were developed, and were placed in air-tight Mason jars. The jars were kept in a cold storage at 4˚C for a week, taking care to periodically rotate the jars to obtain homogenous samples at the same MC level within each jar. After one week, three replicate samples from each jar were subjected to the standard oven method for determining their MC values. After taking their wet weight, samples were dried in an oven at 70˚C ± 1˚C for 6 h under a pressure ≤100 mm Hg. The MC levels of the seven groups available for the experiment were, 5.5, 9.5, 11.5, 13.5, 15.5, 17.5 and 20%. From these groups with MC values 5.5, 9.5, 13.5, 17.5, and 20% were used for calibration, and were called the calibration lots. Groups with MC values of 5.5, 11.5, 15.5, 17.5, and 20% were used for validation and were called the validation lots. Measurements were made on 30 samples from each of the calibration and the validation groups, repeating each measurement three times on the CI meter. Though the MC levels 17.5% and 20% appear in both calibration and validation lots, the samples used for validation were different from the ones used for calibration.
6. Measurements
The MC values of the samples in each group of these two lots, determined by the Vacuum oven method, were considered as the standard average MC value for that group for the purpose of calibration and validation. All the samples were allowed to reach room temperature before the measurements. The room temperature was maintained at 21˚C ± 1˚C. Cherry samples from the 5.5% MC group were placed in between the parallel-plates, till they occupy the space between the two plates without protruding from the edges. The plates accommodated about 5 to 7 cherries. The parallel-plate sensor was connected to the CI meter, from which the RF signals, applied through one of the plates, go through the sample, and return through the second plate into the CI meter. Three measurements of Z, and θ were made at 1, 5 and 9 MHz, using the CI meter on this sample, and fed into the computer. From the values of Z and θ the corresponding C value was computed by the program, and all three values were stored in the computer. The procedure was repeated on another 29 samples from this group, and on 30 samples from each of the other MC groups from both the calibration and validation lots.
7. Results and Discussion
From the θ and Z values measured on the five calibration groups the C values were computed for each measurement. In the first group, each of the 30 samples is assigned the average MC value of 5.5%, the standard value obtained by the oven method. Similarly, the other four groups have their MC values as 9.5%, 13.5%, 17.5% and 20%. Applying SAS [9] procedures for regression analysis the values of the constants A0 to A6 in Equation (2) were determined from these calibration groups using the measured values of θ, Z and the corresponding C and MC values. The values thus obtained for the constants were:
To check the fitness of Equation (2) initially in the calibration groups, the numerical values of constants were substituted in Equation (2), and using the C, θ and Z values measured for each sample, its MC value was calculated. The MC values thus calculated were averaged for the 30 samples in each group and compared with the vacuum oven value assigned to that group. The results are shown in Table 1. Also shown are the standard deviations in each group. In column 3 are shown the difference between the oven and the CI meter determined values. The calibration model had an R2 of 0.94, and the standard error of calibration (SEC2) was 1.23. The closeness of the predicted values to the oven values as indicated by the differences shown in column 3 above, and a good R2 and SEC values indicate the good fit of the calibration equation. However, similar measurements were made on validation lots not used in the calibration, MC values were calculated using Equation (2), averaged over 30 samples in each group and compared with the oven values. The results are shown below along with differences and standard deviations in Table 2.
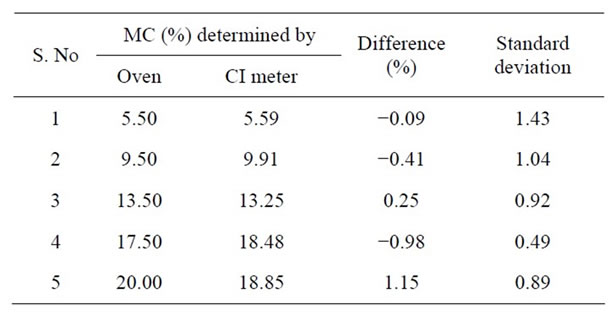
Table 1. Moisture Content of calibration groups calculated by Equation (2), and compared with standard values (average of 30 measurements for each sample).

Table 2. Moisture Content of validation groups calculated by Equation (2), and compared with standard values (average of 30 measurements for each sample).
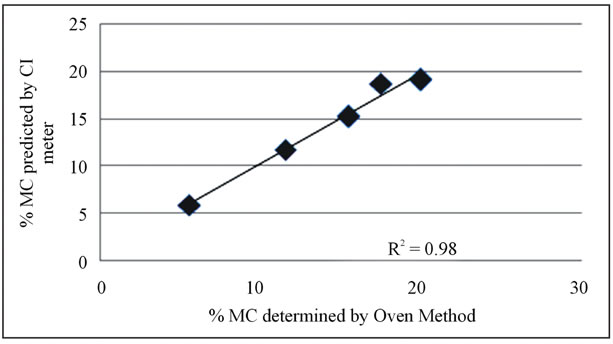
Figure 3. Comparison of predicted and oven values for the validation groups.
The difference in the predicted and the oven values, for the validation groups as shown above are very similar to the calibration group values. So are the standard deviations. The standard error of prediction (SEP3) was 1.24 which is very comparablewith the SEC value of 1.23. Plotted in Figure 3 below are the predicted and oven determined values for the validation groups. The validation results had an R2 value of 0.98. Close SEC and Sep values along with a good R2 value for both the calibration and prediction of the validation group indicate that the CI meter is suitable for predicting moisture content in dry cherries non-destructively and rapidly. Better accuracies could be obtained by improving the MC determinations with the vacuum oven, and making measurements on larger moisture groups.
8. Conclusion
Measurements of impedance Z, and phase angle θ of a sample of cherries between the sensor plates of the CI meter, described here, can be used in an empirical equation to estimate the average moisture content of the cherries in the sample. This method is rapid and nondestructive and has the potential to replace the presently used cumbersome methods such as Karl Fischer titration. A commercial model made on these lines can save money and labor in the dry fruit industry.
REFERENCES
- I. Doymaj and O. Ismail, “Drying Characteristics of Sweet Cherry,” Food and Bioproducts Processing, Vol. 89, No. 1, 2011, pp. 31-38. doi:10.1016/j.fbp.2010.03.006
- S. Jokic, D. Velic, M. Bilic, J. Lukinac, M. Planinic and A. Bucic-Kojic, “Influence of Process Parameters and Pre-Treatments on Quality and Drying Kinetics of Apple Samples,” Czech Journal of Food Sciences, Vol. 27, No. 2, 2009, pp. 88-94.
- AOAC, “Official Method of Analysis of the Association of Official Analytical Chemists,” No. 934.06, Arlington, 1990.
- W. R. Windham, “Comparison between Liquid and Paste Karl Fischer Extraction for NIRS Water Calibrations,” Journal of the Association of Official Analytical Chemists, Vol. 72, No. 2, 1989, pp. 255-258.
- S. O. Nelson, “Frequency and Moisture Dependence of the Dielectric Properties of High-Moisture Corn,” Journal of the Microwave Power, Vol. 13, No. 2, 1978, pp. 213- 218.
- C. V. K. Kandala and S. O. Nelson, “Measurement of Moisture Content in Single Kernels of Peanuts: A Nondestructive Electrical Method,” Transactions of the American Society of Agricultural Engineers, Vol. 33, No. 2, 1990, pp. 567-572.
- C. V. K Kandala and S. O. Nelson, “RF Impedance Method for Nondestructive Moisture Content Determination for In-Shell Peanuts,” Measurement Science and Technology, Vol. 18, No. 4, 2007, pp. 991-996. doi:10.1088/0957-0233/18/4/005
- C. V. K. Kandala and J. Sundaram, “Nondestructive Measurement of Moisture Content Using a Parallel-Plate Capacitance Sensor for Grain and Nuts,” IEEE Sensors Journal, Vol. 10, No. 7, 2010, pp. 1282-1287. doi:10.1109/JSEN.2010.2041446
- SAS Institute, “Statistical Analysis Software for Windows,” Version 8.1, SAS Institute, Cary, 2000.
NOTES
*Corresponding author.
1Mention of company or trade names is for the purpose of description only and does not imply endorsement by the US Department of Agriculture.
2SEC =  where n is the number of observations, p is the number of variables in the regression equation with which the calibration is performed, and ei is the difference between the observed and reference value for the ith observation.
3SEP = 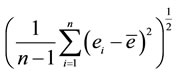 where n is the number of observations, ei is the difference in the moisture content predicted and that determined by the reference method for the ith sample, and ē is the mean of ei for all of the samples.