Food and Nutrition Sciences
Vol. 3 No. 2 (2012) , Article ID: 17512 , 8 pages DOI:10.4236/fns.2012.32026
Content of Genome-Protective Micronutrients in Selected Fresh and Processed Foods in the Australian State of Victoria
![]()
1CSIRO Food and Nutritional Sciences, Werribee, Australia; 2CSIRO Food and Nutritional Sciences, Adelaide, Australia.
Email: *chakra.wijesundera@csiro.au
Received October 24th, 2011; revised December 1st, 2011; accepted December 8th, 2011
Keywords: Micronutrients; Genome Stability; DNA Damage; Food; Cancer; Aging; Calcium; β-Carotene; Folic Acid; Niacin; Retinol; Selenium; Vitamin B12; Vitamin E; Zinc
ABSTRACT
Maintenance of genome stability by preventing DNA damage is crucially important for counteracting carcinogenesis and age-associated diseases. The levels of niacin, vitamin E, vitamin B12, folate, β-carotene, retinol, magnesium, calcium, selenium and zinc, which are key micronutrients considered to be important in the prevention of genome damage, were measured in a range of fresh and processed foods available to consumers in the state of Victoria, Australia. Some of the richest dietary sources of the micronutrients, expressed as a percentage of the (Australian) recommended dietary (daily) intake for adults per 100 g of food, were: wheat germ oil (vitamin E, 1400%); oyster (vitamin B12, 2666%); rice bran (niacin, 296% and magnesium, 212%); chicken liver (folate, 354%); beef liver (retinol, 1777%); golden sweet potato (β-carotene); brazil nuts (selenium, 404%); wheat bran (zinc, 575%); skim milk powder (calcium, 116%). The data will be useful for formulating dietary guidelines for micronutrient intake as well as for formulating functional foods enriched in key micronutrients.
1. Introduction
DNA damage or genomic instability is now recognised as the most fundamental cause of cancer [1-3] as well as aging and age-associated diseases [4-6]. Genomic instability is a characteristic of almost all human cancers, and is present at all stages of cancer, from pre-cancerous lesions to advanced cancers [3]. DNA relies solely on repair of existing molecules to prevent excessive accumulation of damage over a lifetime. If mis-repair or inaccurate replication of the DNA template occurs, surviving cells may be subjected to permanent changes in the genetic code in the form of mutations or chromosomal aberrations, both of which increase the risk of cancer [4].
Micronutrients, which are required in very small quantities (typically less than 100 micrograms/day) for the healthy functioning of the human body, play an important role in the detoxification of endogenous genotoxins (e.g. reactive oxygen species), as cofactors of DNA repair enzymes or in the synthesis of nucleotides required for DNA synthesis and repair. Micronutrients that have been associated with altered genome stability include trace elements such as magnesium, selenium, zinc as well as vitamins such as retinol (vitamin A), β-carotene (pro-vitamin A), riboflavin (vitamin B2), niacin (vitamin B3), biotin (vitamin B-complex), pantothenic acid (vitamin B5), folic acid (vitamin B9), and α-tocopherol (vitamin E) [7,8]. A growing body of literature suggests an important role for micronutrients in the maintenance of genome stability [7,9- 14]. Mechanisms of diet induced epigenetic changes and their implications for health have recently been reviewed [15]. Assurance of an adequate intake of micronutrient through appropriate dietary adjustments and/or through fortified foods has been mooted as a strategic preventative measure against cancer and other diseases of aging [1,7,16-18].
The micronutrient contents of many fresh and processed foods can be found in nutritional data tables such as NUTTAB [19]. However, the data presented in these tables have been gathered from different sources and using different analytical methods over a period of time, and therefore do not necessarily reflect the micronutrient levels in foods consumed by the population in a particular city. We sampled fresh and processed foods, considered to be rich in ten key genome-protective micronutrients from fresh food markets and supermarkets within the city and suburbs of Melbourne, all within a period of three weeks. Here, we report on the content of these key micronutrients in the selected foods measured simultaneously using the same analytical methods.
2. Experimental
2.1. Food Samples
All samples were purchased from supermarkets or fresh produce retailers within the city of Melbourne or suburbs, over a three-week period in May 2009. The categories of products analysed for each micronutrient are listed in Table 1. For a given micronutrient, a minimum of five food (fresh or processed) varieties were selected targeting those expected to contain relatively high levels of the micronutrient of interest according to the most recent NUTTAB reference database of Food Standards Australia and New Zealand [20]. Fortified products were not included. Where possible, up to ten samples of the same food were selected. The samples were chosen to represent variations in origin, point of sale, or brand. In the case of beef and lamb, top-side and mid-loin cuts were analysed, respectively. It was assumed that these cuts represent the respective meats. Chicken breast and thigh samples were analysed separately. Care was taken to store the samples under appropriate conditions until analysis. Chemical analyses were performed in triplicate and completed within 4 weeks.
2.2. Chemical Analysis
2.2.1. Niacin
The niacin content was determined by high performance liquid chromatography (HPLC) according to the method of Ward and Trenerry [21]. Briefly, niacin was liberated from the food matrix by alkaline digestion with aqueous digestion with calcium hydroxide and analysed by HPLC using C18 column and photo diode array (PDA) detection (260 nm).
2.2.3. Retinol
Retinol was measured according to a published procedure [22]. Briefly, the sample was saponified with ethanolic potassium hydroxide and the retinol extracted in to petroleum ether. The extract was then analysed by silica column HPLC and photo diode array detection at 325 nm.
2.2.4. Folate
Folate content was determined according to the microbiological method of US FDA [23]. Briefly, the sample diluted in phosphate buffer was autoclaved for 5 min at 100˚C, filtered, and the filtrate autoclaved 121˚C for a further 5 min. The filtrate was inoculated with culture at 37˚C for 20 h and turbidity measured at 620 nm. The folate content was calculated by comparing the turbidity of the sample with that of a folate standard.
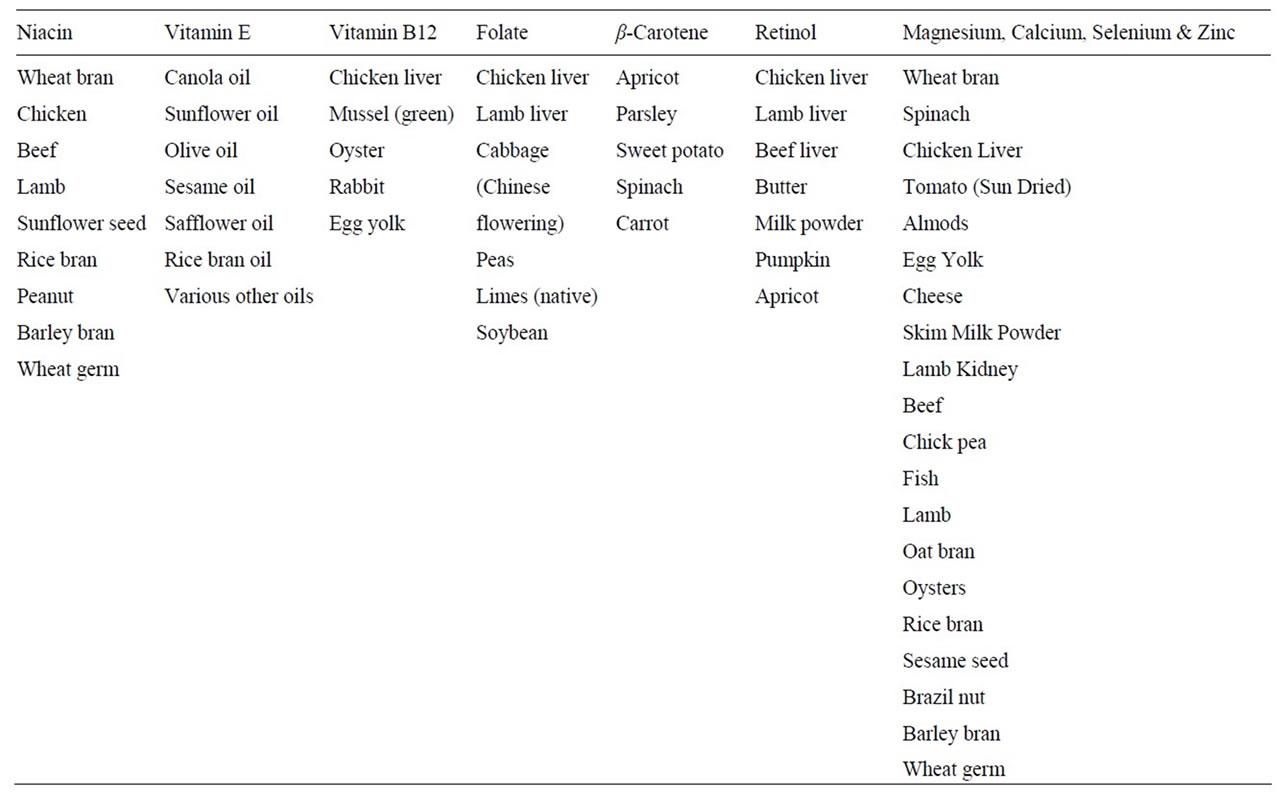
Table 1. List of fresh and processed foods selected for micronutrient analysis.
2.2.4. β-Carotene
The β-carotene content was determined according to the method of [24]. Briefly, the carotenes were extracted with a mixture of hexane/ethanol/acetone and analysed by HPLC using a C18 column and PDA detection at 450 nm.
2.2.5. Vitamin B12
The vitamin B12 content was measured by a microbiological assay based inoculation with Euglena gracillis. In brief, the sample was homogenised with acetate buffer, acidified and autoclaved. The supernatant containing the vitamin B12 was inoculated with euglena gracillis and the culture was allowed to grow for 5 days. The vitamin B12 content in the sample was determined by the absorbance of the culture at 640 nm compared that of standards treated similarly.
2.2.6. Trace Elements
The content of trace elements were determined by inductively coupled plasma-mass spectrometry (ICP-MS) and inductively coupled atomic emission spectrometry (ICPAES). In brief, the sample was homogenised and digested with nitric acid and analysed for trace elements using ICP-MS and or ICP-AES.
3. Results and Discussion
Table 2 shows the dietary intake levels (per day) of the selected genome protective micronutrients that have been recommended for Australians and New Zealanders [25].
It is considered that a low probability of micronutrient inadequacy can be achieved by intake levels at or above the levels shown in the table. Fenech et al. [18] who studied the association between dietary intake of selected micronutrients and genome damage in lymphocytes measured using the micronucleus assay showed that vitamin E, retinol, folate, niacin, and calcium were associated with significant reductions in micronucleus frequency when their daily intake levels were greater than 7.9 mg, 296.4 μg, 206.6 μg, 20.0 mg, and 927.7 mg, respectively. With a view to assessing the best sources of foods for each of the key micronutrients, we analysed a range of fresh and processed foods for micronutrient content.
Sixteen different varieties of vegetable oils were analysed for individual tocopherols including vitamin E (α- tocopherol) (Table 3). They included several specialty oils, namely grape seed oil, almond oil, apricot seed oil, Brazil nut oil, pumpkin seed oil, macadamia oil, and wheat germ oil as well as commonly used cooking oils. Wheat germ oil contained the highest level (140 mg/100g) of vitamin E; the next highest being sunflower oil (55 mg/ 100g), followed by almond (48 mg/100g), apricot seed (46 mg/100g), and canola (19 mg/100g) oils. Wheat germ oil stood out in terms of the content of β-tocopherol (60 mg/100g) as well as the total tocopherol content (227 mg/100g). No other oil contained greater than 1% β-tocopherol. Currently, wheat germ oil is available only as a speciality oil and is a potential natural source of vitamin E for the production of functional foods aimed at preventing genome damage.
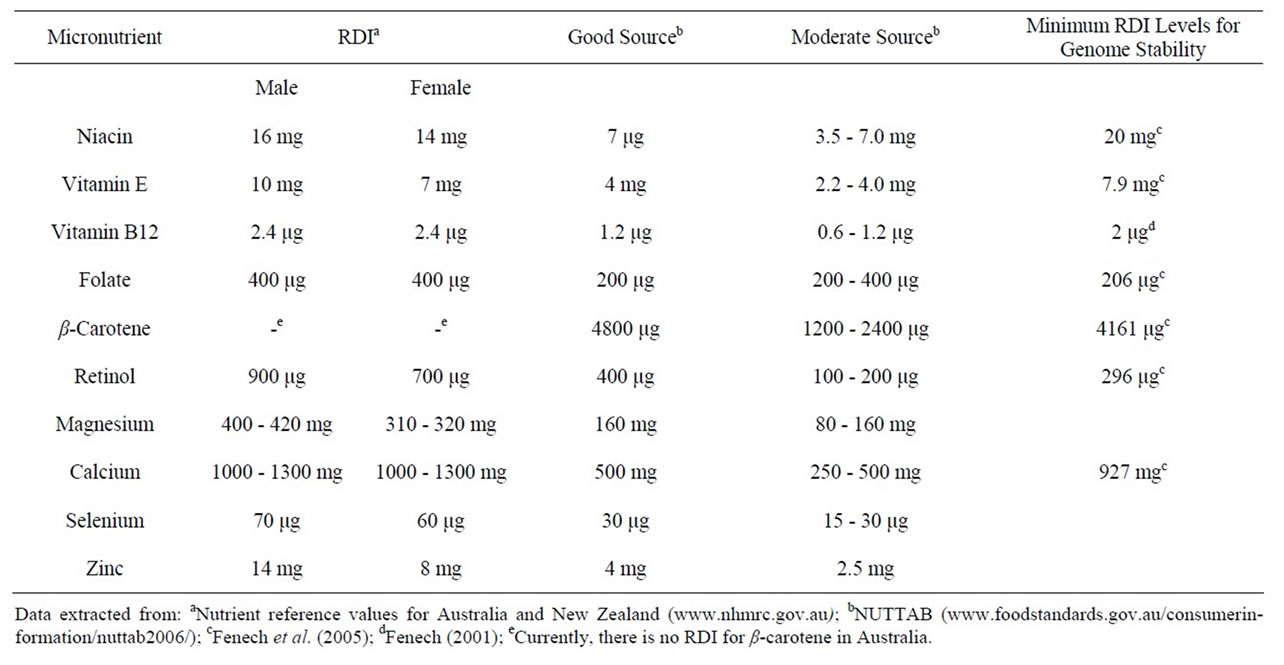
Table 2. Recommended dietary intake (RDI) levels (daily) of micronutrients and the daily intake levels required for genome stability.
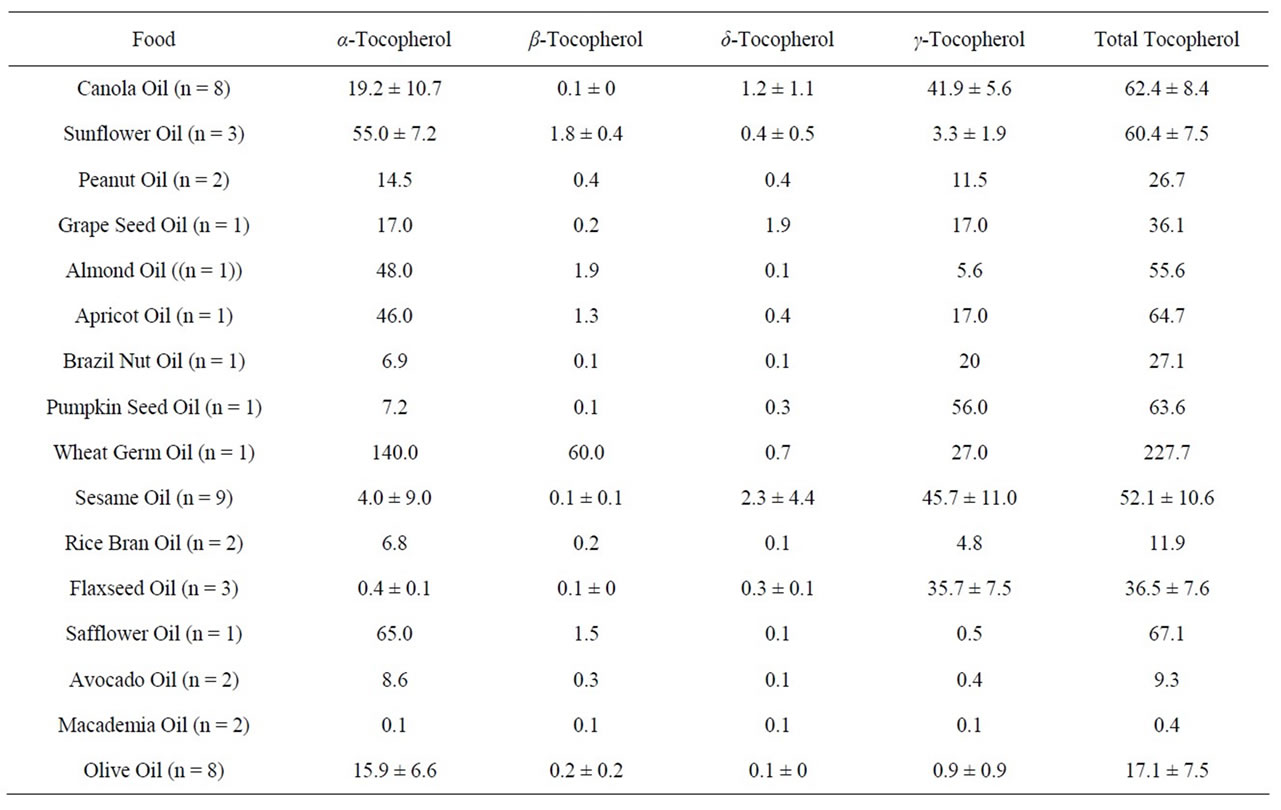
Table 3. Content (mg/100g) of individual and total tocopherols in vegetable oils expressed as mean ± standard deviation. The number of samples (n) is shown after the sample name.
The highest level of γ-tocopherol was found in pumpkin seed oil (56 mg/100g) followed by sesame (46 mg/ 100g), canola (42 mg/100g), and flaxseed (36 mg/100g) oils. With the exception of wheat germ oil where β-tocopherol occurs in unusually high levels, both β-to-copherol and δ-tocopherol are relatively minor constituents of the tocopherol group. Next to wheat germ oil, the highest levels of total tocopherol were found in safflower (67 mg/100g), apricot kernel (65 mg/100g), pumpkin seed (64 mg/100g), canola (62 mg/100g), and sunflower (60 mg/100g) occurring approximately at the same concentration. It is noteworthy that the oils of macadamia, avocado, and rice bran contained relatively low levels of both vitamin E and total tocopherol.
Vitamin B12 is the largest and most complex vitamin currently known. It can only be manufactured by microorganisms (bacteria, yeast, algae) and is found predominantly in animal products. Oyster (64 μg/100g), followed by mussels (41 μg/100g), and chicken liver (34 μg/100g), respectively, were found to be excellent sources of vitamin B12 (Table 4). Although the order of abundance in different foods was similar, generally higher amounts than reported in NUTTAB data were found in the present study. Clams are also considered be one of the best sources of this vitamin, but were not included in this study. It should be pointed out that most red meats (beef, lamb, mutton) are also good (>1.2 μg/100g) sources of this vitamin.
Rice bran (47 mg/100g) was the most abundant source of niacin followed by wheat bran (28 mg/100g) (Table 4). Interestingly, chicken breast (10 mg/100g) contained twice as much niacin as that occurring in chicken thigh (4.6 mg/100g). The content of niacin in chicken thigh was similar to the content of niacin in beef topside (4.4 mg/100g) and lamb mid loin chops (4.6 mg/100g).
In Australia, it is now mandatory to fortify wheat flour produced for bread-making purposes with folic acid [19] and for this reason we omitted wheat flour products and other folic acid fortified products from these analyses. Out of the samples tested in this study, chicken liver was the best source of folate (Table 4) while lamb liver (436 μg/100g), soybean (347 μg/100g), and Chinese flowering cabbage were also good sources (141 μg/100g). Beef liver (16,000 μg/100g) was the best source retinol (Table 4) while lamb liver (8000 μg/100g) and chicken liver (7425 μg/100g) were also good sources. Golden sweet potato (9017 μg/100g), carrot (mature, 5963 μg/100g and baby, 3550 μg/100g), parsley (2833 μg/100g), and spinach (1911 μg/100g) were the most abundant sources of β-carotene (Table 3). Pumpkins were not tested. It is noteworthy that the contents of β-carotene in purple sweet potato and white sweet potato were very low.
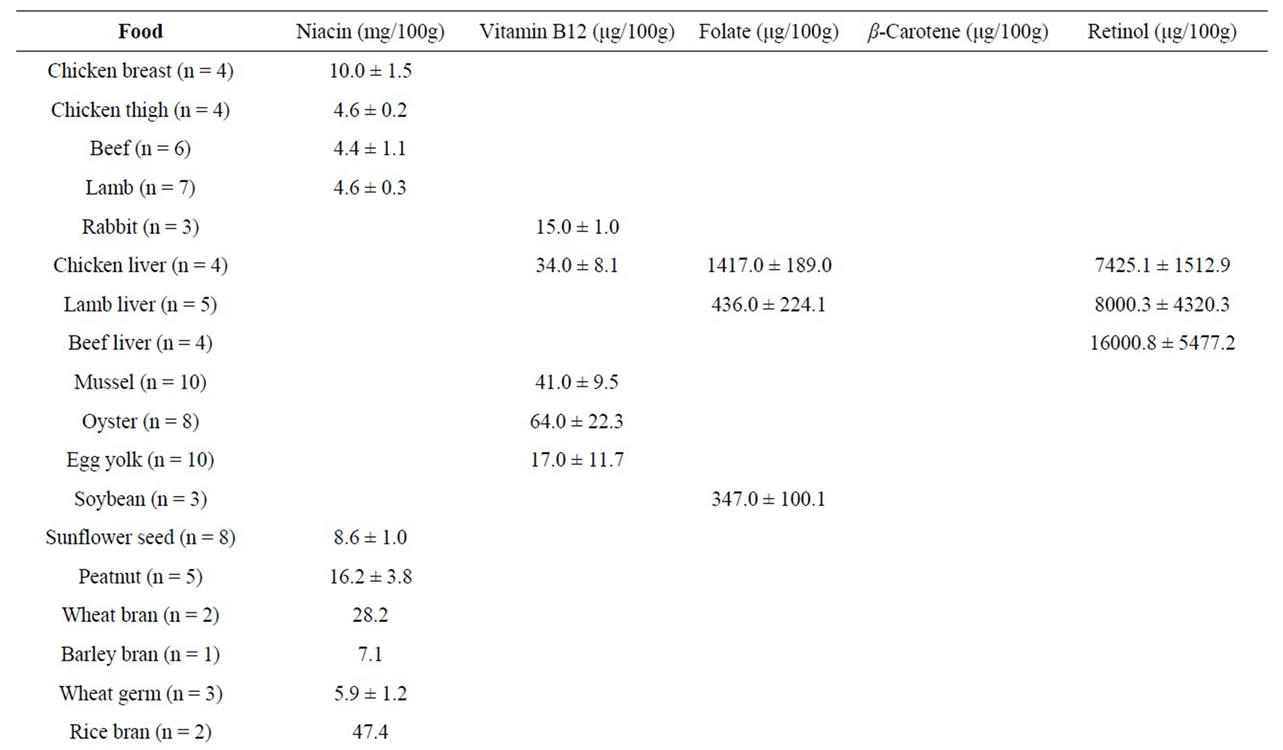
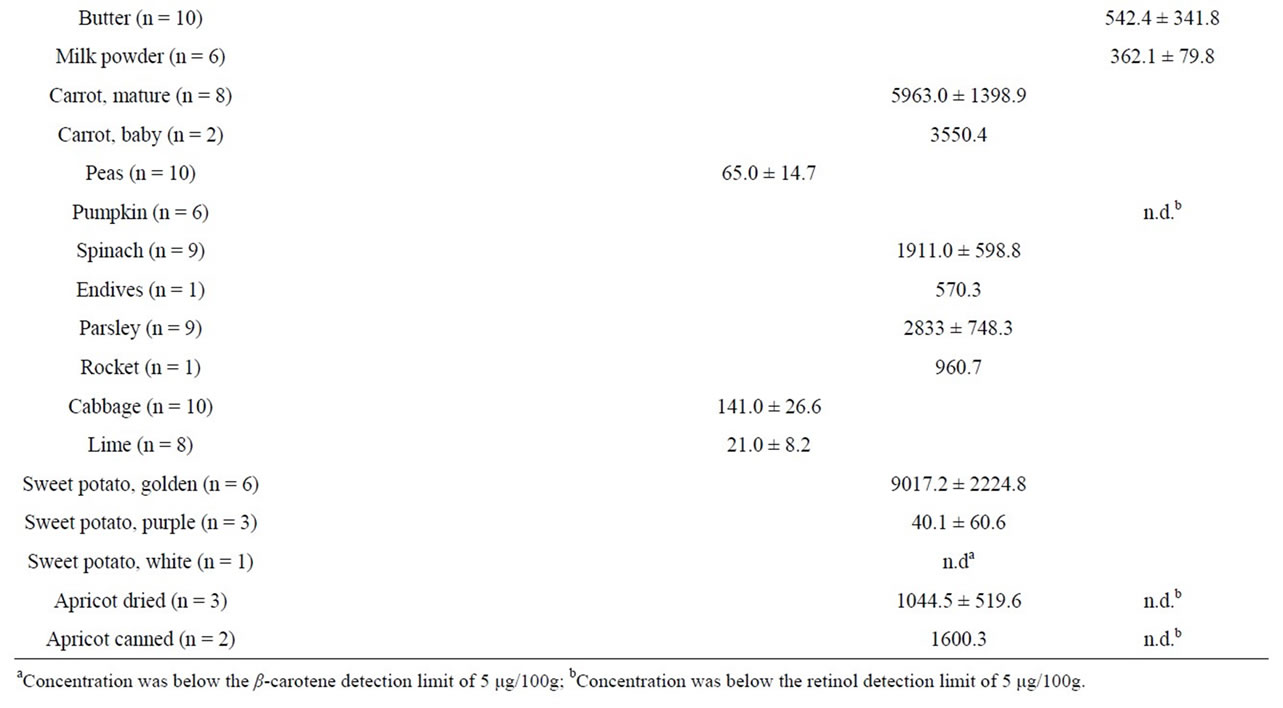
Table 4. Content of niacin, vitamin B12, folate, β-carotene, and retinol in various fresh and processed foods expressed as mean ± standard deviation. The number of samples (n) is shown after the sample name.
Considering trace metals, the best source of selenium was Brazil nuts (280 μg/100g) (Table 5) while lamb kidney (94 μg/100g), chicken liver (62 μg/100g), prawn (81 μg/100g), oyster (73 μg/100g), and egg yolk (53 μg/100g) were also relatively rich in selenium. Fish (average 48 μg/100g) was also a good source, and tuna steaks contained the highest amount (89 μg/100g) within the fish samples tested in this study. The best vegetarian sources of selenium, apart from Brazil nuts, were sesame seeds (85 μg/100g) and lentils (63 μg/100g). Oyster (7.6 mg/100g)
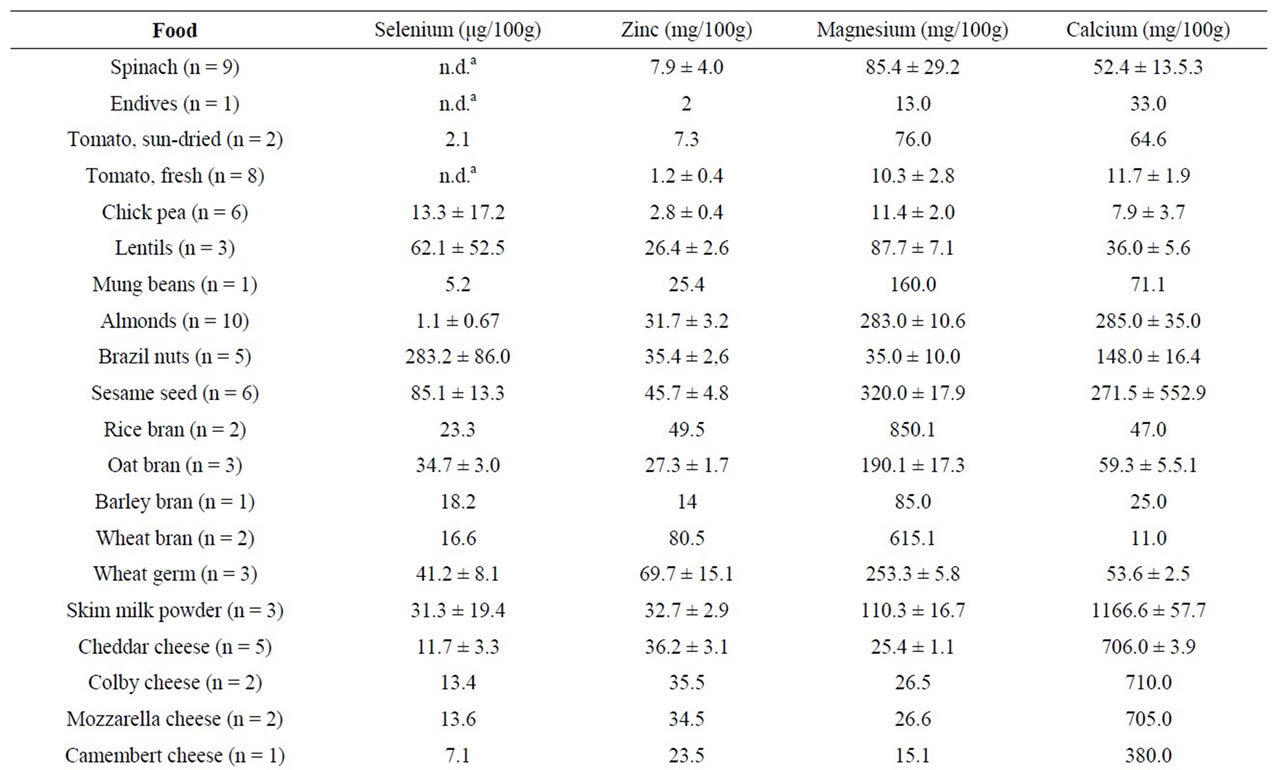
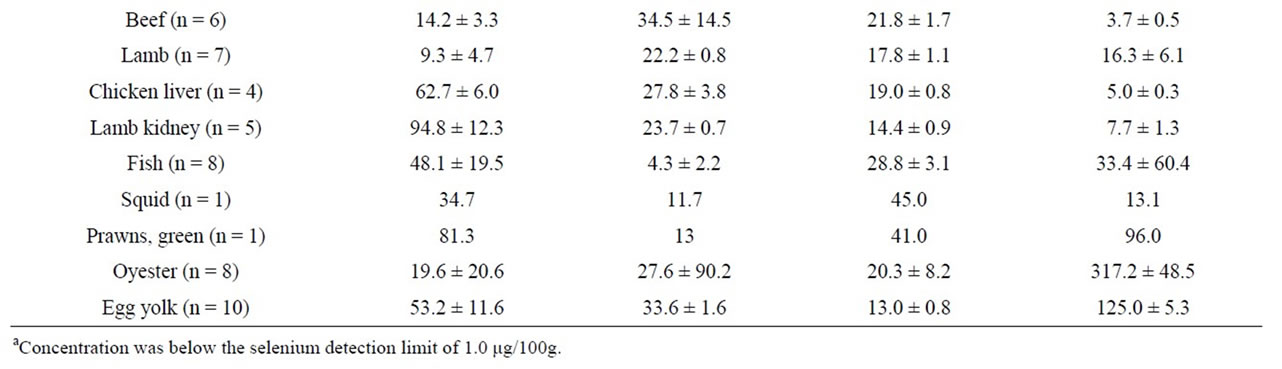
Table 5. Content of selenium, zinc, magnesium, and calcium in various fresh and processed foods expressed as mean ± standard deviation. The number of samples (n) is shown after the sample name.
was a good source of selenium while wheat bran (8.1 mg/100g), wheat germ (5.5 mg/100g), rice bran (5.0 mg/100g) and sesame seed (4.6 mg/100g) were good vegetarian sources. The richest sources of magnesium were rice bran (850 mg/100g) and wheat bran (615 mg/ 100g), followed by Brazil nuts (350 mg/100g), sesame seeds (320 mg/100g), and wheat germ (253 mg/100g). Skim milk powder was the richest source (1167 mg/100g) of calcium, followed by Cheddar, Colby, and Mozzarella cheese (approximately 700 mg/100g each). Almonds (285 mg/100g) and sesame seed (271 mg/100g) were good vegetarian sources of calcium.
The present study has identified good dietary sources of genome-protecting micronutrients. Among the products we tested, rice bran had the highest content of niacin. Although rice bran is not popularly consumed as a separate product, the bran component is retained in unpolished (brown) rice, which can thus be considered a good dietary source of niacin. Wheat bran oil was an exceptionally rich source of vitamin E, and sunflower oil was a good source of the same vitamin among more commonly used cooking oils. Oysters and mussels were particularly good sources of vitamin B12, a 100 g serving of either providing far in excess of the RDI. Whilst soybean afforded the best vegetarian source of folate, chicken liver and lamb liver provided higher amounts with 100 g portions being sufficient to provide the RDI requirements for folate. Animal liver (beef, lamb, and chicken) were also the best dietary sources of retinol, with 100 g portions providing retinol at well above the RDI.
In regard to minerals, skim milk powder, followed by cheddar cheese, were the richest sources of calcium. Good vegetarian sources of calcium included almonds and sesame seeds. Rice bran, Brazil nuts, sesame seed, and almonds were excellent sources of magnesium. Selenium was most abundant in Brazil nuts. The highest amounts of zinc were found in wheat bran and wheat germ. Sesame seed was also a reasonable dietary source of zinc, exemplifying its values as a good all round source of key minerals.
This study provides a snapshot of the levels of 10 key micronutrients required for DNA damage prevention and genome stability in a range of fresh and processed foods available to consumers in Melbourne and the State of Victoria, Australia. In particular, it provides information on some of the richest sources of these particular micronutrients among commonly consumed foods as well as specialty products. We can expect the actual levels to vary depending on factors such as the origin and season. Nevertheless, the data can be used as a guide when designing dietary patterns or formulating functional foods enriched in particular micronutrients; e.g. wheat germ oil for vitamin E; rice bran for niacin; and Brazil nuts for selenium etc.
Dietary patterns that are rich in micronutrients required for genome maintenance are likely to play an increasingly important role in optimal health strategies for disease prevention because the evidence that DNA damage at the gene sequence, epigenome and chromosome level is the fundamental cause of both developmental and degenerative diseases is becoming evermore compelling. The strengthening evidence base for this paradigm is leading to the recognition that dietary reference values need to be designed on the basis of DNA damage prevention and that nutrient-dense foods that together deliver the required genome-protective micronutrient combinations in diverse genetic backgrounds will play an increasingly important role in public health strategies aimed at preventing those diseases caused by excessive insults to DNA due to malnutrition [8].
4. Acknowledgements
We are grateful to the Department of Primary Industries, Victoria, Australia for financial assistance, Claudio Ceccato and Peter Fagan (CSIRO Food and Nutritional Sciences) for sample collection, and Paul Adorno (National Measurement Institute, Melbourne, Australia) for assistance with chemical analyses.
REFERENCES
- M. Fenech, “Chromosomal Biomarkers of Genomic Instability Relevant to Cancer,” Drug Discovery Today, Vol. 7, No. 2, 2002, pp. 128-1137. doi:10.1016/S1359-6446(02)02502-3
- S. A. Martin, M. Hewish, C. J. Lord and A. Ashworth, “Genomic Instability and the Selection of Treatments for Cancer,” Journal of Pathology, Vol. 220, No. 2, 2010, pp. 281-289.
- S. Negrini, V. G. Gorgoulis and T. D. Halazonetis, “Genomic Instability—An Evolving Hallmark of Cancer,” Nature Reviews Molecular Cell Biology, Vol. 11, No. 3, 2010, pp. 220-228. doi:10.1038/nrm2858
- J. H. J. Hoeijmakers, “Molecular Origins of Cancer DNA Damage, Aging, and Cancer,” New England Journal of Medicine, Vol. 361, No. 15, 2009, pp. 1475-1485. doi:10.1056/NEJMra0804615
- A. Y. Maslov and J. Vijg, “Genome Instability, Cancer and Aging,” Biochimica et Biophysica Acta-General Subjects, Vol. 1790, No. 10, 2009, pp. 963-969. doi:10.1016/j.bbagen.2009.03.020
- J. M. Sedivy, G. Banumathy and P. D. Adams, “Aging by Epigenetics—A Consequence of Chromatin Damage?” Experimental Cell Research, Vol. 314, No. 9, 2008, pp. 1909-1917. doi:10.1016/j.yexcr.2008.02.023
- B. N. Ames and P. Wakimoto, “Are Vitamin and Mineral Deficiencies a Major Cancer Risk?” Nature Reviews Cancer, Vol. 2, No. 9, 2002, pp. 694-704. doi:10.1038/nrc886
- M. Fenech, “Dietary Reference Values of Individual Micronutrients and Nutriomes for Genome Damage Prevention: Current Status and Road Map for the Future,” American Journal of Clinical Nutrition, Vol. 91, No. 5, 2010, pp. 1438S-1454S. doi:10.3945/ajcn.2010.28674D
- B. N. Ames, “Low Micronutrient Intake May Accelerate the Degenerative Diseases of Aging through Allocation of Scarce Micronutrients by Triage,” Proceedings of the National Academy of Sciences of the United States of America, Vol. 103, No. 47, 2006, pp. 17589-17594. doi:10.1073/pnas.0608757103
- W. H. Cheng, “Impact of Inorganic Nutrients on Maintenance of Genomic Stability,” Environmental and Molecular Mutagenesis, Vol. 50, No. 5, 2009, pp. 349-360. doi:10.1002/em.20489
- L. R. Ferguson and M. Philpott, “Nutrition and Mutagenesis,” Annual Review of Nutrition, Vol. 28, No. 1, 2008, pp. 313-329. doi:10.1146/annurev.nutr.28.061807.155449
- M. Fenech, “Genome Health Nutrigenomies and Nutrigenetics—Diagnosis and Nutritional Treatment of Genome Damage on an Individual Basis,” Food and Chemical Toxicology, Vol. 46, No. 4, 2008, pp. 1365-1370. doi:10.1016/j.fct.2007.06.035
- J. B. Kirkland, “Niacin Status Impacts Chromatin Structure,” Journal of Nutrition, Vol. 139, No. 12, 2009, pp. 2397-2401. doi:10.3945/jn.109.111757
- G. Scalabrino, “Vitamin-Regulated Cytokines and Growth Factors in the CNS and Elsewhere,” Journal of Neurochemistry, Vol. 111, No. 6, 2009, pp. 1309-1326. doi:10.1111/j.1471-4159.2009.06417.x
- J. A. MaKay, “Diet Induced Epigenetic Changes and Their Implications for Health,” Acta Physiologica, Vol. 202, No. 2, 2011, pp. 103-118. doi:10.1111/j.1748-1716.2011.02278.x
- C. Bull and M. Fenech, “Genome-Health Nutrigenomics and Nutrigenetics: Nutritional Requirements or ‘Nutriomes’ for Chromosomal Stability and Telomere Maintenance at the Individual Level,” Proceedings of the Nutrition Society, Vol. 67, No. 2, 2008, pp. 146-156. doi:10.1017/S0029665108006988
- M. Fenech, “Micronutrients and Genomic Stability: A New Paradigm for Recommended Dietary Allowances (RDAs),” Food and Chemical Toxicology, Vol. 40, No. 8, 2002, pp. 1113-1117. doi:10.1016/S0278-6915(02)00028-5
- M. Fenech, et al., “Low Intake Of Calcium, Folate, Nicotinic Acid, Vitamin E, Retinol, Beta-Carotene and High Intake of Pantothenic Acid, Biotin and Riboflavin Are Significantly Associated with Increased Genome Instability—Results from a Dietary Intake and Micronucleus Index Survey in South Australia,” Carcinogenesis, 2005, Vol. 26, No. 5, pp. 991-999. doi:10.1093/carcin/bgi042
- NUTTAB Food Composition Data Tables, 2009. http://www.foodstandards.gov.au/consumerinformation/nuttab2006/
- Food Standards Australia and New Zealand, Mandatory Folic Acid Fortification in Australia, 2010. http://www.foodstandards.gov.au/scienceandeducation/factsheets/factsheets2009/mandatoryfolicacidfo4389.cfm
- C. M. Ward and V. C. Trenerry, “The Determination of Niacin in Cereals, Meat and Selected Foods by Capillary Electrophoresis and High Performance Liquid Chromatography,” Food Chemistry, Vol. 60, No. 4, 1997, pp. 667- 674. doi:10.1016/S0308-8146(97)00022-8
- Analytical Methods Committee, “Determination of Vitamin A in Animal Feeding Stuffs by High-performance Liquid Chromatography,” Analyst, Vol. 110, 1985, pp. 1019- 1026. doi:10.1039/an9851001019
- AOAC, Method for the Microbiological Analysis of Selected Nutrients, Association of Official Analytical Chemists, Provo, 1996.
- A. I. O. Barba, M. C. Hurtado, M. C. S. Mata, V. F. Ruiz and M. L. S. De Tejada, “Application of a UV-VIS Detection-HPLC Method for a Rapid Determination of Lycopene and Beta-Carotene in Vegetables,” Food Chemistry, Vol. 95, No. 2, 2006, pp. 328-336. doi:10.1016/j.foodchem.2005.02.028
- Nutrient Reference Values for Australia and New Zealand, 2009. http://www.nhmrc.gov.au/_files_nhmrc/file/publications/synopses/n35.pdf
NOTES
*Corresponding author.