International Journal of Medical Physics, Clinical Engineering and Radiation Oncology
Vol. 1 No. 2 (2012) , Article ID: 21922 , 6 pages DOI:10.4236/ijmpcero.2012.12008
Energy Dependence of the New Gafchromic EBT3 Film: Dose Response Curves for 50 kV, 6 and 15 MV X-Ray Beams*
1Instituto de Física, Universidad Nacional Autónoma de México, Mexico City, México
2Quality MediPhys LLC, Denville, USA
3Department of Radiation Oncology, Memorial Sloan-Kettering Cancer Center, Basking Ridge, USA
Email: massillon@fisica.unam.mx, soutung@optonline.net, ivdomumo@fisica.unam.mx, chanm@mskcc.org
Received June 13, 2012; revised July 22, 2012; accepted August 16, 2012
Keywords: Radiochromic Film; EBT3 Film; Dose Response Curve; Quality Assurance; Low-Energy Photons
ABSTRACT
Purpose: To study and compare the dose response curves of the new GafChromic EBT3 film for megavoltage and kilovoltage x-ray beams, with different spatial resolutions. Methods: EBT3 films (lot#A101711-02) were exposed to each x-ray beam (6 MV, 15 MV, and 50 kV) at 7 dose values (50 - 3200 cGy). Each film piece was scanned three consecutive times in the center of Epson 10000XL flatbed scanner in 48-bit color at two separate spatial resolutions of 75 and 300 dpi. The data were analyzed using ImageJ and, for each scanned image, a region of interest (ROI) of 2 × 2 cm2 at the field center was selected to obtain the mean pixel value with its standard deviation in the ROI. For each energy, dose value and spatial resolution, the average net optical density (netOD) and its associated uncertainty were determined. The Student’s t-test was performed to evaluate the statistical differences between the net OD/dose values of the three energy modalities, with different color channels and spatial resolutions. Results and Discussion: The dose response curves for the three energy modalities were compared in three color channels. Weak energy dependence was found. For doses above 100 cGy, no statistical differences were observed between 6 and 15 MV beams, regardless of spatial resolution and color channel. However, statistical differences were observed between 50 kV and the megavoltage beams. The degree of energy dependence (from MV to 50 kV) was found to be a function of color channel, dose level, and spatial resolution. Conclusions: The dose response curves for GafChromic EBT3 films were found to be weakly dependent on the energy of the photon beams from 6 MV to 15 MV. For very low energy photon (e.g. 50 kV), variation of more than 11% due to the energy-dependence is observed, depending on the absorbed dose, spatial resolution and color channel used.
1. Introduction
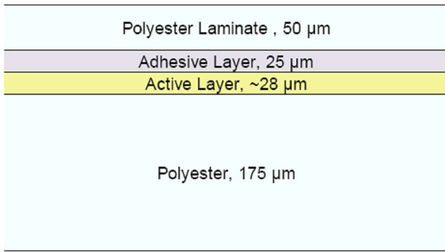
Radiotherapy Nowadays, radiochromic film is popular in medical applications to provide treatment dose verification and measure complicated 2D dose maps in external beam radiotherapy [1-3]. The first generation GafChromic EBT film whose dosimetric properties were extensively studied [4-9], was considered to be suitable for use at the absorbed dose level for radiation therapy quality assurance. In early 2009, the EBT film was replaced by EBT2 film by arguing that this version would enhance the absorbed dose accuracy [10]. However, it has been reported that EBT2 film shows inhomogeneities in its response, which lead to larger uncertainties in dose determination if using single-channel radiochromic film dosimetry [10,11]. In addition, a multichannel method that allows for the separation and removal of the nondose-dependent portions of a film image was proposed [11]. Besides that, a new EBT3 film was released in late 2011 with the same chemical composition of the active layer as in EBT2 model (see Figure 1), but featuring symmetrical construction and anti-Newton ring coatings for enhanced ease-of-use and accuracy [12].
The energy dependence of the EBT2 film response induced by different radiation beam qualities has been investigated by various research groups. The EBT2 film response to nine energy x-ray beams between 50 kV and 10 MV has been investigated and an energy dependence of about 6.5% in the optical density per unit dose measured in the entire energy range by analyzing the red component was reported [13]. Such a result was supported by independent research [14] study comprising kilovoltage x-rays (75, 125, and 250 kV), 137Cs and 60Co
 (a)
(a) (b)
(b)
Figure 1. Configurations of GafChromic EBT2 film (a) and EBT3 (b).
gamma, megavoltage x-rays (6 and 18 MV), electron beams (6 and 20 MeV) and proton beams (100 and 250 MeV), where the energy dependence of EBT2 was found to be relatively small within measurement uncertainties (1s = 4.5%) for all energies and modalities [14]. In contrast, other study reported variation up to 20% on the energy dependence of EBT2 film [15] for photon energy between 105 kV and 6 MV, depending on the batch number, which was interpreted as a consequence of variation in the concentrations of bromine, chlorine, and potassium among batches [15]. This result is in agreement with Monte Carlo simulation where the EBT2 film’s response to energy photon below 100 keV was found to be energy dependent of about 10% and 50%, depending on the manufacturing lot, due to changes in the ratio of mass energy absorption coefficients of the active emulsion layers to water [16]. Thus, given the non-universality on the energy dependence of the EBT2 film response to energy photons; it is important to evaluate the energy dependence of the new EBT3 film, in spite of its similarity with the EBT2.
In this work, a statistical evaluation of the energy dependence on the new EBT3 film dose response curve induced by 50 kV, 6 MV and 15 MV at absorbed dose values between 50 and 3200 cGy was performed through the Student’s t-test. In particular, the influence of the spatial resolution on the degree of energy dependence of the film response was also investigated, since the uncertainty in the absorbed dose measurement with GafChromic film strongly depends on the spatial resolution used during the scanning process [3].
2. Materials and Methods
2.1. Irradiation Process
The experiments were carried out using a Varian Trilogy Linac with 6 MV and 15 MV x-ray beams at the Memorial Sloan-Kettering Cancer Center, USA and an Oxford Instruments UltraBright X-ray tube with tungsten target at 50 kV x-ray and 1.4 mA beam current at the Instituto de Física Medical Physics Laboratory UNAM, México. EBT3 films from lot#A101711-02 (Ashland Inc., Wayne, NJ, USA) were irradiated with 6 MV and 15 MV photons using a polystyrene phantom (25 × 25 × 15 cm3). The film exposures were performed using an open 10 × 10 cm2 field size at the depth of 5 cm. For each radiation beam, two EBT3 film sheets were used and each sheet was cut into nine pieces of 6.8 × 8.5 cm2. Thus, two film pieces (one at a time) per absorbed dose were irradiated to each x-ray beam at seven dose values ranged from 50 cGy to 3200 cGy and the others 4 pieces were considered for zero dose exposure. The film doses were calibrated against the ion chamber (Standard Imaging Exradin A-12 0.65cc thimble chamber with ADCL calibration) measurement at the same location and depth. The output of the Trilogy Linac was calibrated per AAPM TG-51 protocol [17] with 2% uncertainty.
The 50 kV x-ray beam was filtrated with 1.05 mmAl additional. The half value layer of the beam was measured using high purity aluminum foil, finding a value of 0.765 mmAl, which corresponds to an effective energy of 20.25 keV, according to the mass attenuation coefficient tables published in the National Institute of Standard and Technology (NIST) web page [18]. The air kerma rate was measured at 18.2 cm from the focal spot for a radiation field of 6 cm diameter with 99.5% uniformity. In this case, a soft x-ray PTW ionization chamber type 23342 of 0.02 cm3 vented sensitive volume that was previously calibrated in terms of air-kerma at NIST was used. The uncertainty in the measured air kerma rate was 0.42% (coverage factor k = 1). The films were exposed completely in air and a value of (men/r)water,air = 1.01511 was used to convert the air kerma into absorbed dose to water by assuming charged particle equilibrium at the measurement distance. Seven absorbed dose values ranging from 50 to 2400 cGy were delivered to the films with two films per dose level. Film pieces with zero dose were kept in the same package sent to Mexico and back to USA in order to quantify any possible environmental factors during the shipping and storage. By subtracting this zero dose contribution from the known radiation beam using Equation (1) described below, the effect of the shipping on the final result can be considered negligible.
2.2. Preparation, Readout and Analysis of the Film Response
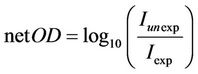
At least one day after irradiation, each film piece was scanned three consecutive times at the same position in the center of an Epson 10000 XL flatbed scanner in transmission mode, landscape orientation, 48-bit color with two separate spatial resolutions of 75 and 300 dpi. The color correction feature was disabled. All the films in this study were scanned using the same scanner (at MSKCC) with the same setting and under the same condition of temperature and humidity on the same day to minimize the scanner variability. The data were analyzed using ImageJ v1.45s. (National Institute of Health, Bethesda, MD, http://rsb.info.nih.gov/ij/) by splitting the film image data into red, green, and blue color channels. For each scanned image and color channel, a region of interest (ROI) of 2 × 2 cm2 at the field center was selected to obtain the mean pixel value with its standard deviation in the ROI. The data of the mean pixel values in each color channel from all the scans of all films receiving the same dose (of the same energy modality) were compared and the standard deviation within 0.9% was found. With the reproducibility of the mean pixel values in the ROI established, the average value for all scans and all films was taken for each dose value, energy modality, color channel, and spatial resolution. Thereafter, for each energy beam, dose value and spatial resolution, the average net optical density (netOD) and its associated uncertainty were determined according to the following relation [3,19]:
 (1)
(1)
 (2)
(2)
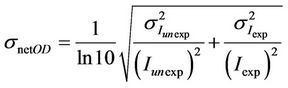
where Iunexp and Iexp are the average pixel values of an unexposed (zero dose value) and exposed film, respectively, and si are the corresponding standard deviations of the pixel values. The Student’s t-test [20-22] was performed to evaluate the statistical differences between the netOD/dose values of the three energy modalities, with different color channels and spatial resolutions.
3. Results and Discussions
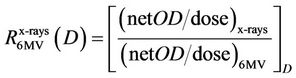
Figure 2 depicts the measured netOD for the EBT3 film as a function of the absorbed dose in water for the three color channels and energy beams for the spatial resolution of 75 dpi. The points represent the experimental data. As it can be noted, a small difference is apparently observed between the three energy beams, for all three color channels. In order to quantify this difference and perform a statistical evaluation of the obtained data, the netOD/dose value as a function of the absorbed dose was evaluated. This result is shown in Figure 3 for the 75 dpi resolution. For a given spatial resolution, a significant difference between the energy beams can be seen. This difference decreases as the absorbed dose increases. To compute this variation for a given absorbed dose value, D, the relative response, R, is defined as the netOD/dose obtained at any energy beam divided by that measured for the 6 MV x-rays:
 (3)
(3)
The choice of 6 MV x-rays as a reference is based on the fact that at these energies, the Compton interaction is dominant and consequently the ratio of the mass energy absorption coefficient between the film and water would be constant. While for the 50 kV where photoelectric is the main interaction process and 15 MV with a significant
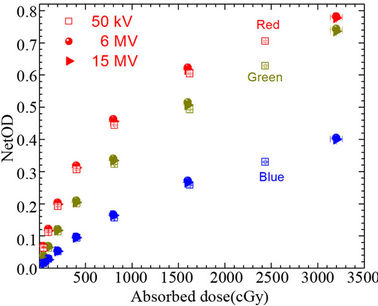
Figure 2. Dose response curves for 3 different photon energies in red, green, blue color channels (vertical axis—net optical density; horizontal axis—dose in cGy).
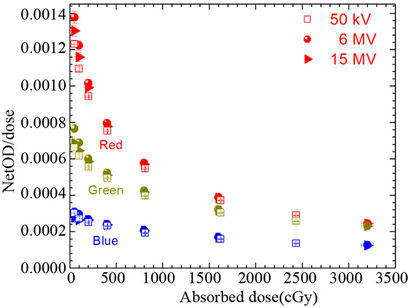
Figure 3. Values of netOD/dose plotted against doses (cGy) for 3 different photon energies in red, green, blue color channels (vertical axis—net optical density per unit dose; horizontal axis—dose in cGy).
contribution of pair production (about 13% - 17% and 8% - 11% in silica and polyester, respectively for average energy between 5 MeV and 6 MeV), the absorbed dose evaluation is more complicated. Figure 4 presents R for 50 kV and 15 MV as a function of the absorbed dose for the two spatial resolutions (300 and 75 dpi) and the three color channels. As it can be observed, for both energy beams, the R value increases as the absorbed dose increases, regardless of the spatial resolution and the color channel. This implies that the EBT3 film response is less energy-dependent at high absorbed dose value. Such a behavior on the relative response as a function of the absorbed dose is similar to that reported before for the EBT film, which was symmetric in layer configuration [15]. However, upon comparison with EBT film, the EBT3 is less energy dependent. It can be also noted that for a given absorbed dose value, the degree of the energy dependence on the film response is lower when the spatial resolution increases and is a function of the color channel used. For example, at 100 cGy of 50 kV x-ray beam, within measurement uncertainties, variation (difference between the dose response to the actual photon beam and 6 MV x-rays) of 10%, 9.5% and 3.9% are obtained in the energy response at 300 dpi for the red, green and blue channel, respectively while at 75 dpi variation of 11.4%, 11% and 7.1% were found for the red, green and blue channel, respectively. At the same dose value of 15 MV, the variations are 4.52%, 5.31% and 11.21% for 300 dpi while for 75 dpi, 5.1%, 6.33% and 11% are observed for red, green and blue channel, respectively. This difference in the energy dependence with spatial resolution can be attributed to the strong dependence of the relative uncertainty on the spatial resolution [3].
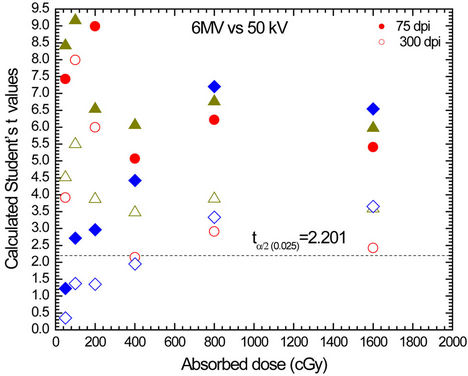
To evaluate the statistical significance of the difference on the film’s responses induced by each energy beam, a two-sided Student’s t test was performed [21]. According to this test model, if the absolute value of the test statistic is greater than the value of ta/2 in the t table, the null hypothesis has to be rejected [22]. This implies we can assume that there exists a detectable difference between the two means. As shown in Figures 5(a)-(b), for a significance level a = 0.05 (t0.025 = 2.201), the results of that analysis indicated that the means in netOD/dose are statistically different for almost all the applied absorbed dose levels, spatial resolution and color channels. Therefore, the response of the EBT3 emulsion to lowand high-energy photons cannot be considered to be the same. Nonetheless, for the data shown in Figure 5(c), no statistical difference is observed for applied absorbed dose larger than 100 cGy, independently of spatial resolution and color channels, which signifies that the response of the EBT3 film is independent of the energy for high-energy photon beams generally used in radiotherapy.
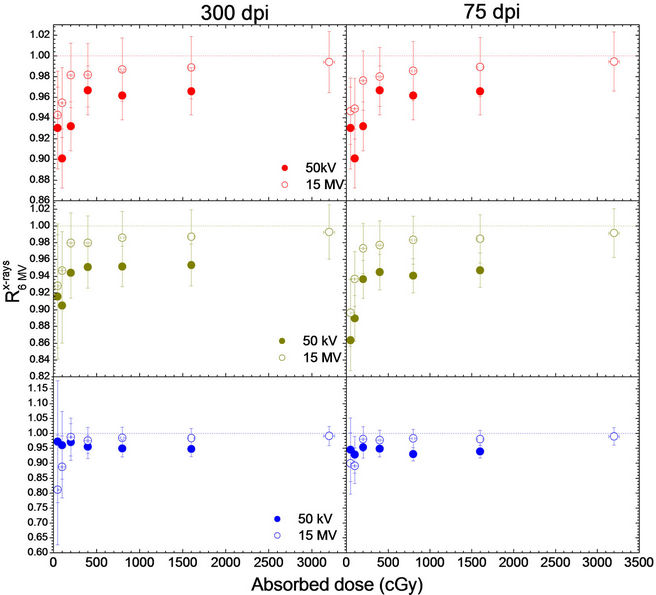
Figure 4. Relative responses R (compared with 6 MV beam, as defined in Equation (3)) plotted against doses for 50 kV and 15 MV beams, with scanning resolutions 300 dpi (left) and 75 dpi (right), in three color channels, red (top), green (center) and blue (bottom).
 (a)
(a)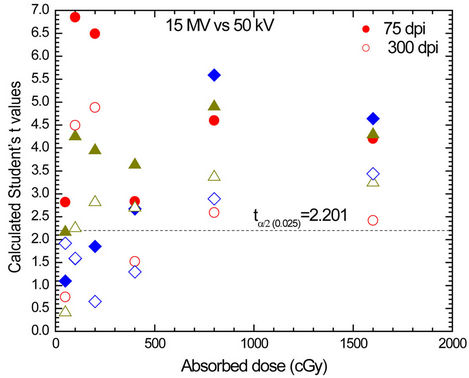 (b)
(b)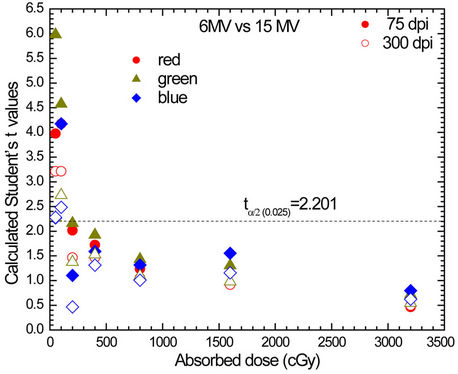 (c)
(c)
Figure 5. Calculated Student’s t values plotted against doses for scanning resolutions 75 dpi (closed symbols) and 300 dpi (open symbols) and for red, green and blue color channels shown by circle, triangle and diamond symbols, respectively. (a) 6 MV vs 50 kV; (b) 15 MV vs 50 kV; (c) 6 MV vs 15 MV.
For most external beam modalities, the spatial resolution of 75 dpi (0.034 cm per pixel) is sufficiently fine in comparison with the grid size of 0.1 cm used in treatment planning calculations. However, for brachytherapy applications and small fields used in stereotactic radiosurgery (SRS) and stereotactic body radiation therapy (SBRT), the finer spatial resolution of 300 dpi (0.0085 cm) would be critical to accurately measure dose distributions with steep dose gradients. This is the motivation of this study to investigate the dose response for 75 and 300 dpi.
In this study, we focused on the characteristics of EBT3 film for photon beams of 50 kV, 6 and 15 MV. The intermediate photon energy (e.g. 120 kV) and megavoltage electron beam can be the topic of a separate study.
4. Conclusions
The energy dependence of the new GafChromic EBT3 film (lot#A101711-02) exposed to 50 kV, 6 and 15 MV x-ray beams has been investigated at two different spatial resolutions and the three color channels. The film’s response is weakly dependent on the energy of high-energy photon beams generally used in radiotherapy, regardless of the spatial resolution and color channel. However, for very lowenergy photon (e.g. 50 kV), variation of more than 11% due to the energy-dependence is observed, depending on the absorbed dose, spatial resolution and color channel used. Thus, for brachytherapy seeds like 125I and 103Pd, special attention is required in calibrating the film response to low energy photons.
Since this study was limited to one lot (#A101711-02) of EBT3 film, the dose response characteristics reported here may or may not be applicable to EBT3 film of different lots. It is advisable to verify the dose response of EBT3 film of individual lots at the energies under investigation.
5. Acknowledgements
This work was partially supported by DGAPA-UNAM grant IN102610 and Conacyt Mexico grant 127409. EBT3 films were supplied by Ashland Inc., Wayne, NJ, USA, the manufacturer of the GafChromic films.
REFERENCES
- M. Fuss, E. Sturtewagen, C. De Wagter and D. Georg, “Dosimetric Characterization of GafChromic EBT Film and Its Implication on Film Dosimetry Quality Assurance,” Physics in Medicine and Biology, Vol. 52, No. 14, 2007, pp. 4211-4225. doi:10.1088/0031-9155/52/14/013
- L. Richley, A. C. John, H. Coomber and S. Fletcher, “Evaluation and Optimization of the New EBT2 Radiochromic Film Dosimetry System for Patient Dose Verification in Radiotherapy,” Physics in Medicine and Biology, Vol. 55, No. 9, 2010, pp. 2601-2617. doi:10.1088/0031-9155/55/9/012
- G. Massillon-JL and L. Zúñiga-Meneses, “The Response of the New MD-V2-55 Radiochromic Film Exposed to 60Co Gamma Rays,” Physics in Medicine and Biology, Vol. 55, No. 18, 2010, pp. 5437-5449. doi:10.1088/0031-9155/55/18/011
- S. Devic, J. Seuntjens, E. Sham, E. B. Podgorsak, C. R. Schmidtlein, A. S. Kilrov and C. G. Soares, “Precise Radiochromic Film Dosimetry Using a Flat-Bed Scanner,” Medical Physics, Vol. 32, No. 7, 2005, pp. 2245-2253. doi:10.1118/1.1929253
- M. J. Butson, T. Cheung and P. K. N. Yu, “Absorption Spectra Variations of EBT Radiochromic Film from Radiation Exposure,” Physics in Medicine and Biology, Vol. 50, No. 13, 2005, pp. N135-N140. doi:10.1088/0031-9155/50/13/N02
- T. Cheung, M. J. Butson and P. K. N. Yu, “Post-Irradiation Colouration of Gafchromic EBT Radiochromic Film,” Physics in Medicine and Biology, Vol. 50, No. 20, 2005, pp. N281-N285. doi:10.1088/0031-9155/50/20/N04
- L. J. van Battum, D. Hoffmans, H. Piersma and S. Heukelom, “Accurate Dosimetry with GafChromic™ EBT Film of a 6 MV Photon Beam in Water: What Level Is Achievable?” Medical Physics, Vol. 35, No. 2, 2008, pp. 704-716. doi:10.1118/1.2828196
- M. Martišíková, B. Ackermann and O. Jäkel, “Analysis of Uncertainties in Gafchromic® EBT Film Dosimetry of Photon Beams,” Physics in Medicine and Biology, Vol. 53, No. 24, 2008, pp. 7013-7027. doi:10.1088/0031-9155/53/24/001
- B. C. Ferreira, M. C. Lopes and M. Capela, “Evaluation of an Epson Flatbed Scanner to Read Gafchromic EBT Films for Radiation Dosimetry,” Physics in Medicine and Biology, Vol. 54, No. 4, 2009, pp. 1073-1085. doi:10.1088/0031-9155/54/4/017
- B. Hartmann, M. Martišíková and O. Jäkel, “Homogeneity of Gafchromic® EBT2 Film,” Medical Physics, Vol. 37, No. 4, 2010, pp. 1753-1756. doi:10.1118/1.3368601
- A. Micke, D. F. Lewis and X. Yu, “Multichannel Film Dosimetry with Nonuniformity Correction,” Medical Physics, Vol. 38, No. 5, 2011, pp. 2523-2534. doi:10.1118/1.3576105
- D. F. Lewis, “Practical Guide to Radiochromic Film EBT2/EBT3,” 2012. http://www.filmqapro.com/Documents/Lewis%20-%20Europe%2011-2011.pdf
- M. J. Butson, P. K. N. Yu, T. Cheung and H. Alnawaf, “Energy Response of the New EBT2 Radiochromic Film to X-Ray Radiation,” Radiation Measurements, Vol. 45, No. 7, 2010, pp. 836-839. doi:10.1016/j.radmeas.2010.02.016
- B. Arjomandy, R. Tailor, A. Anand, N. Sahoo, M. Gillin, K. Prado and M. Vicic, “Energy Dependence and Dose Response of Gafchromic EBT2 Film over a Wide Range of Photon, Electron, and Proton Beam Energies,” Medical Physics, Vol. 37, No. 5, 2010, pp. 1942-1947. doi:10.1118/1.3373523
- P. Lindsay, A. Rink, M. Ruschin and D. Jaffray, “Investigation of Energy Dependence of EBT and EBT-2 Gafchromic Film,” Medical Physics, Vol. 37, No. 2, 2010, pp. 571-576. doi:10.1118/1.3291622
- J. G. H. Sutherland and D. W. O. Rogers, “Monte Carlo Calculated Absorbed-Dose Energy Dependence of EBT and EBT2 Film,” Medical Physics, Vol. 37, No. 3, 2010, pp. 1110-1116. doi:10.1118/1.3301574
- P. R. Almond, P. J. Biggs, B. M. Coursey, W. F. Hanson, M. S. Huq, R. Nath and D. W. O. Rogers, “AAPM’s TG-51 Protocol for Clinical Reference Dosimetry of High-Energy Photon and Electron Beams,” Medical Physics, Vol. 26, No. 9, 1999, pp. 1847-1870. doi:10.1118/1.598691
- J. H. Hubbell and S. M. Seltzer, “Tables of X-Ray Mass Attenuation Coefficients and Mass Energy-Absorption Coefficients from 1 keV to 20 MeV for Elements Z = 1 to 92 and 48 Additional Substances of Dosimetric Interest,” 2012. http://www.nist.gov/pml/data/xraycoef/index.cfm
- H. Alva, H. Mercado-Uribe, M. Rodríguez-Villafuerte and M. E. Brandan, “The Use of a Reflective Scanner to Study Radiochromic Film Response,” Physics in Medicine and Biology, Vol. 47, No. 16, 2002, pp. 2925-2933. doi:10.1088/0031-9155/47/16/308
- Engineering Statistic Handbooks, “Critical Values of the Student’s t Distribution,” 2012. http://itl.nist.gov/div898/handbook/eda/section3/eda3672.htm
- M. G. Natrella, “Experimental Statistics,” NBS Handbook 91, National Bureau Standards, Washington DC, 1963.
- R. F. Mould, “Introductory Medical Statistics,” 3rd Edition, Institute of Physics Publishing: Bristol and Philadelphia, 1998.
NOTES
*Energy dependence of EBT3 film dose response curve.