American Journal of Climate Change
Vol.3 No.1(2014), Article ID:43968,11 pages DOI:10.4236/ajcc.2014.31006
Trend and Periodicity Analysis in Rainfall Pattern of Nira Basin, Central India
Asmita Ramkrishna Murumkar, Dhyan Singh Arya*
Department of Hydrology, Indian Institute of Technology, Roorkee, India
Email: *dsarya@gmail.com
Copyright © 2014 by authors and Scientific Research Publishing Inc.
This work is licensed under the Creative Commons Attribution International License (CC BY).
http://creativecommons.org/licenses/by/4.0/


Received 13 October 2013; revised 15 November 2013; accepted 11 December 2013
ABSTRACT
Seasonal and annual rainfall data of the stations: Akluj, Baramati, Bhor and Malsiras stations located in Nira Basin, Central India, were analyzed for studying trend and periodicity using 104 years’ rainfall data. The analysis was carried out by using Mann-Kendall (MK), Modified MannKendall (MMK) and Theil and Sen’s slope estimator tests describing rising trend at all the stations. However, it is statistically significant at Akluj and Bhor stations at 10% significance level. Bhor station showed the maximum increase in percentage change i.e. 0.28% in annual rainfall. Monsoon and post-monsoon seasonal rainfall shows a rising trend while the summer and winter seasonal rainfall shows a falling trend. Wavelet analysis showed prominent annual rainfall periods ranging from 2 to 8 years at all the stations after 1960s resulting in describing more changes in the rainfall patterns after 1960s.
Keywords:Trend Analysis; MK; MMK; Autocorrelation; Wavelet Analysis; Nira Basin

1. Introduction
Non-stationary characteristics include many different periodic events in the earth science system which occurred in different time scale periods. A change in components, precipitation [1] -[6] , temperature [7] [8] , evaporation [9] [10] , streamflow [11] [12] ) and water quality [13] [14] in climatic and hydrologic time series all over around the world can be indicated through presence of increasing and decreasing trend. Apparently, in relation to changing rainfall pattern, there is no clear increasing or decreasing trend in the average amount of rainfall over India [15] -[17] . Significant trends have been found in monsoon rainfall on a regional scale [18] -[24] .
In climatic and hydrologic time series, one of the most widely used nonparametric methods, i.e. Mann-Kendall [25] [26] , has been used for trend studies [1] [27] -[29] . Autocorrelation in hydrological or climatic records commonly has made a detailed analysis on the effect of autocorrelation on trend and vice versa [30] [31] . Attempts to modify the Mann Kendall test to make it suitable for an analysis of auto-correlated series include the Modified Mann-Kendall (MMK) [32] [33] . The wavelet transform is a strong mathematical tool that provides a time-frequency representation of a signal in the time domain [34] [35] and hence is used for analyzing non-stationary processes such as hydro-meteorological variables [36] . Especially in meteorology and climatology, such analysis seems to be advantageous [37] . Wavelet transformations have been successfully applied to climate characteristics analysis, such as streamflow characterization [38] , relationship between the north Atlantic oscillation and sea level changes [39] , inter-annual temperature events and shifts in the global temperature [40] , inter-decadal and inter-annual variations of annual and extreme precipitations [41] to study El Nino-Southern oscillation [42] .
Climate has large spatial and temporal variations in India due to its vast size and geographical complexity [23] . Rainfall is one of the major indicators in the climate change impact studies which influences water resources system and agriculture sector of the region. Therefore, this study examined the historical variations in seasonal and annual rainfall pattern in the Nira basin of Maharashtra to observed effect of climate change on regional scale through trend and wavelet analysis.
2. Study Area and Data
The Nira catchment is a sub basin of the Bhima watershed located in the state of Maharashtra in India with an area of 6900 km2 (Figure 1) having a total length of river about 180 km. It originates in Sahyadri hills in Bhor Tahsil and flows through Satara, Pune and Solapur districts. Karha is tributary of Nira Basin. The basin lies between 445 m to 1410 m with annual rainfall about 500 mm - 1000 mm. The banks of the Nira River are steep and rocky and its bed is generally gravelly. The agro based (especially sugar, distilleries, dairy, paper etc.); automobile and textile industries are comprised in the basin. Bajara, Wheat, Pulses, Sugar Cane, Maize etc. are
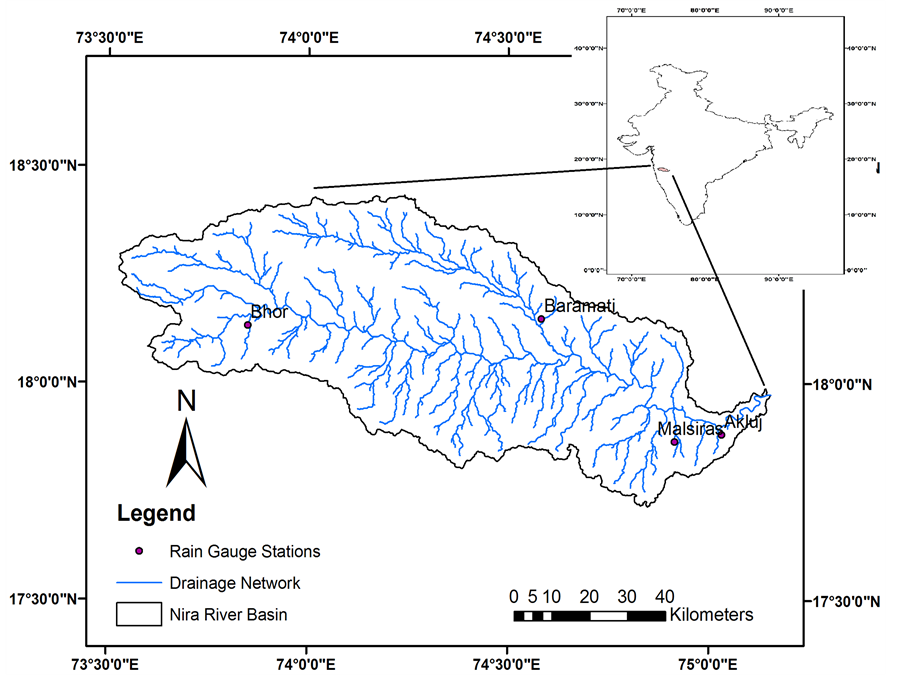
Figure 1. Nira river basin map.
crops being cultivated in the basin. Nowadays, horticultural activities are increasing particularly fruits of orange, sweet limes, grapes, banana etc.
Daily rainfall data from four raingauge stations were obtained from the India Meteorology Department, Pune (Table 1). According to the Indian Meteorological Department, four prominent seasons namely: 1) winter (December to February), 2) summer (March to May), 3) monsoon (June to September) and 4) post-monsoon (October and November) are present in India. For each month and season, the percent rainfall contribution of annual rainfall is shown in Table 2.
3. Methodology
3.1. Trend Analysis
Applying the rules of rainfall for missing data filling methods, all the data gaps were filled up by the normal ratio method for Bhor station and by a correlation coefficient weighted method for the other three stations using data from three nearby stations. The effect of autocorrelation on hydrologic data is one of the major concerns. The autocorrelation coefficient of rainfall series for lag 1 was estimated and its significance was checked by the student’s t-test at 10% significance level. Rainfall trend detection was carried out for seasonal and annual series

Table 1. Rain gauge stations in Nira basin, Maharashtra.
Table 2. Annual percentage contribution of rainfall in each month and season at all stations.
of four rainfall stations. The Mann Kendall (MK) test was used for non-autocorrelated rainfall series while the Modified Mann Kendall (MMK) tests for autocorrelated rainfall series at 10% significance level. Trend line and its significance were also checked using t-test statistics. Magnitude of trend slope was computed by Theil and Sen’s median slope estimator. It is a non-parametric robust estimate indicates an increasing and decreasing tendency by a positive or negative value.
A single global trend over all four stations was obtained by using homogeneity test [13] [43] .
3.2. Wavelet Analysis
Wavelet analysis was performed on the annual rainfall series for visualization of occurrence of events in a broad time scale by using available online tool http://paos.colorado.edu/research/wavelets/. Global wavelet spectrum and Morlet wavelet transform were used for the analysis of rainfall time series in order to clarify time-scale characteristics of measured series [42] . At the border of the wavelet power spectra a zone called the cone of influence, where zero padding has reduced the variance. Since we are dealing with finite-length time series, errors will occur at the beginning and end of the wavelet power spectrum [44] .
The methodology in details with formulae was given in many above citied references, so has not been given in this study.
4. Results and Discussion
4.1. Seasonal and Annual Rainfall Trend
Monsoon and post monsoon seasons show maximum percent contribution of annual rainfall at all stations. More rainfall occurs in the monsoon months (June, July, August and September). The results of the autocorrelation analysis and MK test in case of non-autocorrelated and MMK test for autocorrelated series for trend detection in annual and seasonal series are shown in Table 3. All tests are considered at 10% significance level. Fourteen series are autocorrelated out of 20 series. Statistically significant rising trend are observed in annual rainfall series at Akluj and Bhor stations (Figure 2). Bhor has high variability in annual series than Akluj. There is no significant trend in annual rainfall at Baramati and Bhor stations (Figure 3). The magnitude of trend and percent change are also shown in Table 3. The magnitude of the increasing trends in annual rainfall ranged between 0.61 mm per year (at Malsiras) to 2.76 mm per year (at Bhor station). Bhor station (0.28%) showed the maximum increase in percentage change in annual rainfall over the 104 years period. In case of season, monsoon and post monsoon seasons have rising trend whereas falling trend observed for summer and winter seasons. The magnitude of trend in monsoon rainfall varied between −0.18 mm/year (Akluj) to 2.26 mm/year (Bhor). For summer series, the decrease in magnitude varied from 0.09 mm/year (Bhor) to 1.03 mm/year (Akluj station). The decrease in percentage change varied between 0.22% (Bhor) to 1.31% (Akluj) in summer season.
Changes in seasonal series depending on the time of year are shown in (Figures 4-7). There is an increase in the variability in post-monsoon since 1967 and less variability in summer at Akluj station. Bhor and Malsiras show variability only in monsoon season. The t-test statistics (Table 4) indicated that annual, monsoon, postmonsoon and summer rainfall trends in Nira basin to be significant at 10% levels. Hydrology of the basin and agriculture will influence by variability of post-monsoon as it contributes major share of annual rainfall.
For basin wide global annual and seasonal trend statement was obtained using MK/MMK statistics at 10% significance level (Table 5). From table, the null hypothesis is accepted for annual and seasonal trend as  was less than critical value at 10% significance level. That means the four stations have homogeneous trend over a Nira basin.
In the context of global climate change, basin has variation in the rainfall pattern. Decreasing tendency in the summer monsoon rainfall, increasing trend has been reported in the rainfall during pre-monsoon and post-monsoon months over Indian landmass [23] . The increasing trend was found in the monsoon precipitation along the west coast, north Andhra Pradesh and north-west India and decreasing trend over east Madhya Pradesh and adjoining areas, north-east India and parts of Gujarat and Kerala over 114 (1871-1984) years [45] .
4.2. Application of Wavelet Analysis on Annual Rainfall Series
Wavelet analysis is used to verify the trends in the series. The intensity of energy distribution of different time
Table 3. Results of Autocorrelation and MK/MMK statistics (Z), Theil and Sen’s slope estimator and % change and for annual and seasonal rainfall series.
(Note: Y and N indicate presence of serial independence at lag 1 autocorrelation in rainfall series respectively; upward and downward arrows indicates rising and falling trend; respectively).
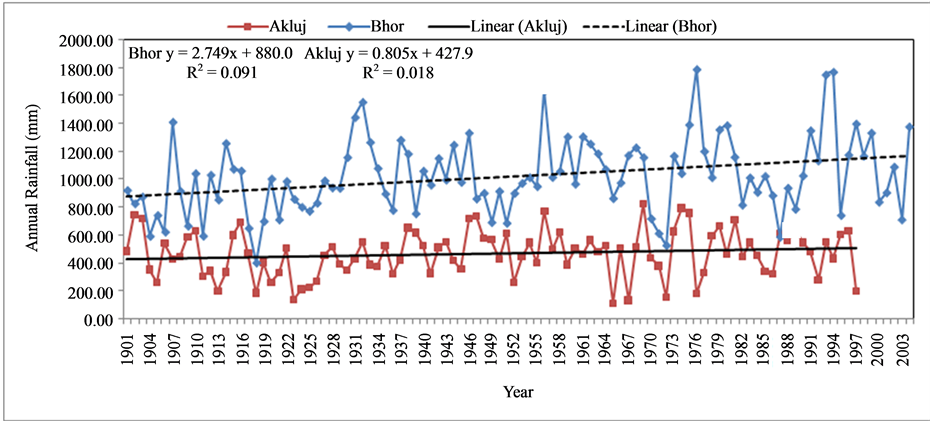
Figure 2. Annual rainfall trend at Akluj and Bhor station.
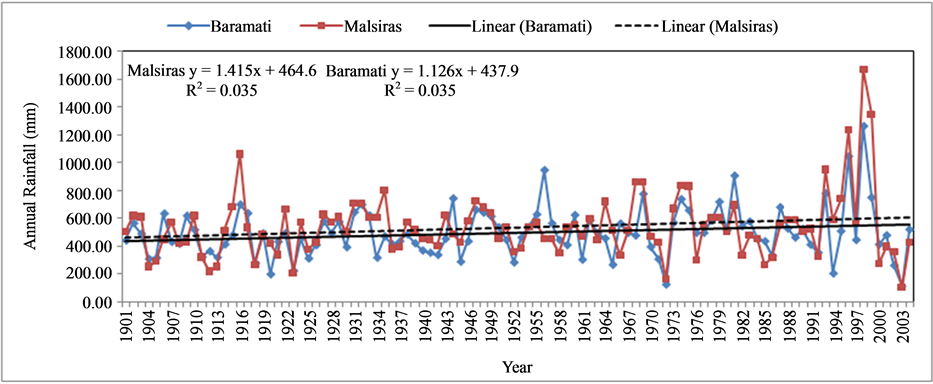
Figure 3. Annual rainfall trend at Baramati and Malsiras station.
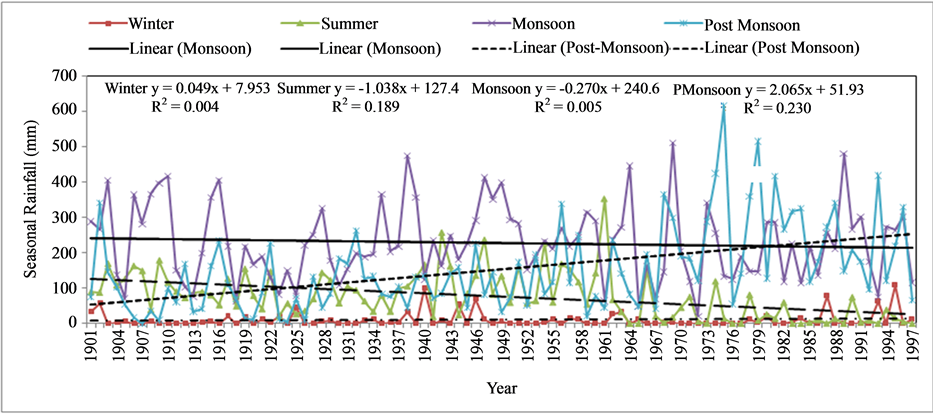
Figure 4. Seasonal rainfall trends at Akluj station.
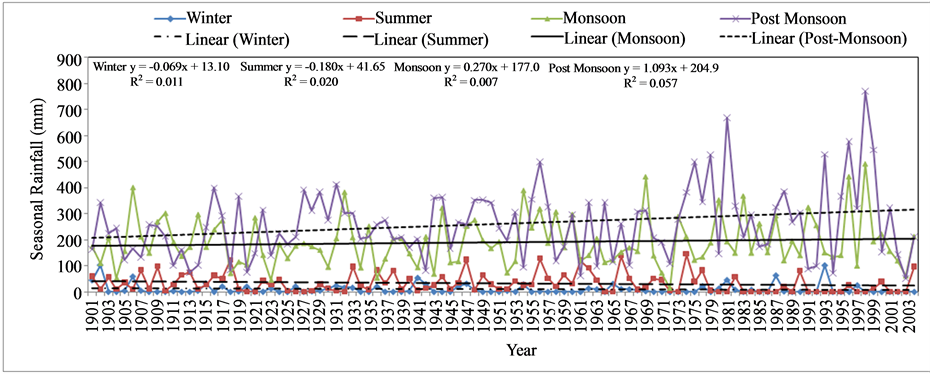
Figure 5. Seasonal rainfall trends at Baramati station.
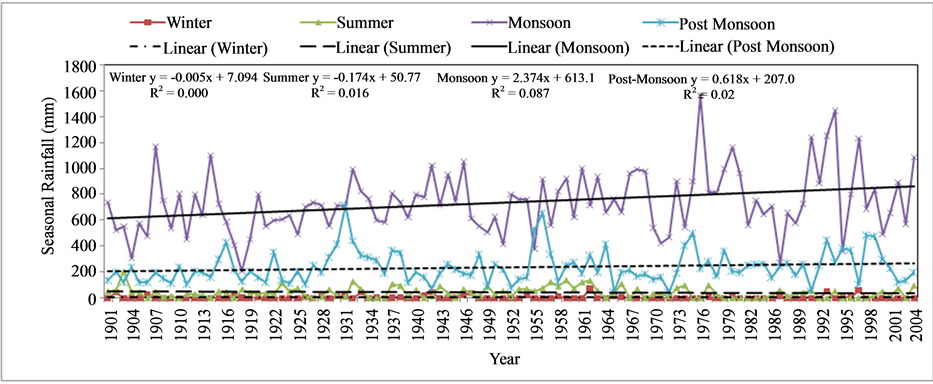
Figure 6. Seasonal rainfall trends at Bhor station.
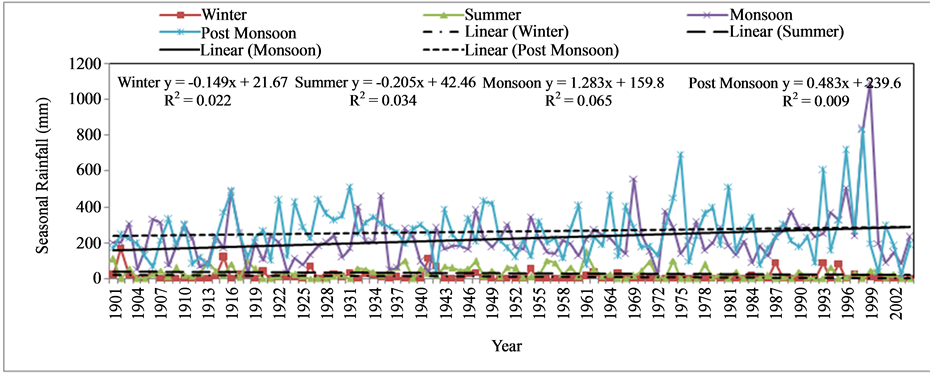
Figure 7. Seasonal rainfall trends at Malsiras station.
scale signal for annual rainfall series can be seen in Figure 8 and annual rainfall series are shown in Figures 8(a) and 8(b) show the power (absolute value squared) of the wavelet transform for the annual rainfall of all raingauge stations. This gives information on the relative power at a certain scale and a certain time, that means period where it oscillates with the corresponding frequency. In the case of the annual rainfall series, most of the high power (red colour) can be found concentrated within a band of 2 - 8 and 4 - 8 years at Akluj and other three stations during 1960-1980. Also higher intensity (red colour) has been observed for 2 - 8 years during recent four decades for all stations except Akluj. Due to edge effects of wavelet processing, the cone of influence which represent the periods with uninter-pretable is also shown in Figure 8(b) (hatched areas) and consequently they should be ignored in all analysis. More than 10 - 16 years periods are the apparent periodicity at the beginning and end of the time-series which is not real. The wavelet analysis clearly shows a noticeable change in the rainfall pattern after 1960’.
That means periodic component are responsible for producing increasing trend in the annual rainfall series of all stations and change in rainfall pattern after 1960. This fact might be due to climate change as larger anthropogenic trends are recorded during the period of 1960-1990 [46] [47] .
5. Conclusion
This study reveals significant changes in seasonal and annual rainfall in Nira river basin of Maharashtra, Central
Table 4. t-test significance for linear equation.
(*10% significance level).
Table 5. Homogeneity of stations by Chi-square statistic.
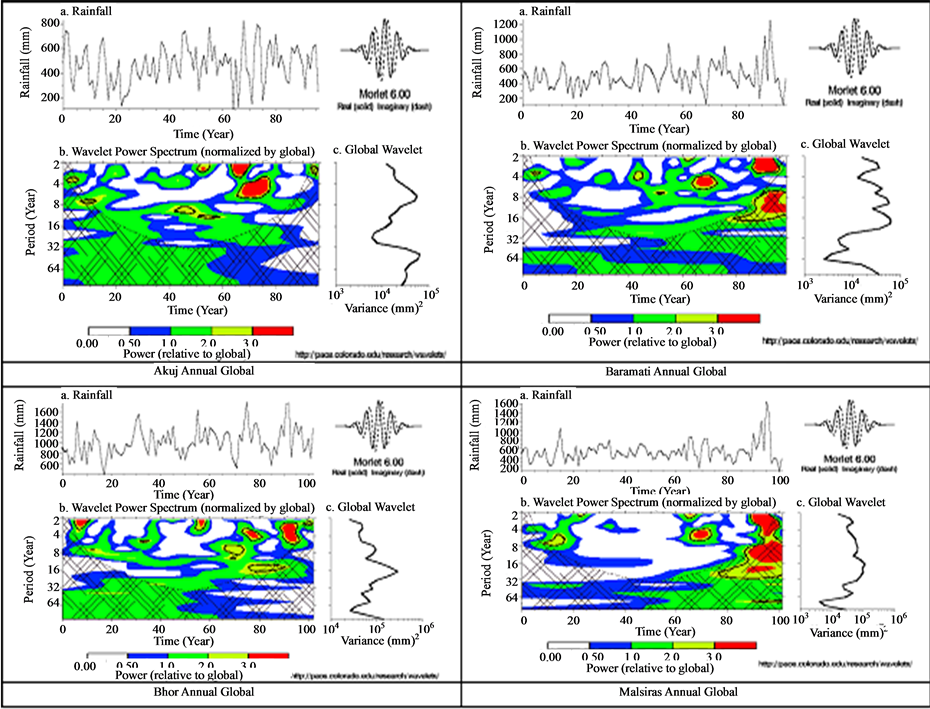
Figure 8. (a) Annual Rainfall. (b) The Wavelet Power Spectrum. The power has been scaled by the global wavelet spectrum (at right). The cross-hatched region is the cone of influence, where zero padding has reduced the variance. Black contour is the 10% significance level, using the global wavelet as the background spectrum. (c) The Global Wavelet Power Spectrum.
India during past 104 years. Significant increasing trends are detected in annual rainfall at 10% significance level for the Akluj and Bhor stations. Seasonal rainfalls in the basin have increased especially during the monsoon and post-monsoon seasons. Bhor station shows maximum change in the magnitude of trend for annual and monsoon series. The wavelet analysis shows that periodicity of 2 - 8 years is found in annual rainfall after 1960 confirming the well-known fact that more changes in the rainfall pattern have occurred after 1960. The analysis shows that larger anthropogenic trends are embedded in the climate data in the baseline period i.e. during 1961 to 1990. It is possible that climatic changes taking place after 1960 might have affected the rainfall pattern in the basin which needs further investigations. The analysis of rainfall data and findings shall be useful for irrigation and agricultural managers and may play an important role in managing water resources in the basin.
References
- Douglas, E.M., Vogel, R.M. and Knoll, C.N. (2000) Trends in Flood and Low Flows in the United States: Impact of Spatial Correlation. Journal of Hydrology, 240, 90-105. http://dx.doi.org/10.1016/S0022-1694(00)00336-X
- Partal, T. and Kahya, E. (2006) Trend Analysis in Turish Precipitation Data. Hydrologic Process, 20, 2011-2026. http://dx.doi.org/10.1002/hyp.5993
- Basistha, A., Arya, D.S. and Goel, N.K. (2008) An Analysis of Historical Rainfall Change in Indian Himalayas. International Journal of Climatology, 29, 555-572. http://dx.doi.org/10.1002/joc.1706
- Kumar, V. and Jain, S.K. (2011) Trends in Rainfall Amount and Number of Rainy Days in River Basins of India (1951-2004). Hydrology Research, 42, 290-306. http://dx.doi.org/10.2166/nh.2011.067
- Jain, S.K., Kumar, V. and Saharia, M. (2012) Analysis of Rainfall and Temperature Trends in Northeast India. International Journal of Climatology, 33, 968-978. http://dx.doi.org/10.1002/joc.3483
- Murumkar, A., Arya, D.S. and Rahman, M.M. (2013) Seasonal and Annual Variations of Rainfall Pattern in the Jamuneswari Basin, Bangladesh. On a Sustainable Future of the Earth’s Natural Resources (ed.). Springer Earth System Sciences, Springer-Verlag, Berlin, Heidelberg, 349-362.
- Kothyari, U.C. and Singh, V.P. (1996) Rainfall and Temperature Trends in India. Hydrological Processes, 10, 357-372. http://dx.doi.org/10.1002/(SICI)1099-1085(199603)10:3<357::AID-HYP305>3.0.CO;2-Y
- Arora, M., Goel, N.K. and Singh, P. (2005) Evaluation of Temperature Trends over India. Hydrological Sciences Journal, 50, 81-93.
- Chattopadhyay, N. and Hulme, M. (1997) Evaporation and Potential Evapotranspiration in India under Conditions of Recent and Future Climate Change. Agricultural and Forest Meteorology, 87, 55-73. http://dx.doi.org/10.1016/S0168-1923(97)00006-3
- Burn, D.H. and Hesch, N.M. (2007) Trends in Evaporation for the Canadian Prairies. Journal of Hydrology, 336, 61-73. http://dx.doi.org/10.1016/j.jhydrol.2006.12.011
- Zhang, X., Harvey, K.D., Hogg, W.D. and Yuzyk, T.R. (2001) Trends in Canadian Streamflow. Water Resources Research, 37, 987-998. http://dx.doi.org/10.1029/2000WR900357
- Cigizoglu, H.K., Bayazit, M. and Önöz, B. (2005) Trends on the Maximum, Mean and Low Flows of Turkish Rivers. Journal of Hydrometeorology, 6, 280-295. http://dx.doi.org/10.1175/JHM412.1
- Van Belle, G. and Hughes, J.P. (1984) Nonparametric Tests for Trend in Water Quality. Water Resources Research, 20, 127-136. http://dx.doi.org/10.1029/WR020i001p00127
- Kalayci, S. and Kahya, E. (1998) Detection of Water Quality Trends in the Rivers of the Susurluk Basin. Turkish Journal of Engineering and Environmental Science, 22, 503-514.
- Mooley, D.A. and Parthasarthy, B. (1984) Fluctuations of All India Summer Monsoon Rainfall during 1871-1978. Climatic Change, 6, 287-301. http://dx.doi.org/10.1007/BF00142477
- Thapliyal, V. and Kulshrestha, S.M. (1991) Decadal Changes and Trends over India. Mausam, 42, 333-338.
- Kumar, V., Jain, S.K. and Singh, Y. (2010) Analysis of Long-Term Rainfall Trends in India. Hydrological Sciences Journal, 55, 484-496. http://dx.doi.org/10.1080/02626667.2010.481373
- Koteswaram, P. and Alvi, S.M.A. (1969) Secular Trends and Periodicities in Rainfall at West Coast Stations in India. Current Science, 38, 229-231.
- Jagannathan, P. and Parthasarathy, B. (1973) Trends and Periodicities of Rainfall over India. Monthly Weather Review, 101, 371-375. http://dx.doi.org/10.1175/1520-0493(1973)101<0371:TAPORO>2.3.CO;2
- Raghavendra, V.K. (1974) Trends and Periodicities of Rainfall in Sub-Divisions of Maharashtra State. Indian Journal of Meteorology and Geophysics, 25, 197-210.
- Chaudhary, A. and Abhyankar, V.P. (1979) Does Precipitation Pattern Foretell Gujarat Climate Becoming Arid. Mausam, 30, 85-90.
- Kumar, V., Singh, P. and Jain, S.K. (2005) Rainfall Trends over Himachal Pradesh, Western Himalaya, India. Conference on Development of Hydro Power Projects—A Prospective Challenge, Shimla, 20-22 April 2005.
- Dash, S.K., Jenamani, R.K., Kalsi, S.R. and Panda, S.K. (2007) Some Evidence of Climate Change in Twentieth-Century India. Climatic Change, 85, 299-321. http://dx.doi.org/10.1007/s10584-007-9305-9
- Kumar, V. and Jain, S.K. (2010) Trends in Seasonal and Annual Rainfall and Rainy Days in Kashmir Valley in the Last Century. Quaternary International, 212, 64-69. http://dx.doi.org/10.1016/j.quaint.2009.08.006
- Mann, H.B. (1945) Non-Parametric Tests against Trend. Econometrica, 13, 245-259. http://dx.doi.org/10.2307/1907187
- Kendall, M.G. (1955) Rank Correlation Methods. Griffin, London.
- Steele, T.D., Gilroy, E.J. and Hawkinson, R.O. (1974) Techniques for the Assessment of Areal and Temporal Variations in Streamflow Quality. Open File Report, US Geological Survey, Washington DC.
- Hirsch, R.M., Slack, J.R. and Smith, R.A. (1982) Techniques of Trend Analysis for Monthly Water Quality Data. Water Resources Research, 18, 107-121. http://dx.doi.org/10.1029/WR018i001p00107
- Kahya, E. and Kalayci, S. (2004) Trend Analysis of Streamflow in Turkey. Journal of Hydrology, 289, 128-144. http://dx.doi.org/10.1016/j.jhydrol.2003.11.006
- Haan, C.T. (1995) Statistical Methods in Hydrology. Iowa State University Press, Ames, 378.
- Yue, S., Pilon, P., Phinney, B. and Cavadias, G. (2002) The Influence of Autocorrelation on the Ability to Detect Trend in Hydrological Series. Hydrological Processes, 16, 1807-1829. http://dx.doi.org/10.1002/hyp.1095
- Hamed, K.H. and Rao, A.R. (1998) A Modified Mann-Kendall Trend Test for Autocorrelated Data. Journal of Hydrology, 204, 182-196. http://dx.doi.org/10.1016/S0022-1694(97)00125-X
- Rao, A.R., Hamed, K.H. and Chen, H.L. (2003) Non-Stationarities in Hydrologic and Environmental Time Series. Kluwer Academic Publishers, Dordrecht, 362.
- Daubechies, I. (1992) Ten Lectures on Wavelets. CSBM-NSF Series Application Mathematics, 61, SIAM Publication, Philadelphia, 357.
- Polikar, R. (1999) The Story of Wavelets. In Mastorakis, N., Ed., Physics and Modern Topics in Mechanical and Electrical Engineering. World Scientific and Engineering Society Press, Athens, 192-197.
- Pisoft, P., Kalvova, J. and Brazdil, R. (2004) Cycles and Trends in the Czech Temperatures Series Using Wavelet Transform. International Journal of Climatology, 24, 1661-1670. http://dx.doi.org/10.1002/joc.1095
- Nakken, M. (1999) Wavelet Analysis of Rainfall-Runoff Variability Isolating Climatic from Anthropogenic Patterns. Environmental Modelling & Software, 14, 283-295. http://dx.doi.org/10.1016/S1364-8152(98)00080-2
- Smith, L.C., Turcotte, D.L. and Isacks, B.L. (1998) Stream Flow Characterization and Feature Detection Using a Discrete Wavelet Transform. Hydrological Processes, 12, 233-249. http://dx.doi.org/10.1002/(SICI)1099-1085(199802)12:2<233::AID-HYP573>3.0.CO;2-3
- Yan, Z., Tsimplis, M.N. and Woolf, D. (2004) Analysis of the Relationship between the North Atlantic Oscillation and Sea Level Changes in Northeast Europe. International Journal of Climatology, 24, 743-758. http://dx.doi.org/10.1002/joc.1035
- Park, J. and Mann, M.E. (2000) Inter-Annual Temperature Events and Shifts in Global Temperature: A Multiple Wavelet Correlation Approach. Earth Interactions, 19, 391-403.
- Penalba, O.C. and Vargas, W.M. (2004) Interdecadal and Interannual Variations of Annual and Extreme Precipitation over Central-Northeastern Argentina. International Journal of Climatology, 24, 1565-1580. http://dx.doi.org/10.1002/joc.1069
- Torrence, C. and Compo, G.P. (1998) A Practical Guide to Wavelet Analysis. Bulletin of the American Meteorological Society, 79, 61-78. http://dx.doi.org/10.1175/1520-0477(1998)079<0061:APGTWA>2.0.CO;2
- Helsel, D.R. and Hirsch, R.M. (2002) Statistical Methods in Water Resources. United States Geological Survey, 524.
- Santos, C.A.G., Galvão, C.O., Suzuki, K. and Trigo, R.M. (2001) Matsuyama City Rainfall Data Analysis Using Wavelet Transform. Annual Journal of Hydraulic Engineering-JSCE, 45, 211-216.
- Rupa Kumar, K., Pant, G.B., Parthasarathy, B. and Sontakke, N.A. (1992) Spatial and Sub Seasonal Patterns of the LongTerm Trends of Indian Summer Monsoon Precipitation. International Journal of Climatology, 12, 257-268. http://dx.doi.org/10.1002/joc.3370120303
- Kittel, T.G.F., Rosenbloom, N.A., Painter, T.H. and Schimel, D.S. (1995) VEMAP Modeling Participants. The VEMAP Integrated Database for Modeling United States Ecosystem/Vegetation Sensitivity to Climate Change. Journal of Biogeography, 22, 857-862. http://dx.doi.org/10.2307/2845986
NOTES

*Corresponding author.