American Journal of Climate Change
Vol.2 No.4(2013), Article ID:40682,9 pages DOI:10.4236/ajcc.2013.24027
Climate Change Effect on Winter Temperature and Precipitation of Yellowknife, Northwest Territories, Canada from 1943 to 2011
Department of Geography, University of Winnipeg, Winnipeg, Canada
Email: *J.binyamin@uwinnipeg.ca
Copyright © 2013 Janelle Laing, Jacqueline Binyamin. This is an open access article distributed under the Creative Commons Attribution License, which permits unrestricted use, distribution, and reproduction in any medium, provided the original work is properly cited.
Received August 14, 2013; revised September 16, 2013; accepted October 15, 2013
Keywords: Yellowknife; Climate Change; Climate Variability; Climate Modes; Teleconnections; ENSO; SOI, PDO; PNA; AO; SCAND; Sunspot Area
ABSTRACT
The correlation of the Southern Oscillation Index (SOI), Pacific Decadal Oscillation (PDO), Pacific North American Oscillation (PNA), Arctic Oscillation (AO), and Scandinavia (SCAND) indices with winter (DJF) temperature and precipitation for the period of 1943 to 2011 was analyzed to study climate change and variability of Yellowknife, NWT. SOI correlated negatively with both temperature (r = −0.14) and precipitation (r = −0.06) causing colder, drier conditions during La Niña and warmer, wetter conditions during El Niño. PDO was shown to have a strong positive correlation with both temperature (r = 0.60) and precipitation (r = 0.33) causing warmer, wetter weather in the positive phase and colder, drier weather in the negative phase. PNA showed the strongest positive correlation for both temperature (r = 0.69) and precipitation (r = 0.37) causing very warm and wet conditions in the positive phase and very cold and dry conditions during the negative phase. AO correlated negatively with temperature (r = −0.04) and positively with precipitation (r = 0.24) causing colder, wetter conditions in the positive phase and warmer, drier conditions in the negative phase. Finally SCAND was shown to have a weak negative correlation with both temperature (r = −0.10) and precipitation (r = −0.18). Sunspot area showed a strong negative correlation (r = −0.30) with temperature and a very weak positive correlation (r = 0.07) with total annual precipitation. Yellowknife’s average annual temperature and precipitation have increased by 2.5˚C and 120 mm, respectively throughout the past 69 years.
1. Introduction
The arctic system is particularly sensitive to change, and in light of anthropogenic climate change the arctic can be seen as an indicator to such change. There is later freezeup and earlier break-up of ice on arctic rivers and lakes [1,2], furthermore the overall extent of sea-ice is diminishing. This is uniquely important in the Arctic and Antarctic due to the high albedo of snow and ice which reflects much of the incoming solar radiation, and a positive feedback mechanism is seen when incoming solar radiation is increased and the extent of snow and ice is decreased and replaced by dark water or bare soil, rock, and vegetation which have a much lower albedos and absorb more radiation. Increased temperature and precipitation are seen throughout the Northern hemisphere including Yellowknife, NWT, Canada [3].
Yellowknife is located in the subarctic at 62˚27'17"N (latitude) and 114˚22'35"W (longitude). It is the capital of the NWT, and is situated on the north shore of Great Slave Lake at 206 m elevation. The station is 9 km in distance from the Yellowknife airport. Monthly mean winter (DJF) temperature and total precipitation values from the Global Historical Climate Network (GHCN-V3) during the period of 1943 to 2011 were analyzed to study climate change and variability in Yellowknife. Data were separated into two time periods (1943-1972 and 1973- 2011) to evaluate the influence of selected climate modes on the station. The two time periods were chosen strategically to assess to what degree increased greenhouse gas emissions have had on the influence of climate modes. The effects of sunspot area were also assessed and were shown to have a strong influence on the climate of the station.
Climate modes or teleconnections are naturally occurring aspects of the quasi-chaotic atmospheric system. Sea-surface temperatures and ocean circulation patterns play a vital role in the creation and persistence of teleconnections. Selected climate modes were studied to assess their influence on the climate of Yellowknife. El Niño Southern Oscillation (ENSO), Pacific Decadal Oscillation (PDO), Pacific North American Oscillation (PNA), Arctic Oscillation (AO), and Scandinavia (SCAND) were all shown to have varying degrees of influence on the temperature and precipitation of Yellowknife. The strongest links between Yellowknife’s climate and the telecomnections were in the winter season (DJF), which is concurrent with climate data throughout Canada [4].
Bonsal and Shabbar [4] explained the significant relationships between the outlined teleconnection patterns and ecosystem-related variables such as the duration of lake and river ice, the timing of snowmelt and spring peak stream flow, and the onset of spring. Most studies focus on the effects of climate modes on a very broad area [5-8] however this study examines the effects of five climate modes on Yellowknife’s temperature and precipitation. Currently there are no studies focused exclusively on our station’s climate.
Section 2 describes and discusses temperature and precipitation results and their correlation with climate modes as well as sunspot area; and Section 3 includes a summary and conclusions.
2. Results and Discussion
2.1. Temperature
Yellowknife’s climate is extremely seasonal, experiencing an annual temperature range of 39.2˚C. The average annual temperature during the study period (1943 to 2011) was −4.7˚C, the coldest season being winter (DJF) with an average temperature of −24.6˚C, followed by spring (MAM) at −6.3˚C, then fall (SON) at −2.5˚C, and finally summer (JJA) being the warmest at 14.6˚C.
Yellowknife has experienced an increase in temperature of 2.5˚C during the 69-year study period (Figure 1). Decadal and 30 year temperature averages show a cooler period from 1943-1972 and a warmer period from 1973- 2011 (Figures 2 and 3). This is concurrent with the warming trend of the arctic and subarctic regions [9]. Causes for the warming can be linked to anthropogenic forcing through increased greenhouse gas emissions, snowice albedo feedback mechanisms, and the influence of certain climate modes and sunspots [3]. The increase in temperature has caused a variety of changes in the landscape including a decline in permafrost levels which are consequently causing an increase in outflow of water into the Mackenzie Basin [10,11].
2.2. Precipitation
Yellowknife received an average total annual precipitation of 382.9 mm, receiving the greatest amount of precipitation in the fall (115.2 mm) and summer (111.6 mm), followed by winter (68.8 mm) and by spring (53.0 mm) with the least amount of precipitation.
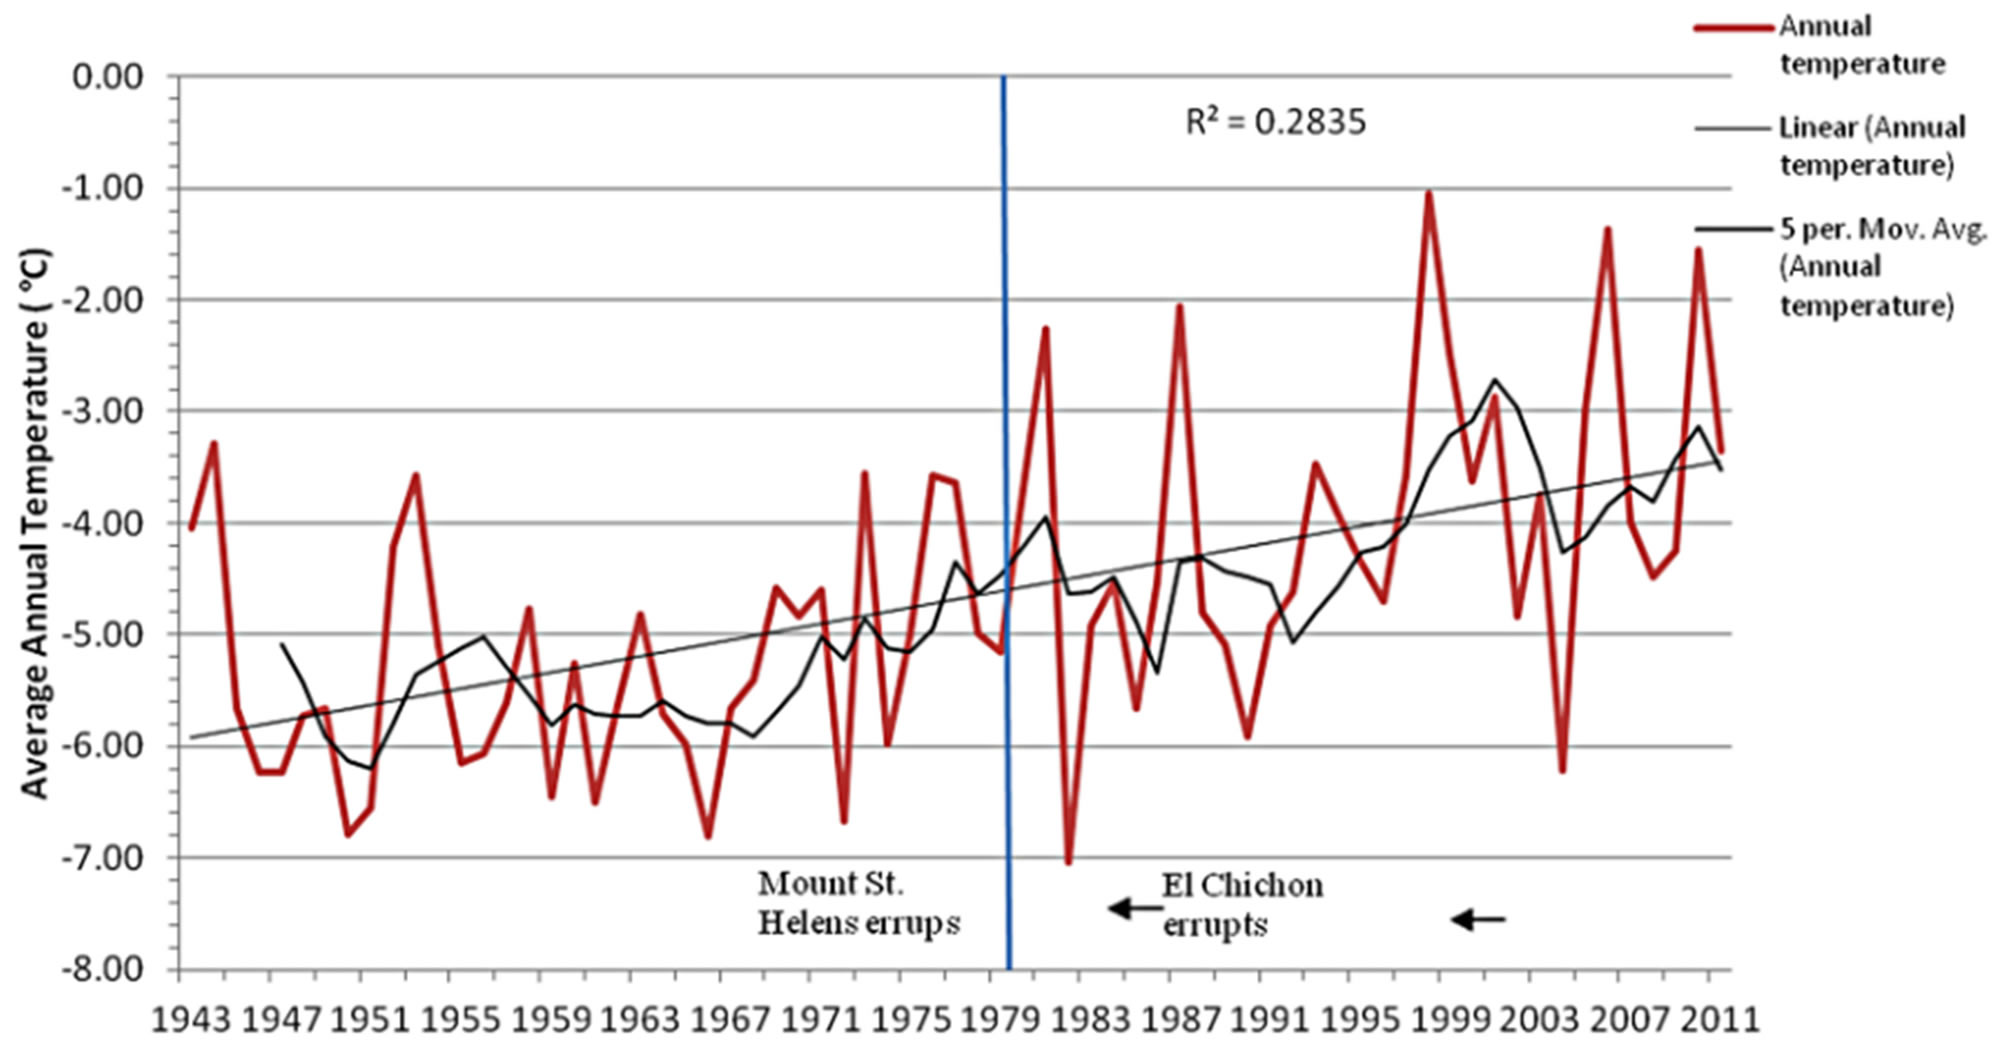
Figure 1. Annual average temperature (˚C) for Yellowknife, NWT, Canada for the years 1943 to 2011.

Figure 2. 30 year average for temperature (˚C) in Yellowknife, NWT, Canada for 1943-2011.

Figure 3. Ten year average temperature (˚C) for Yellowknife, NWT from 1943 to 2011.
Yellowknife has experienced an increase of 120 mm in total annual precipitation from 1943 to 2011 (Figure 4). Precipitation is highly dependent on temperature in this region as the warmer air temperature holds more water vapor and possibly leading to cloud formation and precipitation. The dependency of Yellowknife’s precipitation on its temperature has shown a strong positive correlation (r = 0.3, graph not shown), therefore the increase in precipitation is in accordance with the overall increase in temperature. Many of the same effects from the teleconnections seen in temperature were also seen in precipitation values.
2.3. Correlation with Climate Modes
2.3.1. Southern Oscillation Index (SOI)
ENSO is characterized by the ocean-atmospheric interaction in the equatorial Pacific and overlying atmosphere. SOI defines the atmospheric anomaly and is generated by the pressure differences between Tahiti and Darwin, Australia. During the positive SOI index (La Niña phase), there is an unusually shallow thermocline in the eastern tropical pacific, strong easterly winds, and lower than average pressure over Darwin causing updraft and higher than normal pressure over the eastern tropical Pacific, causing subsistence. During the negative SOI index (El Niño phase) the effects are reversed; easterlies weaken or reverse in direction and become westerlies. There is a low pressure cell over the eastern tropical Pacific, increasing precipitation, and the thermocline sinks to a greater depth and a higher pressure cell over Darwin, Australia. Secondary effects are seen in North America and are as follows: during La Niña episodes high pressure over the north Pacific pushes the Polar jet stream further north producing colder temperatures in the northern United States and north western Canada. However, during El Niño episodes warmer temperatures are seen throughout western Canada and northern United States and wet cool weather over southern United States and Northern Mexico [4].
Figure 5 shows the correlation between Yellowknife’s average winter temperature and total winter precipitation with winter SOI values. The correlation is negative for both temperature (r = −0.14) and precipitation (r = −0.06). Seasonal averages are not shown as they do not have any significant influence on the station’s climate. SOI data are from: http://www.cru.uea.ac.uk/cru/data/soi/soi.dat.
Temperature outliers in Figure 1 can be explained in part by the influence of ENSO such as the annual average temperature in 1998 at −1.04˚C, which was the warmest annual average recorded and was also a strong El Nino year, as well as 2010 and 1987 at −1.56˚C and −2.06˚C, respectively, which were moderate El Nino years. However, there are other outliers that do not have the same correlation with a moderate to strong ENSO event such as 1983, which was a strong El Nino year, the annual average was −4.93˚C. However Mount St. Helens located south of Seattle, Washington erupted in May 1980 and El Chichón located in southern Mexico erupted in April of

Figure 4. Total annual precipitation (mm) for Yellowknife, NWT, Canada from 1943 to 2011.
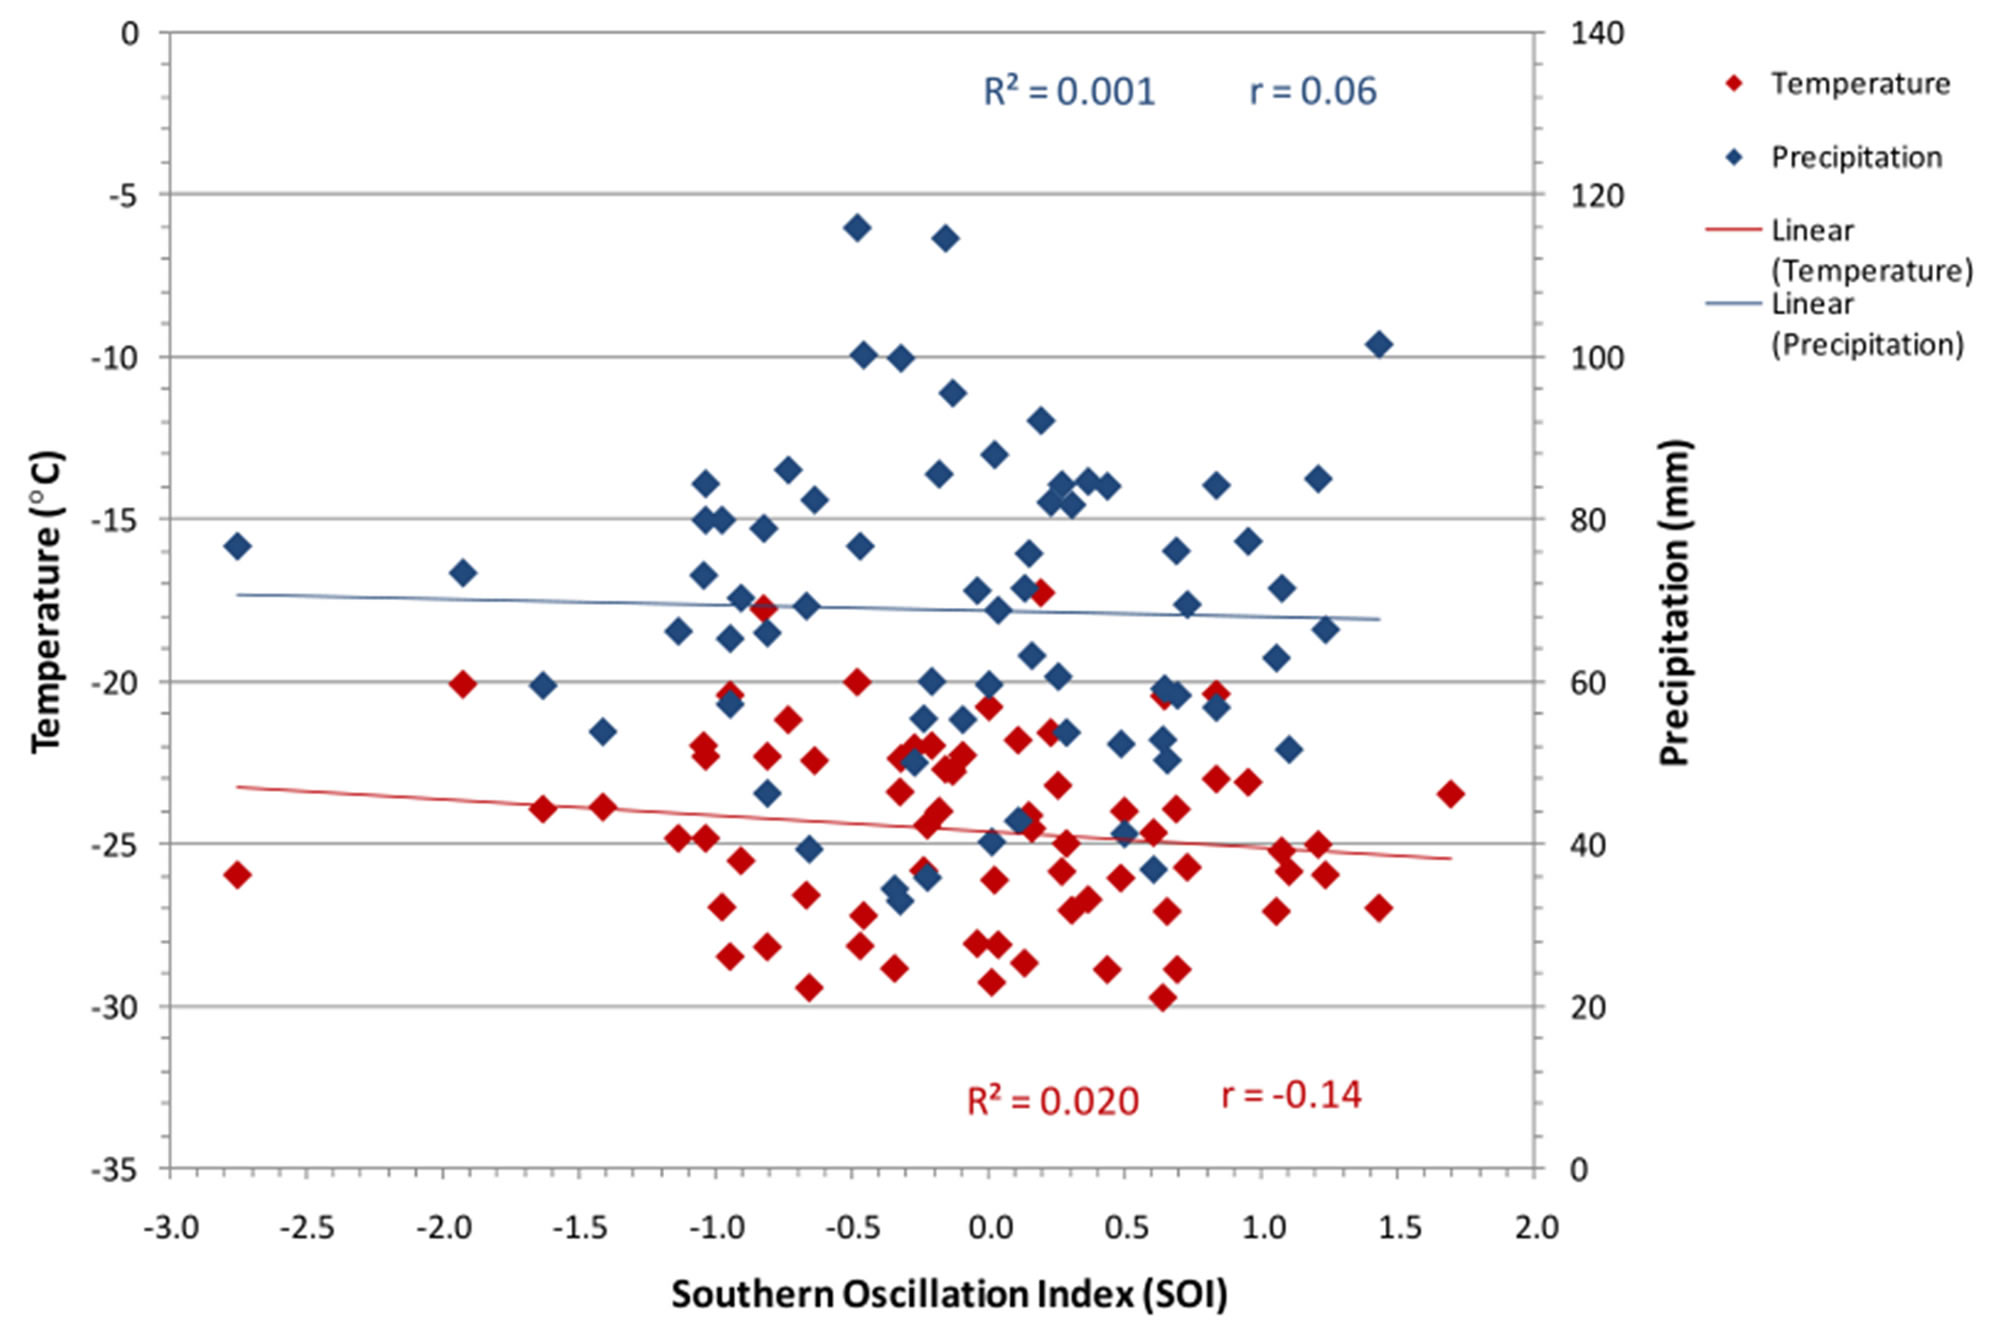
Figure 5. Correlation between average winter SOI and average winter temperature (˚C) and total winter precipitation (mm) for Yellowknife, NWT, Canada for the years 1943 to 2011.
1982, which both were possible contributors to the cooling. Other significant temperature outliers do not follow a pattern in regards to ENSO.
When the data was broken up into the following sections: 1943 to 1972 and 1973 to 2011, for the purposes of comparing pre and post major greenhouse gas emissions, different correlation coefficients between temperature, precipitation and SOI were yielded. The era before increased greenhouse gas emissions (1943-1972), the correlation coefficient for average winter temperature values was −0.09 and precipitation values were −0.01. However, for the following period, 1972-2011 the correlation coefficient increased to −0.15 for temperature and −0.05 for precipitation, meaning ENSO gained a stronger influence on the temperature and precipitation in Yellowknife.
Winters in Canada following El Niño events are commonly linked with below normal precipitation throughout western and central Canada and are often colder and snowier than normal following La Niña events [6]. However, Figure 5 shows that during La Niña episodes precipitation in Yellowknife is slightly reduced and during El Niño episodes precipitation in slightly increased.
2.3.2. Pacific Decadal Oscillation (PDO)
PDO events typically persist twenty to thirty years before changing phase; effects are most visible in the North Pacific and North American sectors with secondary effects in the pacific equatorial region (Bonsal, and Shabbar, 2011). The teleconnection is similar to ENSO in spatial positioning but much longer-lived. It is characterized by changes in sea surface temperature, sea level pressure, and wind patterns. The positive or warm phase is characterized by warm ocean waters along the north-western coast of North America and equatorial region and cool sea surface temperatures in the central North Pacific. Opposite conditions are observed in the negative or cool phase [4].
Winter PDO values compared to average winter temperatures show a very strong positive correlation (Figure 6) with r = 0.60; meaning that in the positive phase higher temperatures were observed and in the negative phase lower temperatures were observed. A cool PDO event dominated from 1947-1976 and a warm event from 1977 through to approximately the mid 1990s. Figures 2 and 3 show a similar pattern with cooler temperatures from 1943 to 1972 and warmer temperatures from 1973 onward. PDO data are from: http://jisao.washington.edu/pdo/PDO.latest.
When the data is separated into preand post-increased greenhouse gas emissions time periods, correlation coefficient values differ by a reasonable amount. From 1943 to 1972, PDO strongly influences temperature (r = 0.66), however from 1973 to 2011 the influence of PDO on the temperature weakens as the correlation value drops to 0.36.
PDO has shown to have a strong positive correlation (r = 0.33) on total winter precipitation (Figure 6), PDO causes more precipitation in the positive phase and less in the negative phase. When separated into the two time periods, the effect of PDO differed significantly, from 1944 to 1972 it showed a very strong positive correlation (r = 0.51), that influence weakens immensely from 1973 to 2011 as the correlation changed to weak and negative (r = −0.07). In the earlier period, the teleconnection caused more precipitation in the positive phase and less in the negative phase, and in the later period the positive phase caused slightly less precipitation and slightly more in the negative phase. This could be due to the overlap with other teleconnections.
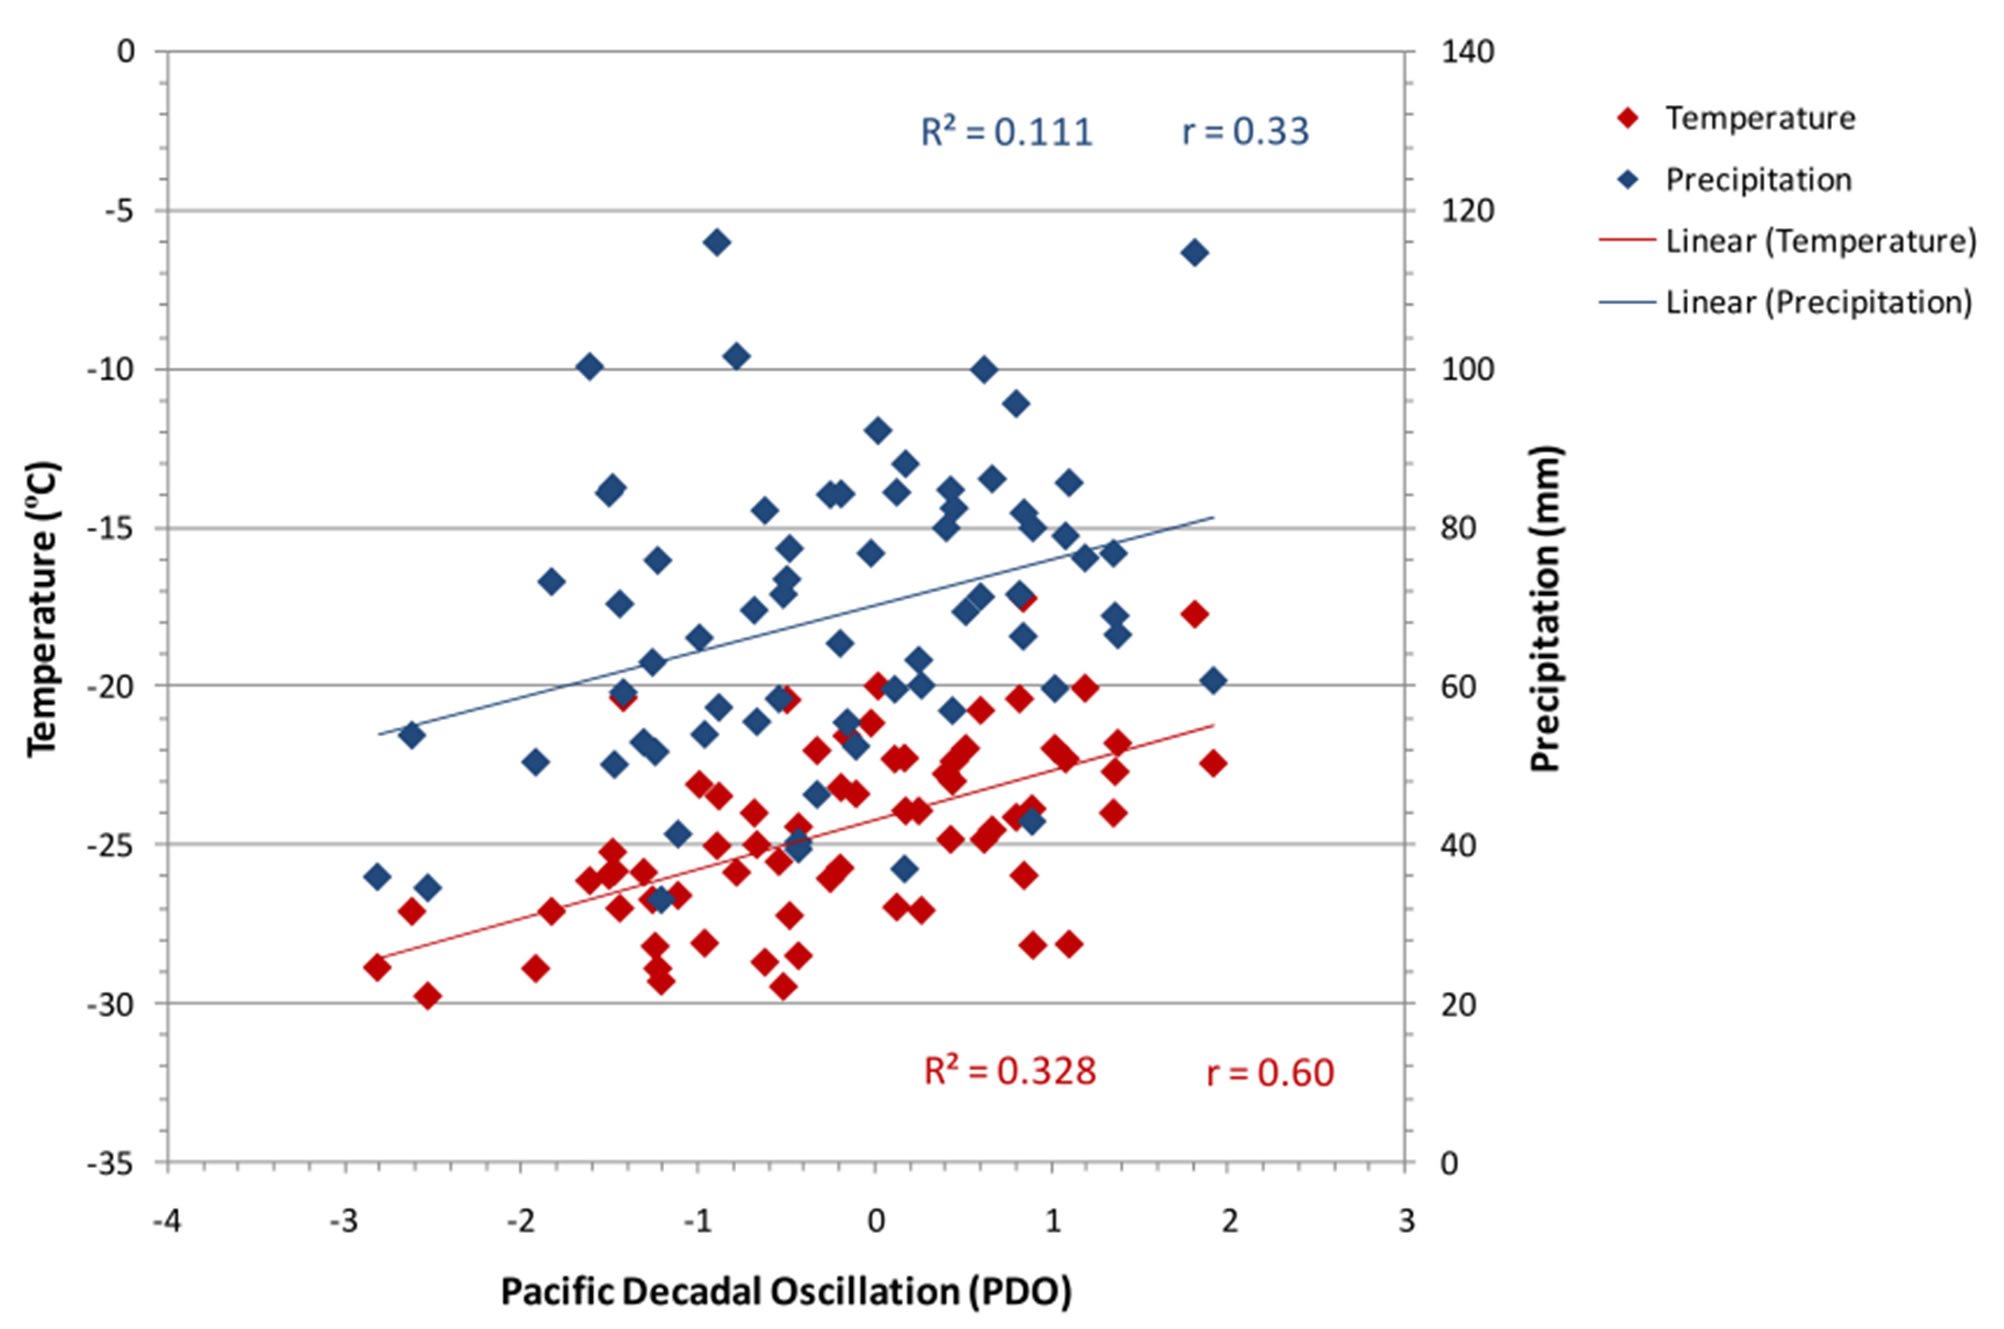
Figure 6. Correlation between winter PDO and average winter temperature (˚C) and total winter precipitation (mm) for Yellowkniwfe, NWT, Canada from 1943 to 2011.
2.3.3. Pacific North American Oscillation (PNA)
The PNA is one of the more influential climate modes in the Northern hemisphere mid-latitudes and is found to be strongly influenced by ENSO. It is characterized by 700 mb pressure height anomalies over the Aleutian Islands and the vicinity of Hawaii. The positive phase is associated with Pacific warm episodes comparable to El Niño and above normal pressure heights in the vicinity of Hawaii and western Canada causing above normal temperatures, and below normal heights over the eastern US causing below normal temperatures. The negative phase, contrary to the positive phase is associated with Pacific cold episodes similar to La Niña and below normal pressure heights in the western Canada causing below normal temperatures and above normal pressure heights in the eastern US causing above normal temperatures [5].
Figure 7 shows the correlation between winter PNA, average winter temperature and total winter precipitation from 1951 to 2011. Temperature values showed a strong positive correlation (r = 0.69) with PNA, causing warmer temperatures in the positive phase and cooler temperatures in the negative phase. From 1951 to 1972 the correlation is at its strongest (r = 0.79), then drops to 0.6 from 1973 to 2011. PNA values in Figure 7 are from: http://www.cpc.ncep.noaa.gov/products/precip/CWlink/pna/norm.pna.monthly.b5001.current.ascii.table.
PNA has a strong positive correlation (r = 0.37) with total winter precipitation throughout the study period, producing more precipitation during the positive phase and less precipitation during the negative phase (Figure 7). PNA has a much stronger influence on precipitation from 1951 to 1972 (r = 0.49) than it does from 1973 to 2011 (r = 0.13).
2.3.4. Arctic Oscillation (AO)
AO also referred to as the Northern hemisphere annular mode is characterized by sea level pressure (SLP) anomalies poleward of 20˚N. In its positive phase, AO causes strong winds to circulate around the North Pole confining colder air. As AO enters its negative phase, winds die down and allow cold arctic air masses to infiltrate into the lower latitudes [7,12].
When analyzed over the duration of the 69 year study period, AO was shown to have a very weak influence on the temperature of Yellowknife (r = −0.04, Figure not shown). The lack of significant correlation was surprising given the subarctic location of the station. However, when broken up into separate time periods, its influence is extremely variable, from 1951 to 1972 the correlation coefficient is −0.32, meaning the positive phase causes cooler temperatures and the negative phase causes warmer temperatures. From 1973 to 2011, that influence weakens (r = −0.14), still causing similar effects but to a lesser degree.
AO has shown to have a strong positive correlation on the total winter precipitation (r = 0.24). The influence increased from r = 0.05 (1951-1972) in the earlier period to r = 0.20 in the later period (1973-2011).
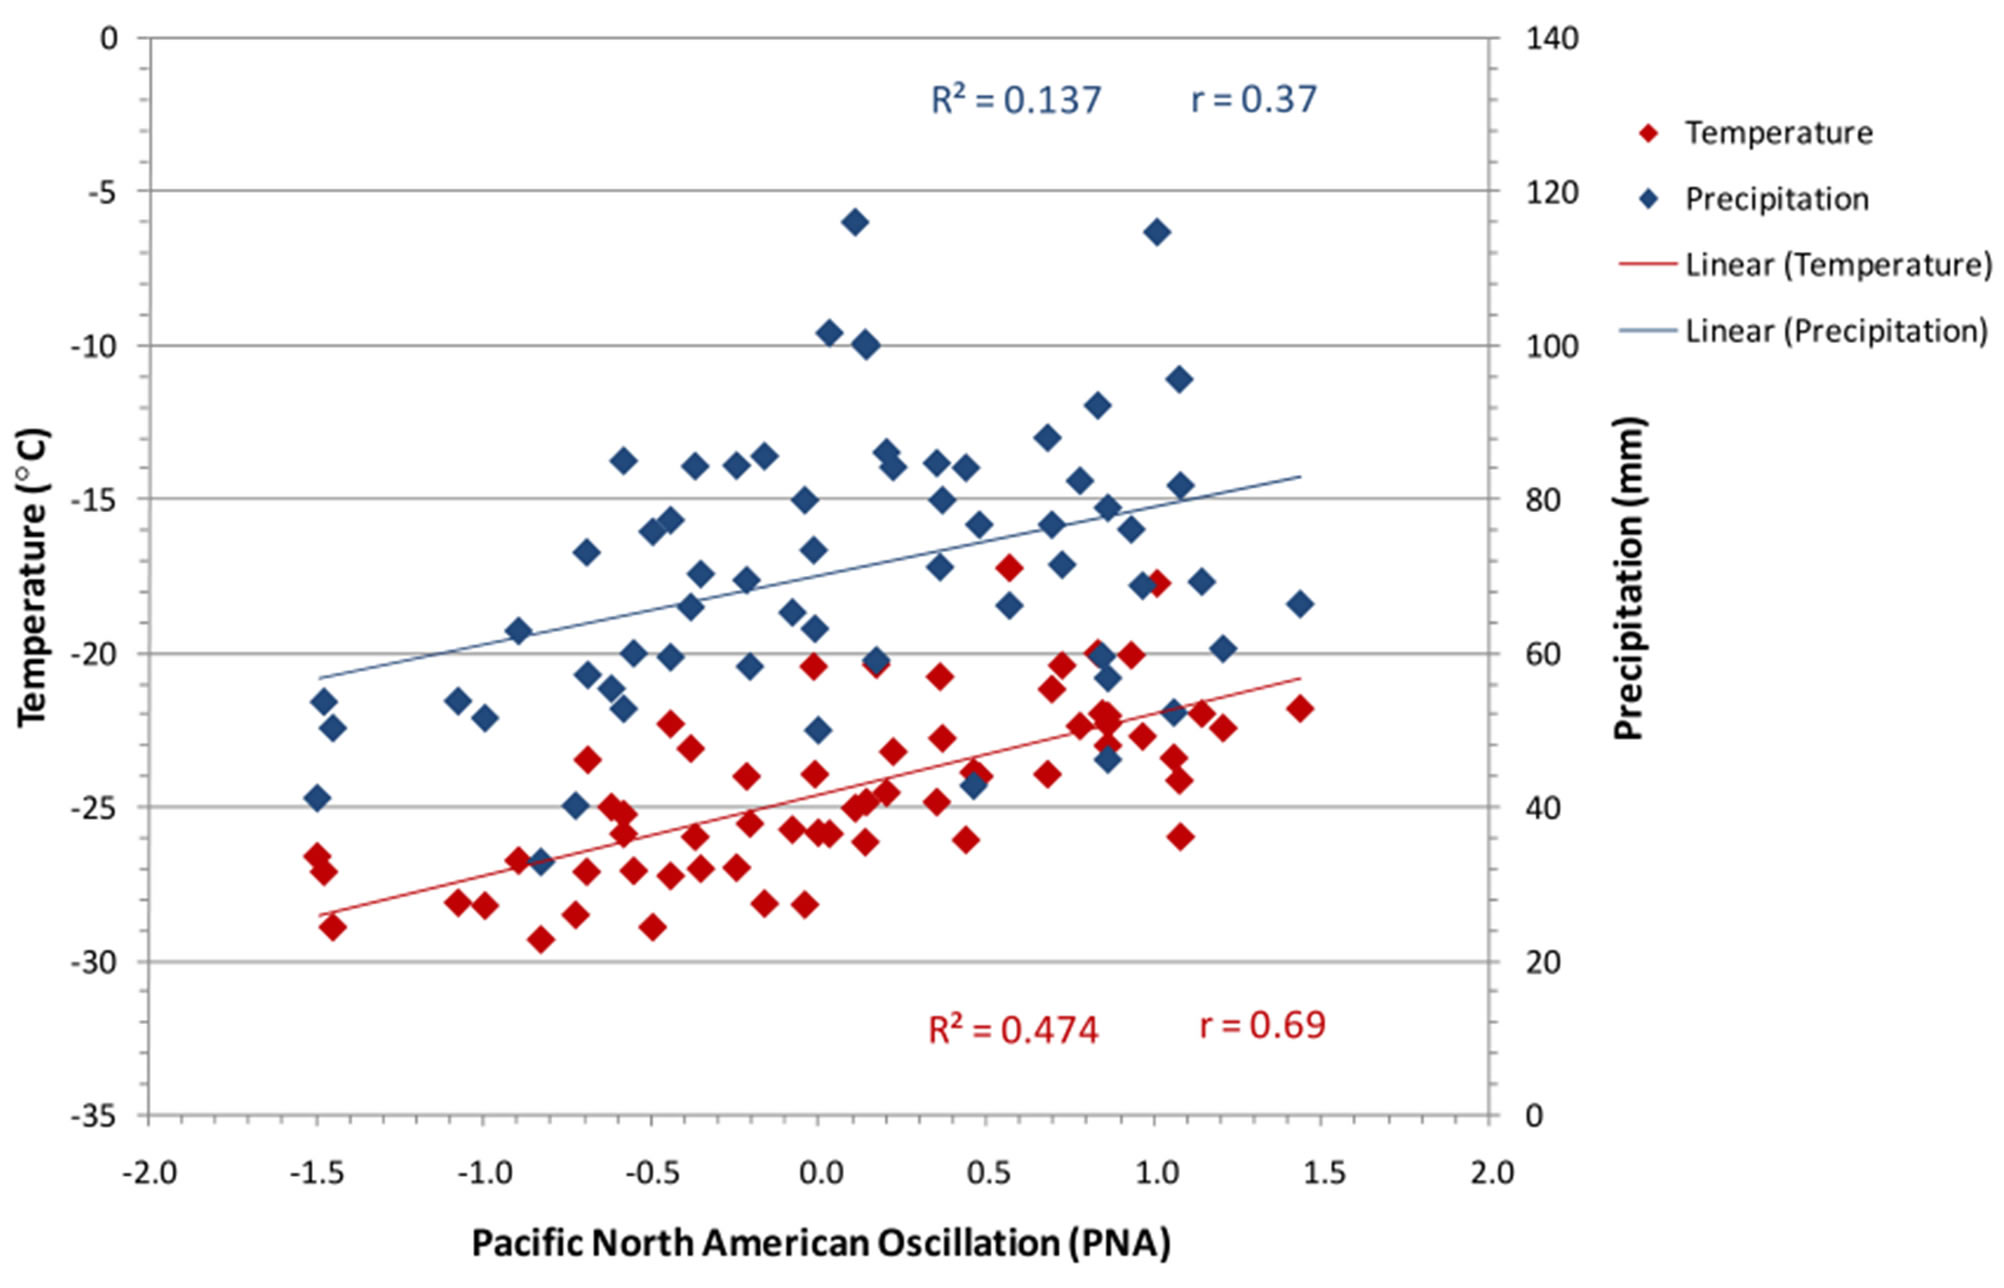
Figure 7. Correlation between winter PNA and average winter temperature (˚C) and total winter precipitation for Yellowknife, NWT, Canada from 1951 to 2011.
2.3.5. Scandinavia Pattern (SCAND)
SCAND is characterized by a primary pressure circulation over Scandinavia, with secondary opposing pressure cells over western Europe and eastern Russia/western Mongolia. The positive phase is associated with positive pressure height anomalies (higher pressure) over Scandinavia and western Russia with below average precipitation across Scandinavia and colder temperatures throughout western Europe and central Russia. The negative phase exhibits opposing temperature and precipitation effects.
The influence of SCAND has not shown to have a significant influence on Yellowknife’s temperature, a slight negative correlation was found (r = −0.10). Although the influence was greater in the past than it is now, from 1951 to 1972 the correlation coefficient was equal to −0.11and from 1973-2011 that influence weakened significantly (r = −0.001).
Throughout the duration of the study period SCAND has shown to have a significant influence on precipitation of Yellowknife; a strong negative correlation (r = −0.18) was shown. Therefore SCAND causes less precipitation during its positive phase and causes an increase in precipitation during its negative phase. SCAND showed a significant variation of influence between the two time periods, from a correlation coefficient of −0.30 from 1951 to 1972 to a much weaker relationship (r = −0.01) from 1973 to 2011.
2.4. Sunspot Area
Sunspots appear as dark spots on the sun’s surface surrounded by bright faculae. They are caused by magnetic activity that inhibits convection and consequently have a reduced temperature. Similar to climate modes, sunspots are believed to go through cycles of diminished and enhanced activity [13]. The number and area of sunspots are closely related (r = 0.98 from 1943 to 2011).
Sunspot area has shown to have a significant influence on the temperature of Yellowknife, during the study period the correlation coefficient was −0.30 (Figure 8) meaning larger sunspot area causes colder temperatures and smaller sunspot area causes warmer temperatures. When broken up into the separate time periods, the influence remained consistent. Sunspot area data are from: http://solarscience.msfc.nasa.gov/greenwch/sunspot_area.txt.
The influence of sunspot area on total annual precipitation showed a weak positive correlation (r = 0.06, Figure 8) for the whole period from 1943 to 2011. Extreme variation was seen between the two time periods. The first time period (1943 to 1972) showed a very strong positive relationship (r = 0.43), which means more precipitation was formed by increased sunspot area. In the later period from 1973-2011 the relationship was reversed; a correlation coefficient of −0.12 was yielded
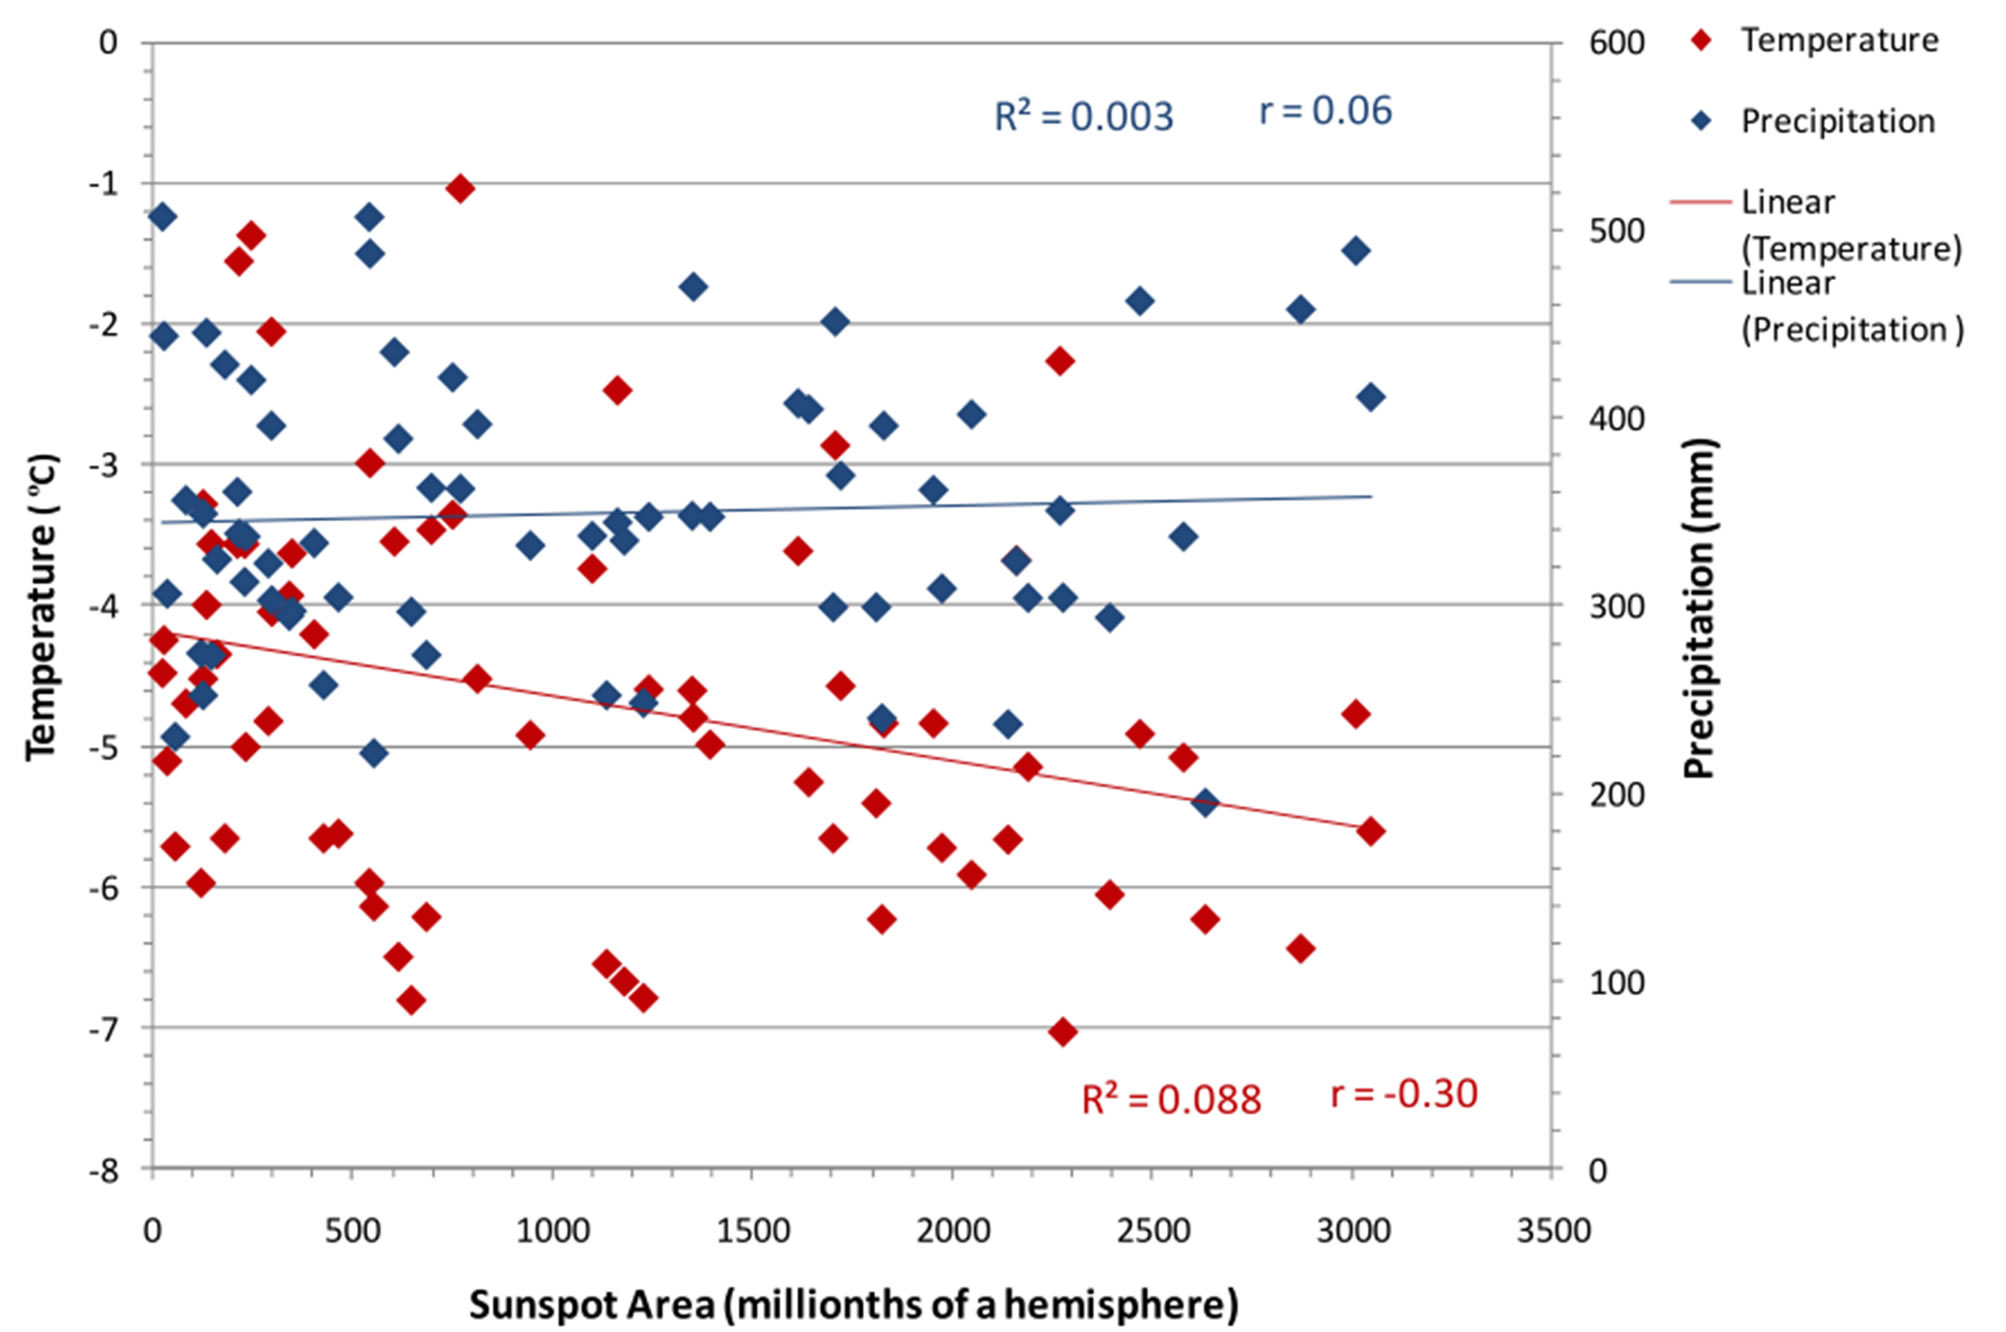
Figure 8. Sunspot area (millionths of a hemisphere) in relation to annual average temperature (˚C) and total annual precipitation (mm) for Yellowknife, NWT, Canada from 1943 to 2011.
meaning that less precipitation was caused by an increased area of sunspots and more precipitation was caused by a decreased area of sunspots.
3. Summary and Conclusions
Both temperature and precipitation have increased over the 69-year study period, temperature increased by 2.5˚C and precipitation by 120 mm. The results from the comparisons between the time period of 1943 to 1972 and the later period from 1973 to 2011 demonstrate the varying degrees of impact of different climate modes and sunspot area has on Yellowknife’s temperature and precipitation over time. The mid-1970s mark an important period, many climatic changes and phenomena are shown to begin or accelerate during this period. The increase in both temperature and precipitation can be attributed in part to the intensification of the greenhouse effect through increased anthropogenic greenhouse gas emissions [3,14].
ENSO events, although short lived have a weak negative correlation with winter temperature and precipitation generating colder, drier weather during La Niña events and warmer wetter winters during El Niño events. ENSO gained a stronger influence on temperature over time but its influence remained consistent over time for precipitation.
The PDO has shown to be very influential in Yellowknife’s climate and may be a partial source of the warming that is observed. The correlation between PDO and temperature is very strong and positive (r = 0.60) but weakened over time (r = 0.36). In the earlier time period PDO showed a strong positive correlation with precipitation (r = 0.33) then changed to a weak negative correlation (r = −0.07) in the later period. Similarly to PDO, PNA showed a very strong positive correlation with temperature (r = 0.69) but weakened over time (r = 0.60) and showed a similar pattern with precipitation (r = 0.37) and changed to (r = 0.13). AO was shown to have a weak negative correlation with temperature (r = −0.04) and when analyzed in the separate time period it showed a decreasing influence from r = −0.32 to r = −0.14. AO was shown to have opposite effects on precipitation yielding a strong positive correlation (r = 0.24) over the duration of the study period and when separated into the earlier and later periods, was shown to gain influence. Finally SCAND was shown to have a negative correlation with temperature (r = −0.10) and precipitation (r = −0.18), and showed a weaker influence in the later period.
The effect of sunspots on Yellowknife’s temperature was opposite from what would normally be expected; causing cooler temperatures with a greater sunspot area and warmer temperatures with a smaller sunspot area. The effect remained fairly consistent over time. However, with increasing sunspot area more precipitation was caused when analyzed from 1943 to 2011. The influence of sunspot area over time showed great variability, in the earlier period the correlation was strong and positive (r = 0.47) but in the later period the correlation was weak and negative (r = −0.12).
The changing influence of the teleconnections on the climate of Yellowknife cannot be attributed solely to the increased amount of greenhouse gas emissions as there is currently no consensus on how increases in greenhouse gas emissions have influenced the occurrence of the outlined teleconnections.
Similar findings by Bonsal and Shabbar [4] showed that teleconnections had the strongest influence on Canadian climate in the cold season. Positive PDO events were related to be warmer than normal temperature over western and central Canada on a longer time-scale; the opposite effects were seen during the negative phase of PDO. Also teleconnection-precipitation relationships were not found to be as significant as teleconnection-temperature relationships.
Future work should focus on climate warming and the decline of the extent of permafrost, which has implications that extend beyond the environmental impacts. The people living in the communities up north can no longer be assured that the existing structures built on terrain formerly underlain by permafrost are still stable. Also the influence of warmer climate on the earlier ice-break up and later ice freeze-up on sub-arctic and arctic rivers and lakes is very important, which causes issues of transportation for people traveling by ski-doo and dog sled. These are both primary modes of transportation for northern communities as there are not extensive road networks.
REFERENCES
- J. J. Magnuson, D. M. Robertson, B. J. Benson, R. H. Wynne, D. M. Livingstone, T. Arai, R. A. Assel, R. J. Barry, V. Card, E. Kuusisto, N. G. Granin, T. D. Prowse, K. M. Stewart and V. S. Vuglinski, “Historical Trends in Lake and River Ice Cover in the Northern Hemisphere,” Science, Vol. 289, No. 5485, 2000, pp. 1743-1746. http://dx.doi.org/10.1126/science.289.5485.1743
- A. S. Gagnon and W. A. Gough, “Trends in the Dates of Ice Freeze-Up and Breakup over Hudson Bay, Canada,” Arctic Institute of North America, Vol. 54, No. 8, 2005, pp. 370-382.
- P. Lemke, J. Ren, R. B. Alley, I. Allison, J. Carrasco, G. Flato, Y. Fujii, G. Kaser, P. Mote, R. H. Thomas and T. Zhang, “Observations: Changes in Snow, Ice and Frozen Ground,” In: S. Solomon, D. Qin, M. Manning, Z. Chen, M. Marquis, K. B. Averyt, M. Tignor and H. L. Miller, Eds., Climate Change 2007: The Physical Science Basis. Contribution of Working Group I to the Fourth Assessment Report of the Intergovernmental Panel on Climate Change, 2007, Cambridge University Press, Cambridge, UK, New York, pp. 339-383.
- B. Bonsal and A. Shabbar, “Large-Scale Climate Oscillations Influencing Canada, 1900-2008,” Canadian Biodiversity: Ecosystem Status and Trends 2010, Technical Thematic Report No. 4, Canadian Councils of Resource Ministers, 2011.
- D. J. Leathers, B. Yarnal and M. A. Palecki, “The Pacific/North American Teleconnection Pattern and United States Climate, Part I: Regional Temperature and Precipitation Associations,” Journal of Climate, Vol. 4, No. 5, 1991, pp. 517-528. http://dx.doi.org/10.1175/1520-0442(1991)004<0517:TPATPA>2.0.CO;2
- A. Shabbar, B. Bonsal and M. Khandekar, “Canadian Precipitation Patterns Associated with the Southern Oscillation,” Journal of Climate, Vol. 10, No. 12, 1997, pp. 3016- 3027. http://dx.doi.org/10.1175/1520-0442(1997)010<3016:CPPAWT>2.0.CO;2
- C. Deser, “On the Teleconnectivity of the Arctic Oscillation,” Geophysical Research Letters, Vol. 27, No. 6, 2000, pp. 779-782. http://dx.doi.org/10.1029/1999GL010945
- L. D. Hinzman, N. D. Bettez, W. R. Bolton, F. S. Chapin, M. B. Dyurgerov, C. L. Fastie and K. Yoshikawa, “Evidence and Implications of Recent Climate Change in Northern Alaska and Other Arctic Regions,” Climatic Change, Vol. 72, No. 3, 2005, pp. 251-298. http://dx.doi.org/10.1007/s10584-005-5352-2
- J. Screen and I. Simmonds, “Declining Summer Snowfall in the Arctic: Causes, Impacts and Feedbacks,” Climate Dynamics, Vol. 38, No. 11-12, 2012, pp. 2243-2256. http://dx.doi.org/10.1007/s00382-011-1105-2
- M. F. Pisaric, S. M. St-Onge and S. V. Kokelj, “TreeRing Reconstruction of Early-Growing Season Precipitation from Yellowknife, Northwest Territories, Canada,” Arctic, Antarctic, and Alpine Research, Vol. 41, No. 4, 2009, pp. 486-496. http://dx.doi.org/10.1657/1938-4246-41.4.486
- J. M. St Jacques and D. J. Sauchyn, “Increasing Winter Baseflow and Mean Annual Streamflow from Possible Permafrost Thawing in the Northwest Territories, Canada,” Geophysical Research Letters, Vol. 36, No. 1, 2009, Article ID: L01401. http://dx.doi.org/10.1029/2008GL035822
- J. Enloe, “Arctic Oscillation (AO),” National Climate Data Center, National Oceanic and Atmospheric Administration, 2013. http://www.ncdc.noaa.gov/teleconnections/ao
- M. Dikpati, P. A. Gilman and G. de Toma, “The Waldmeier Effect: An Artifact of the Definition of Wolf Sunspot Number?” The Astrophysical Journal Letters, Vol. 673, No. 1, 2008, pp. L99-L101. http://dx.doi.org/10.1086/527360
- O. A. Anisimov, “Potential Feedback of Thawing Permafrost to the Global Climate System through Methane Emission,” Environmental Research Letters, Vol. 2, Vol. 4, 2007, Article ID: 045016. http://dx.doi.org/10.1088/1748-9326/2/4/045016
NOTES
*Corresponding author.