American Journal of Analytical Chemistry
Vol.5 No.4(2014), Article ID:43712,8 pages DOI:10.4236/ajac.2014.54032
Determination of Melamine in Quail Egg and Milk with Capillary Zone Electrophoresis
Yu Kong1, Chong Wei2, Zilong Wang1, Zhanwu Hou1, Hua Li1, Jiang Yu1, Jiaqiang Yuan1, Yongxi Zhao1, Jiangang Long1, Yuhai Tang1, Meili Gao1
1Institute of Mitochondrial Biology and Medicine, Department of Biological Science and Engineering, The Key Laboratory of Biomedical Information Engineering of Ministry of Education, School of Life Science and Technology, Xi'an Jiaotong University, Xi’an, China
2Department of Criminal and Inspectoral, Public Security Bureau of Hanzhong City, Hanzhong City, China
Email: yukong@mail.xjtu.edu.cn
Copyright © 2014 by authors and Scientific Research Publishing Inc.
This work is licensed under the Creative Commons Attribution International License (CC BY).
http://creativecommons.org/licenses/by/4.0/


Received 12 January 2014; revised 17 February 2014; accepted 25 February 2014
ABSTRACT
A capillary zone electrophoresis method was developed for determination of melamine in food samples, such as quail egg and milk products. The CE procedure was performed on fused silica capillary (41 cm × 75 μm I.D.) at 17 kV using pH3.1 60mmol/L phosphate buffer as run buffer and detecting at 200 nm. The proposed method showed good linearity (0.5 - 10.0 μmol/L) and low LOD (0.5 μmol/L) with good reproducibility (RSD% was 2.4 and 3.2 for migration time and peak area respectively), which made it suitable for quantity control of the related food product.
Keywords:Capillary Zone Electrophoresis; Melamine; Food Products

1. Introduction
Melamine (MEL), a nitrogen-rich (66% by mass) chemical intermediate, which is often used to produce plastics and melamine-formaldehyde resins, had been found in foods as an illegal addictive to increase the apparent protein content in related foods. MEL is less harmful, however, it could form insoluble harmful crystals via reacting with its metabolite (cyanuric acid) and later one could cause damage to the organs (such as kidney), and even lead to death in some cases [1] -[3] . Therefore, it is critical to establish a simple, rapid, potent method for detecting MEL especially in low concentration.
Varieties of assay methods, such as liquid chromatography [4] [5] , gas chromatography [6] -[8] , capillary electrophoresis [9] -[13] , etc. coupled with kinds of detectors, such as ultra-violet detector [10] [11] , diode array detector [12] , electrical chemical detector [13] and mass spectrum [4] -[8] etc., had been selected and applied to determine MEL in milk and related products [4] [7] -[9] [13] , infant formula [10] [11] , pet food [5] [12] to name a few. Among these methods, sample treatment steps seemed to be one of the crucial factors to maintain better separation. However, some of them were complicated and time-consuming. For example, in HPLC methods, additional extraction steps, such as liquid-liquid [4] , liquid-solid extraction [5] at cation-exchange [14] or hydrophilic modes [6] , were normally needed for clearance of interferents from complicated samples. Moreover, in some cases (like GC mode [6] -[8] ), special sample treatments, such as derivatization, were demanded to obtain better separation. All these additional sample treatment steps limited their applications to some extent.
In our works, CE, which has several advantages of high performance, high resolution, rapid, smaller sample volumes and solvent consumption comparing with traditional analytical techniques, was used for determination of MEL in real sample (taking quail egg and pure milk as examples). The sample treatment procedure as well as factors that influence separation (pH and concentration of the buffer, separation voltage etc.) were carefully optimized. Under optimization condition, base-line separation of MEL can be easily obtained within 15-min. The proposed method showed a good linearity (0.5 - 10.0 mmol/L, R2 = 0.9907) and reproducibility (RSD% for migration time and peak area was both less than 3.2%), lower limits of detection (LOD = 0.5 μmol/L) which makes it suitable for assay of MEL in related foods.
2. Materials and Methods
2.1. Reagents
MEL was purchased from the Sigma-Aldrich (USA, sigma-Aldrich, 99.0%). Phosphoric acid, sodium phosphatedibasic, sodium dihydrogen phosphate and sodium hydroxide (NaOH) were analytical reagents (Tianjin kermel). Acetone, acetonitrile, and methanol, obtained from Hongyan company (Tianjin, chromatographic grade). All reagents and solutions were used directly. Water used throughout was purified by OLST M6 (Ao Lian Co, Xian, China) with a conductivity of 18.2 Ωcm.
2.2. Apparatus
A K1030 Capillary electrophoresis (CE) system (KaiAo, CHINA), equipped with an ultraviolet (UV) detector (LC-900, KaiAo, CHINA), was used for CE experiments. Fused silica capillary (75 μm I.D. and 365 μm O.D.,) was obtained from Yongnian optical fiber company (Hebei, China) with a total length of 50 cm and the effective length of 41 cm from the inlet. Blender was from Shangliang electronic company (MEI JIA BAO, A-288, CHINA), A PB-10 pH meter (Sartorius, Germany) was employed for pH measurements. Centrifugation was performed on a 5810R (Eppendorf, Germany).
2.3. Sample Preparation
Milk samples were treated with different organic solvent or TCA at certain ratio (see section 3.3.1). And then samples were blended and sonicated again for 10 min at 20˚C. Finally, samples were centrifuged at 12,000 rpm for 10 min at 4˚C. The supernate was filtered by 0.45 μm syringe filter before injection; Quail eggs (obtained from a local market) were peeled, blended and sonicated for 10 min at 20˚C, then were treated as milk samples. For recovery test, MEL was added to the real sample prior the sample treatment.
2.4. Electrophoresis Procedure
A pH3.1 60.0 mmol/L phosphate buffer was served as ruining buffer. Sample was injected into capillary hydrodynamically at 50 mBar for 5 seconds and detected at 200 nm, 20˚. For the first usage, the capillary was activated with 1.0 mol/L NaOH and purified water for 10 min respectively. To maintain good reproducibility, an additional rinse step (specific pressure) using 0.1 mol/L NaOH (5min) followed with purified water (5 min) and run buffer (5 min) was recommended.
3. Results and Discussion
3.1. Optimization of Sample Treatment
3.1.1. Selection of Deprotein Reagent
As the real samples contain large amount of interferents, such as nucleic acid, protein, fat, etc., which would ruin the separation and detection, in this section, kinds of organic solvents, including methanol, acetonitrile, and acetone (the percent of organic solvent was set to 70%) as well as trichloroacetic acid (TCA), were tested for their abilities to reduce the possible interference. Our data showed that all these four sample treatment protocols could perform satisfied cleaning results. However, the recoveries (present via peak heights) obtained from these treatment methods differed (Figure 1, the shown data throughout this paper was obtained based on average of at least three parallel samples). It could be seen that, acetone treated sample showed the highest peak height among all the selected sample treatment methods and was regarded as the best one for further usage.
3.1.2. Ratio between Acetone and Real Sample
In this section, the ratios between acetone and real sample were investigated in a certain range (from 30% to 70%, percent of acetone in total volume). The electropherograms were shown in Figure 2. It could be seen that when the percent of acetone was less than 50%, the MEL could not be separated from interferents (arrow pointed in Figure 1); on the contrary, when it was larger than 50%, interferents were well separated from MEL. For the selection of acetone percent, a 60% was considered as the best one which maintained better Rs (3.57) and highest theoretical plate number (N) value (123,000) and less dilution to samples.
3.2. Selection of Separation Conditions
3.2.1. pH Value of Run Buffer
The pH value of run buffer was one of the important parameters that affect the separation and determination efficiency, as it influenced electro-osmotic flow (EOF) and the status of charged electrical species. Yan et al investigated the influence of pH in the range of 2.4 to 4.0, however, it's not adequate, as MEL contains three amino groups and the pKa values is around 5.0 - 5.5. In our works, a wider pH value ranging from 2.4 to 6.0 was carefully studied (Figure 3). It could be seen that, in pH range of 2.7 - 3.8, MEL (# in Figure 3) could be well separated from the interferent (* in Figure 3). It also could be seen that the migration times were similar to each other which may due to the slightly increase of EOF and decreased of positive charges of MEL when the pH increased. Furthermore, a change of peak order between MEL and the interferent was firstly observed in our works when the pH values went upper than 4.0 (at pH3.8, the peak of interferent appeared at the right side of MEL peak, but at pH4.5, it moved to the left side). For selection of best pH, the resolution (Rs, between MEL and interferent) combined with N values were evaluated. Our data (not shown) indicted that the Rs values went up as the pH values increased from 2.4 to 3.1, and went down when the pH increased continuously. Finally, a buffer pH of 3.1 was selected for its better N value (~115,000 ± 11,400, n = 3) and largest Rs value (3.71).
3.2.2. Selection of Buffer Concentration
The viscosity of the buffer and the thickness of the electric double layer were strongly related to buffer concentration, as a result, buffer concentration could affect EOF and hence the separation result. Normally, for selection of buffer concentration, the lowest concentration which provided a good separation was preferred, as the high concentration buffer may cause extra Joule heat generation, which in turn, caused peak broaden and decreasing in separation efficiency. In this section, a concentration range of 10 mmol/L to 100 mmol/L phosphate buffer at pH3.1 was investigated. Our works indicated that when the buffer concentration was higher than 10 mmol/L better separation could be easily obtained and when the buffer concentration was higher than 80 mmol/L, the current was too high (>200 μA) to maintain good separation (data not shown). The influences of buffer concentrations on migration times and N values were shown in Figure 4. It could be seen that the migration times increased while the buffer concentration became lager, (resulted in decreased EOF); And that the N values got its maximum value when the concentration set to 60 mmol/L (higher concentration led to higher Joule heat generation and poor efficiency), based on this, a buffer concentration of 60 mmol/L was selected for further studies.
3.2.3. Selection of Separation Voltage
In theory, higher voltage reduces analysis time, however, it may lead to significant losses of resolution and peak efficiencies if excessive Joule heat generated within the capillary. Based on this, the choice of separation voltage should be optimized with considering total analytical times, separation efficiency and other factors, like buffer
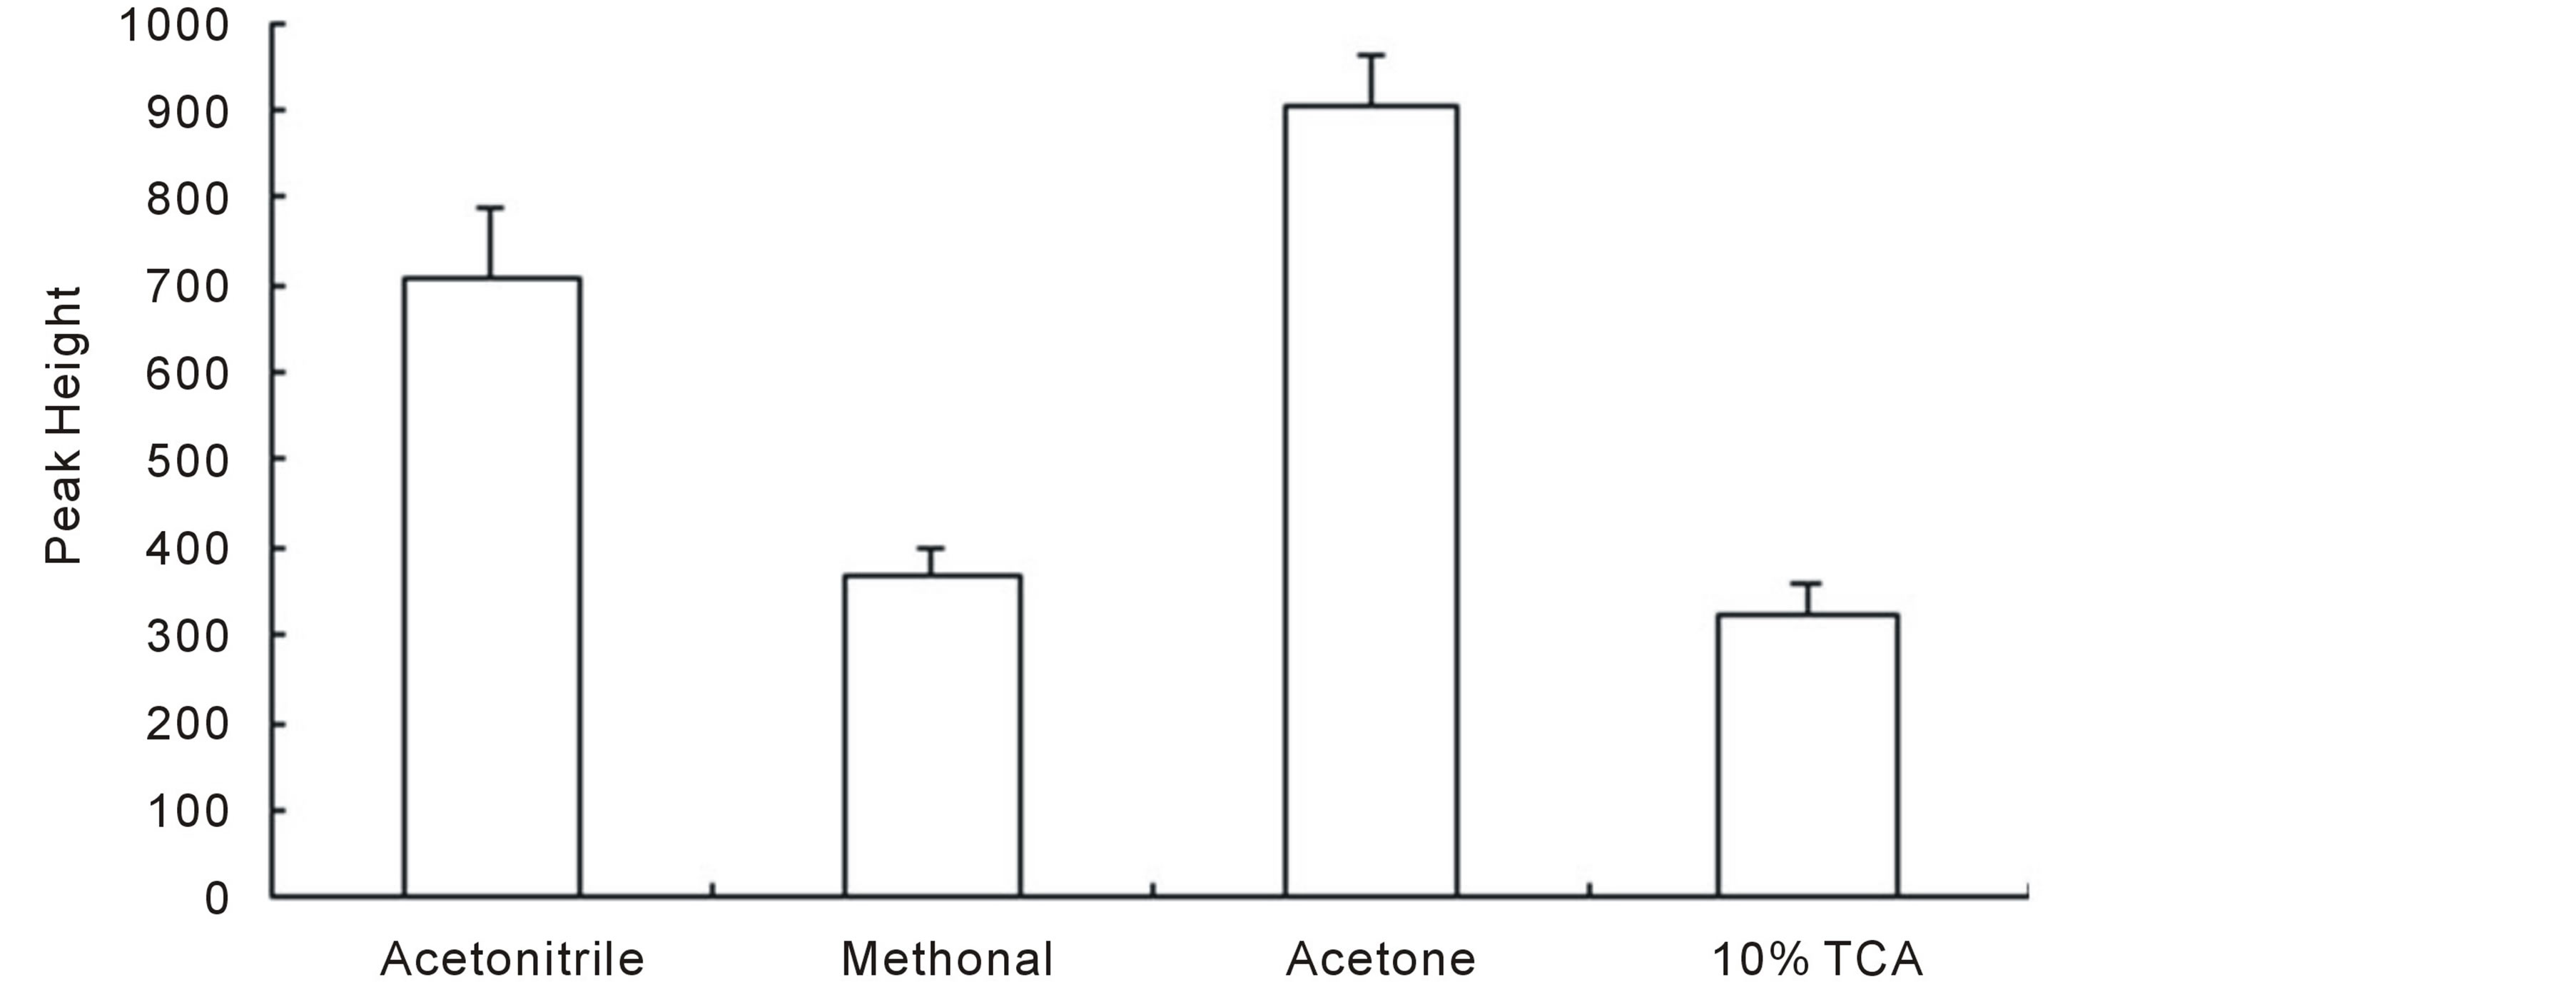
Figure 1. Effects of different sample-treatment reagents on peak heights.
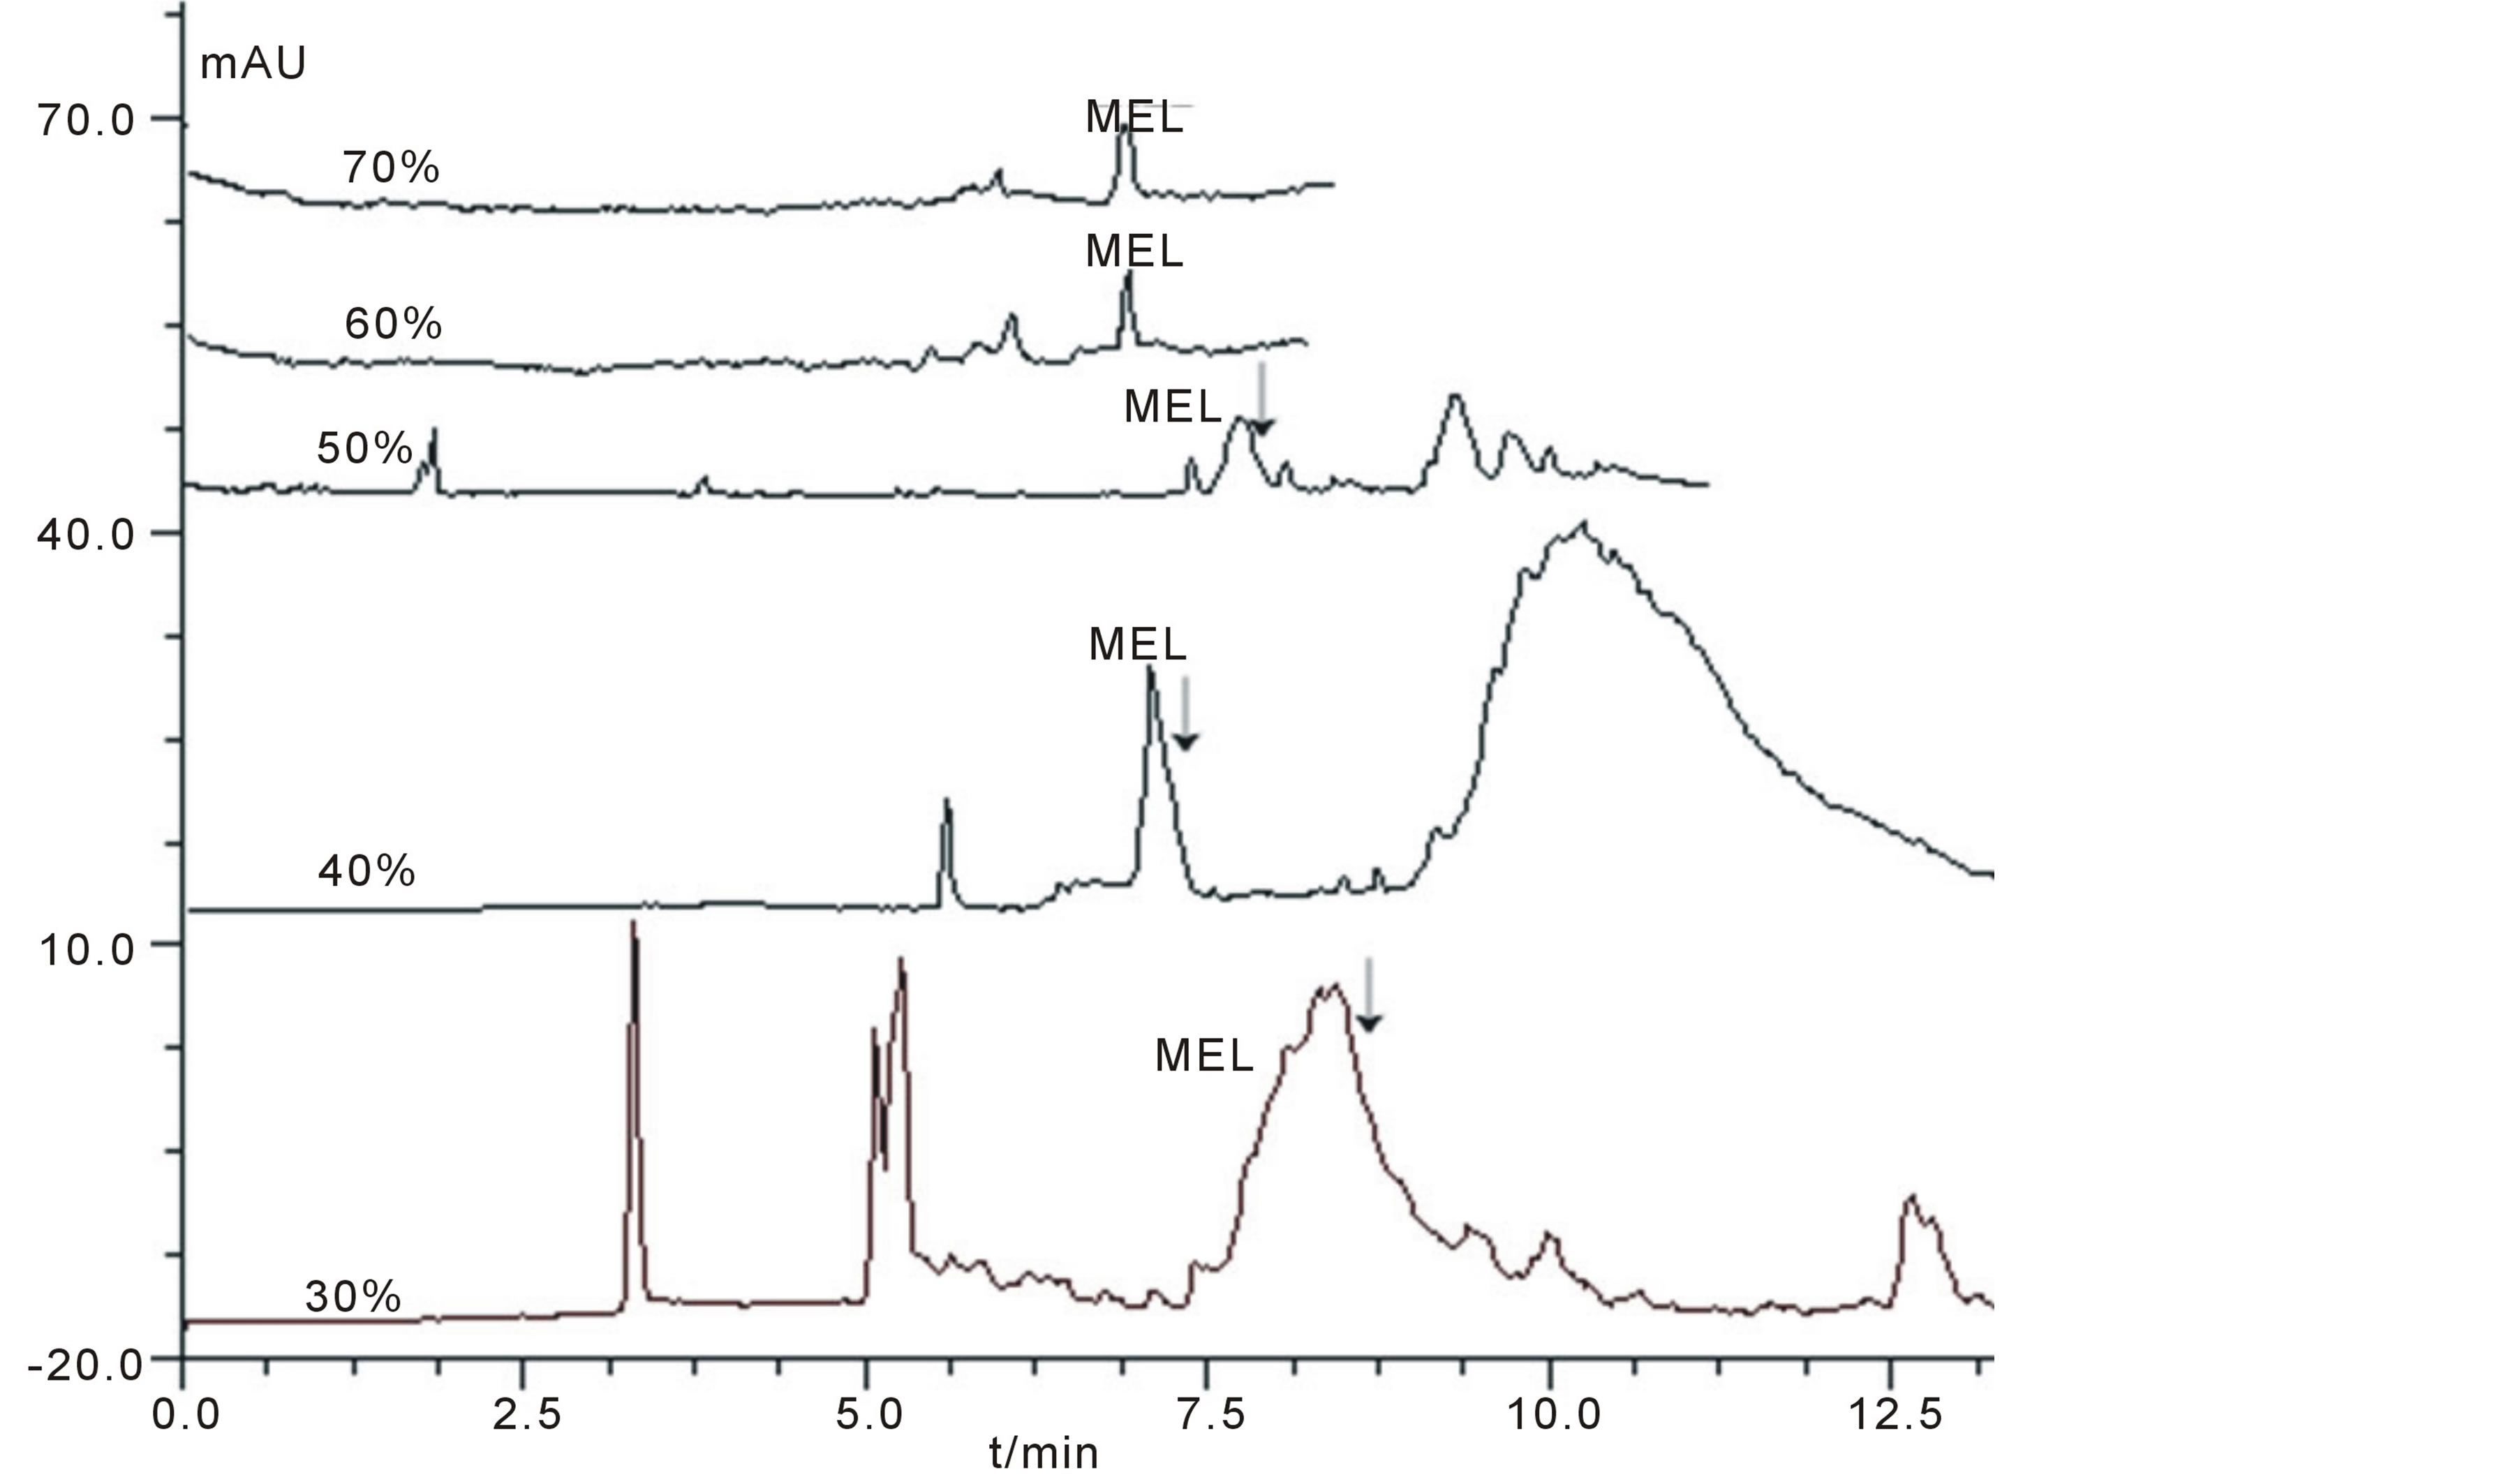
Figure 2. The electropherograms of real samples treated with different percent of acetone. Condition: The CE procedure was performed on fused silica capillary (41 cm × 75 μm I.D.) at 17 kV using a pH3.1 60mmol/L phosphate buffer as run buffer and detecting at 200 nm. Real samples were treated with different ratio of acetone as were shown in Figure 2.
concentration etc, so that an acceptable level of current could be controlled. In this section, several voltages were investigated and the results were shown in Figure 5. As was shown, N values dropped while the voltages increased, especially when the voltages became larger that 17 kV (the current reached 180 μA). It’s also could be seen that the migration times dropped with increasing separation voltages and the total analytical times shortened, however, it’s at the expense of decreased N values and Rs (data not shown). A voltage of 17 kV was finally selected as its maintained shorter analysis time and satisfied N values (~155,400).
4. Method Validation
The linearity between peak area and the concentrations was obtained from the real samples adding different amount of MEL at a final concentration of 0.5 - 10 μmol/L of MEL. For measuring the reproducibility of the
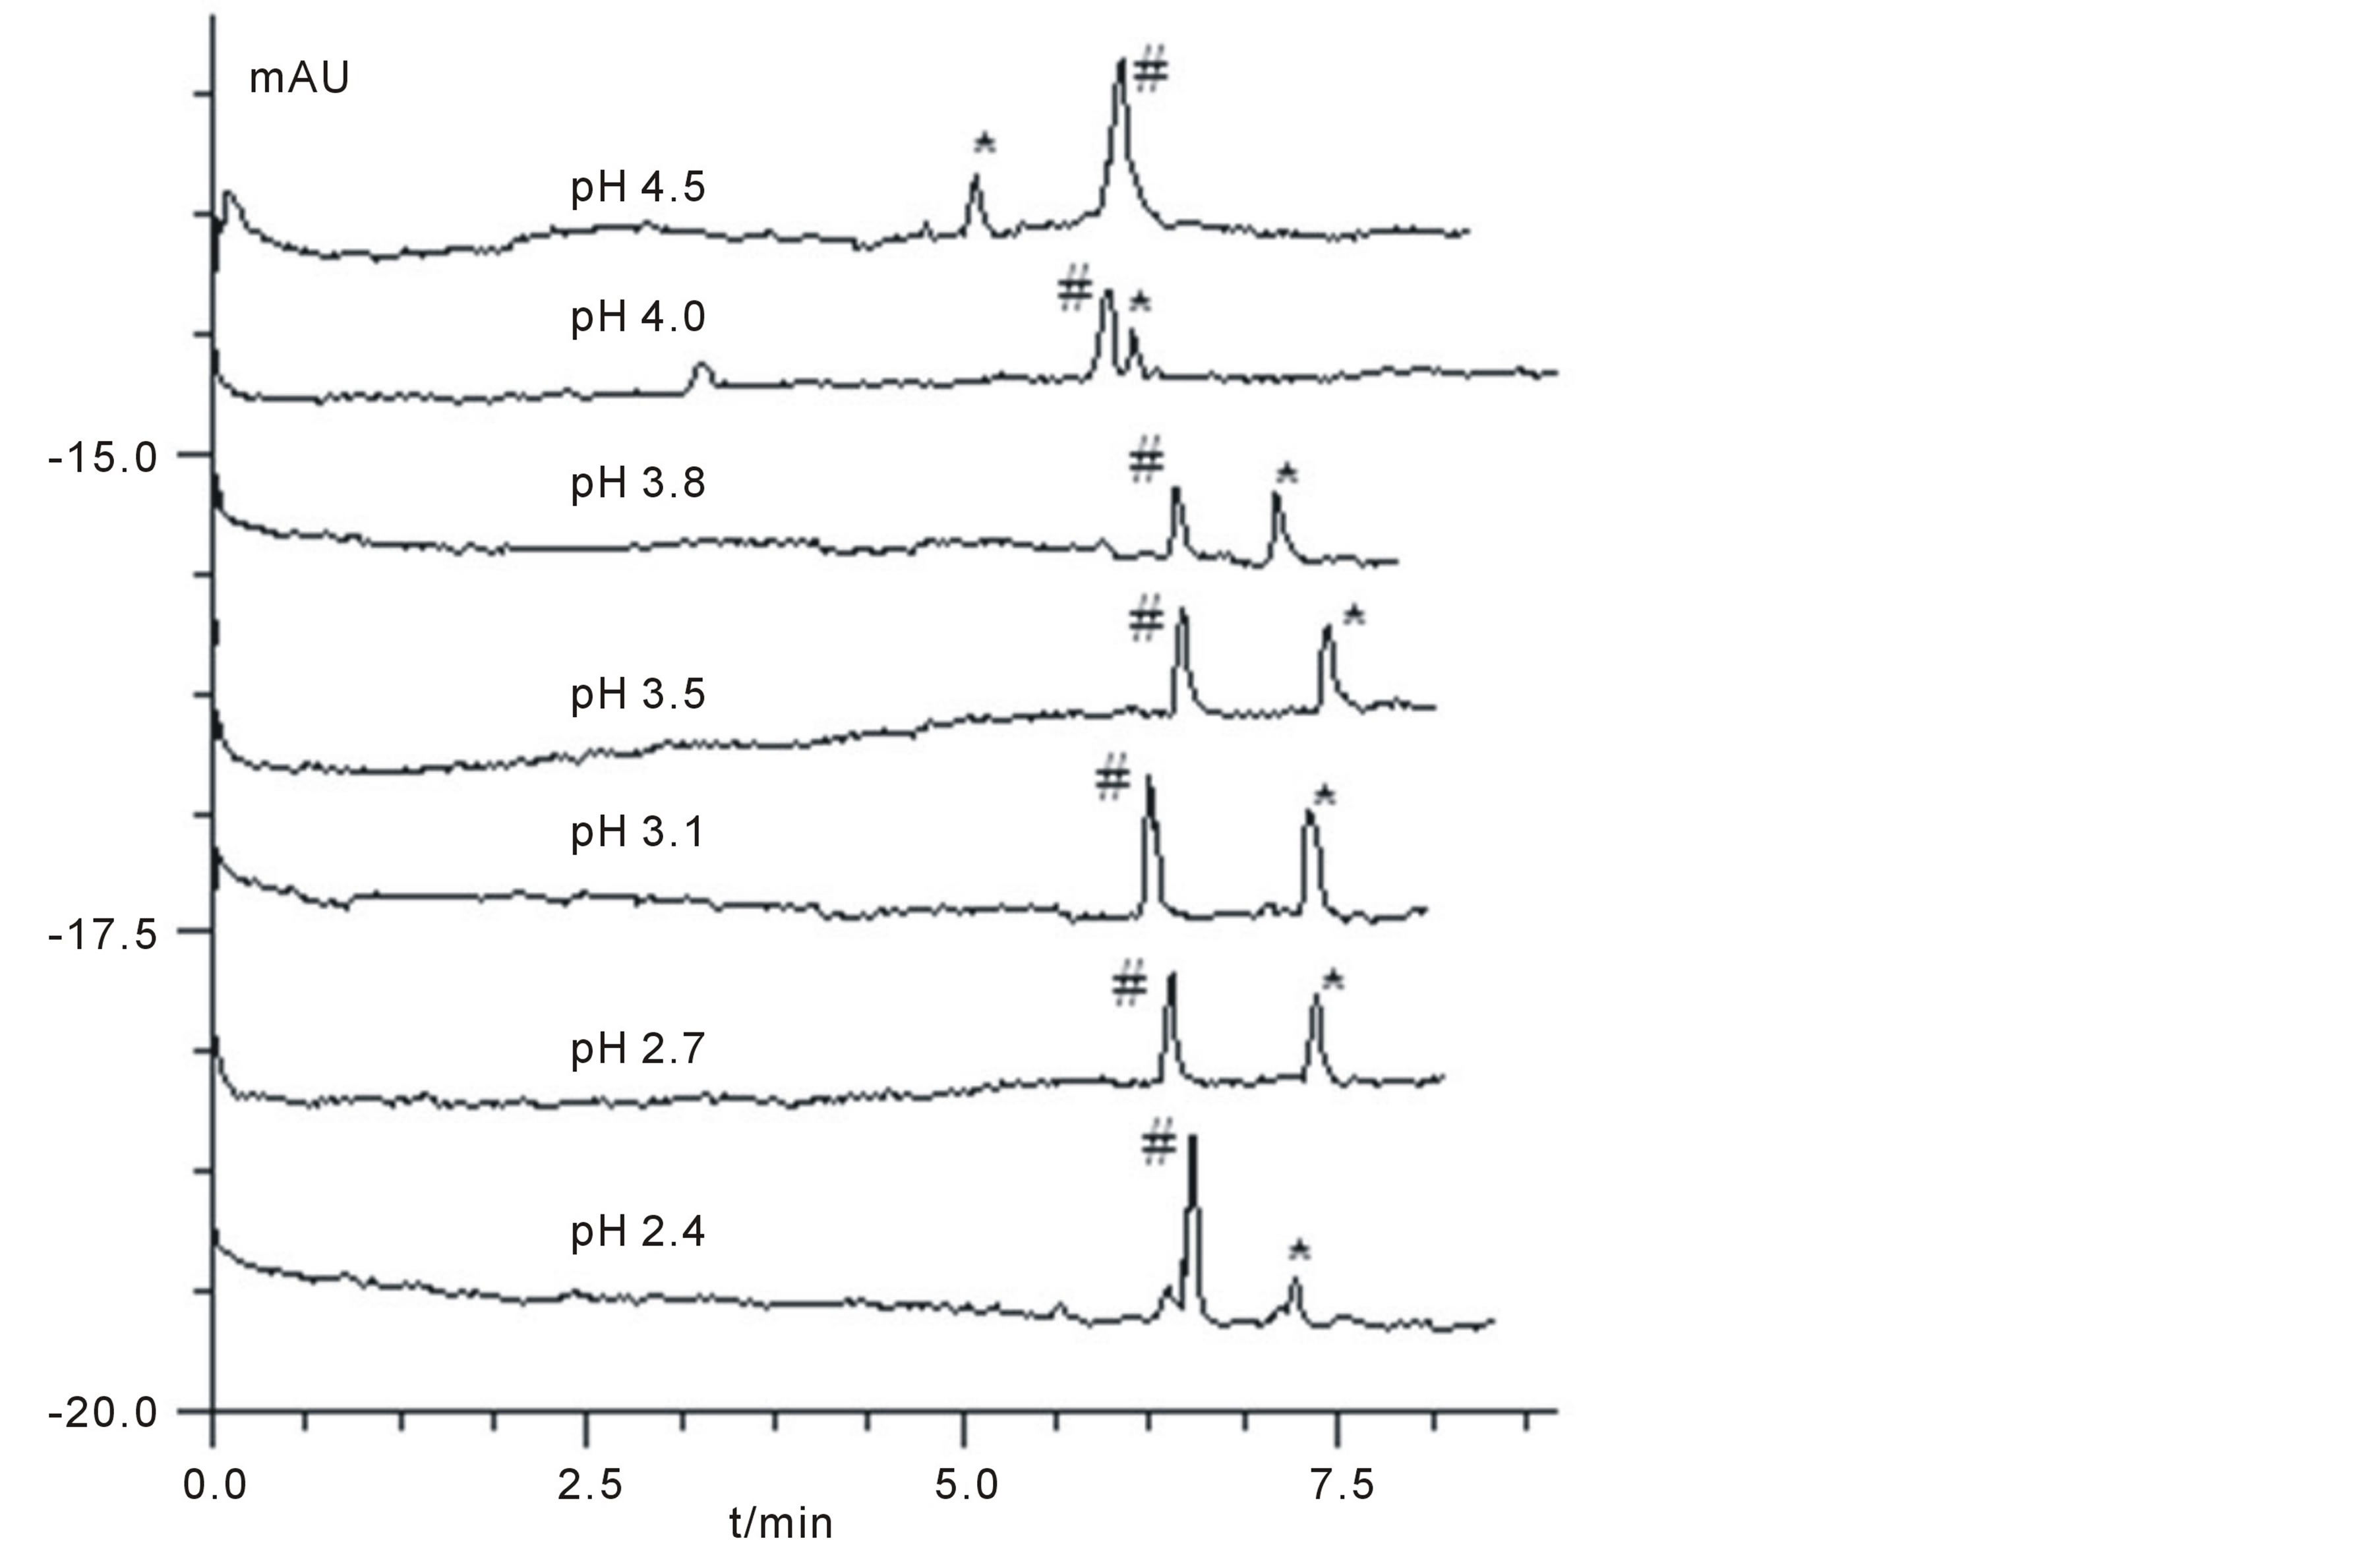
Figure 3. Electropherograms of MEL-spiked sample at different pH. Condition: The CE procedures were performed under different pH values. Other conditions were similar to those of Figure 2. #: MEL, *: interferent.
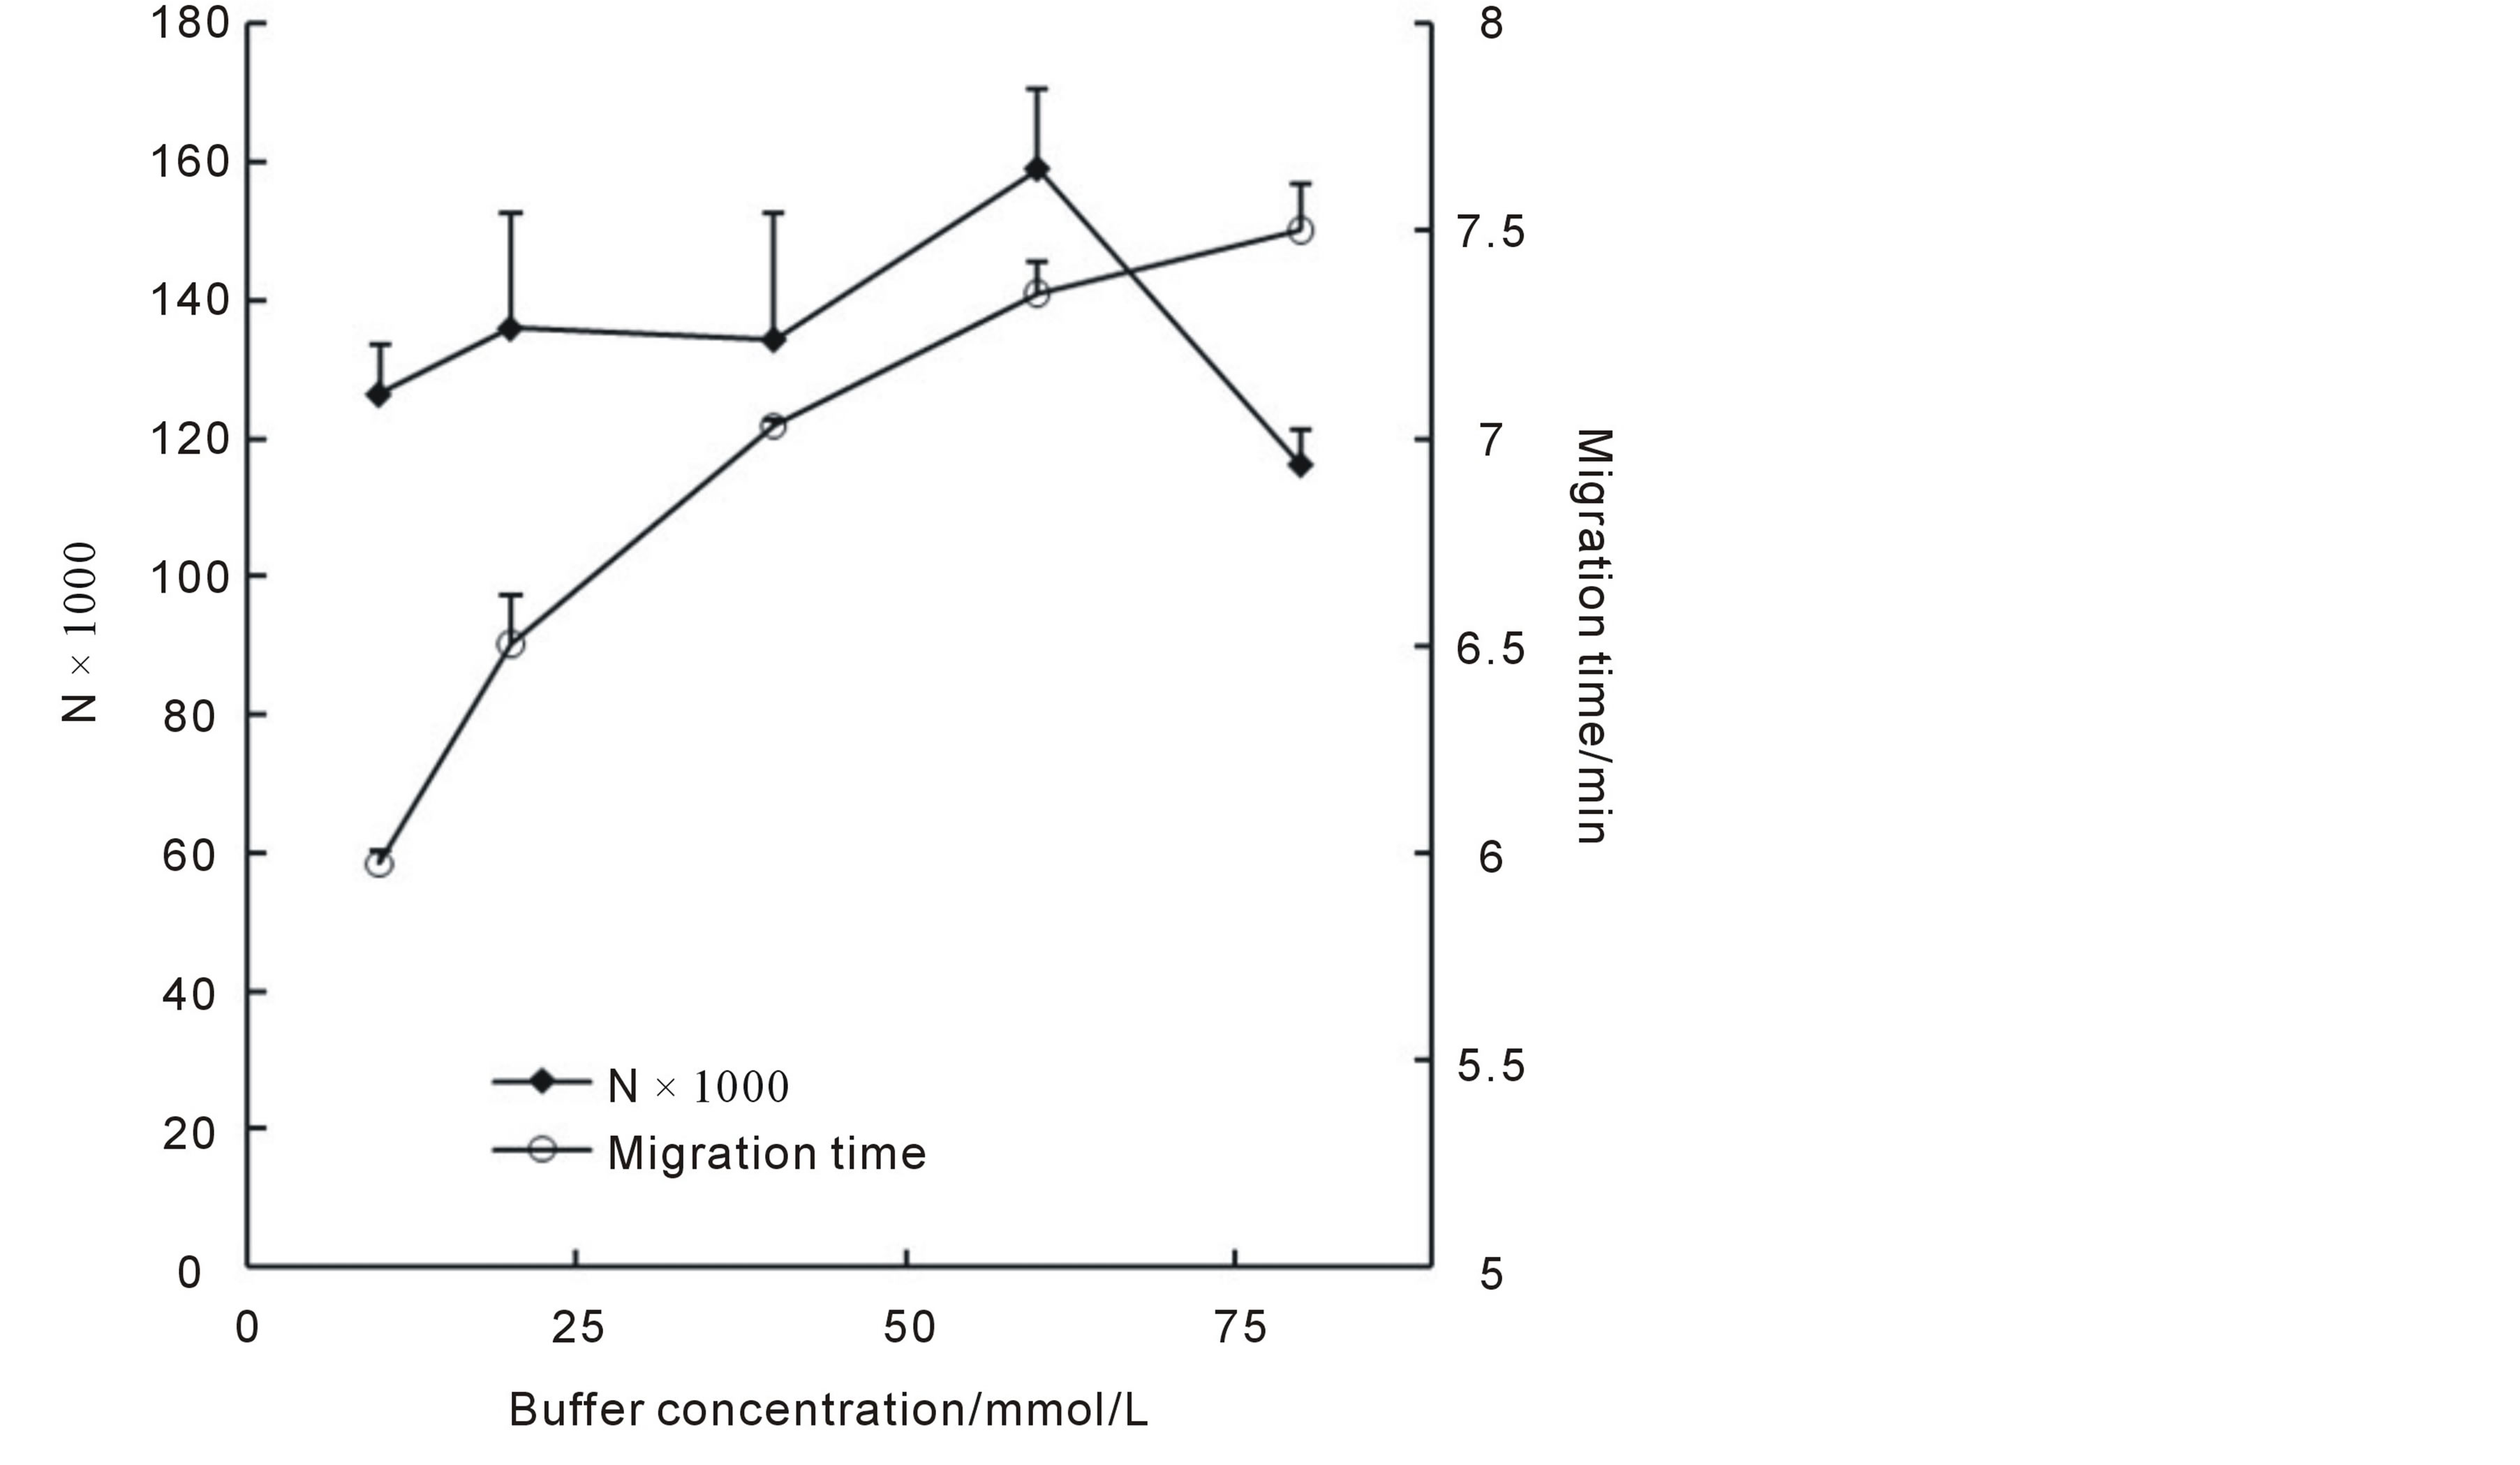
Figure 4. Influences of buffer concentrations on migration times and N values.
method (both migration time and peak area), six replicates of the samples were used. Recovery was tested according to section 2.3 at a concentration level of 1.6 μmol/L. Limit of detection (LOD) was calculated at S/N
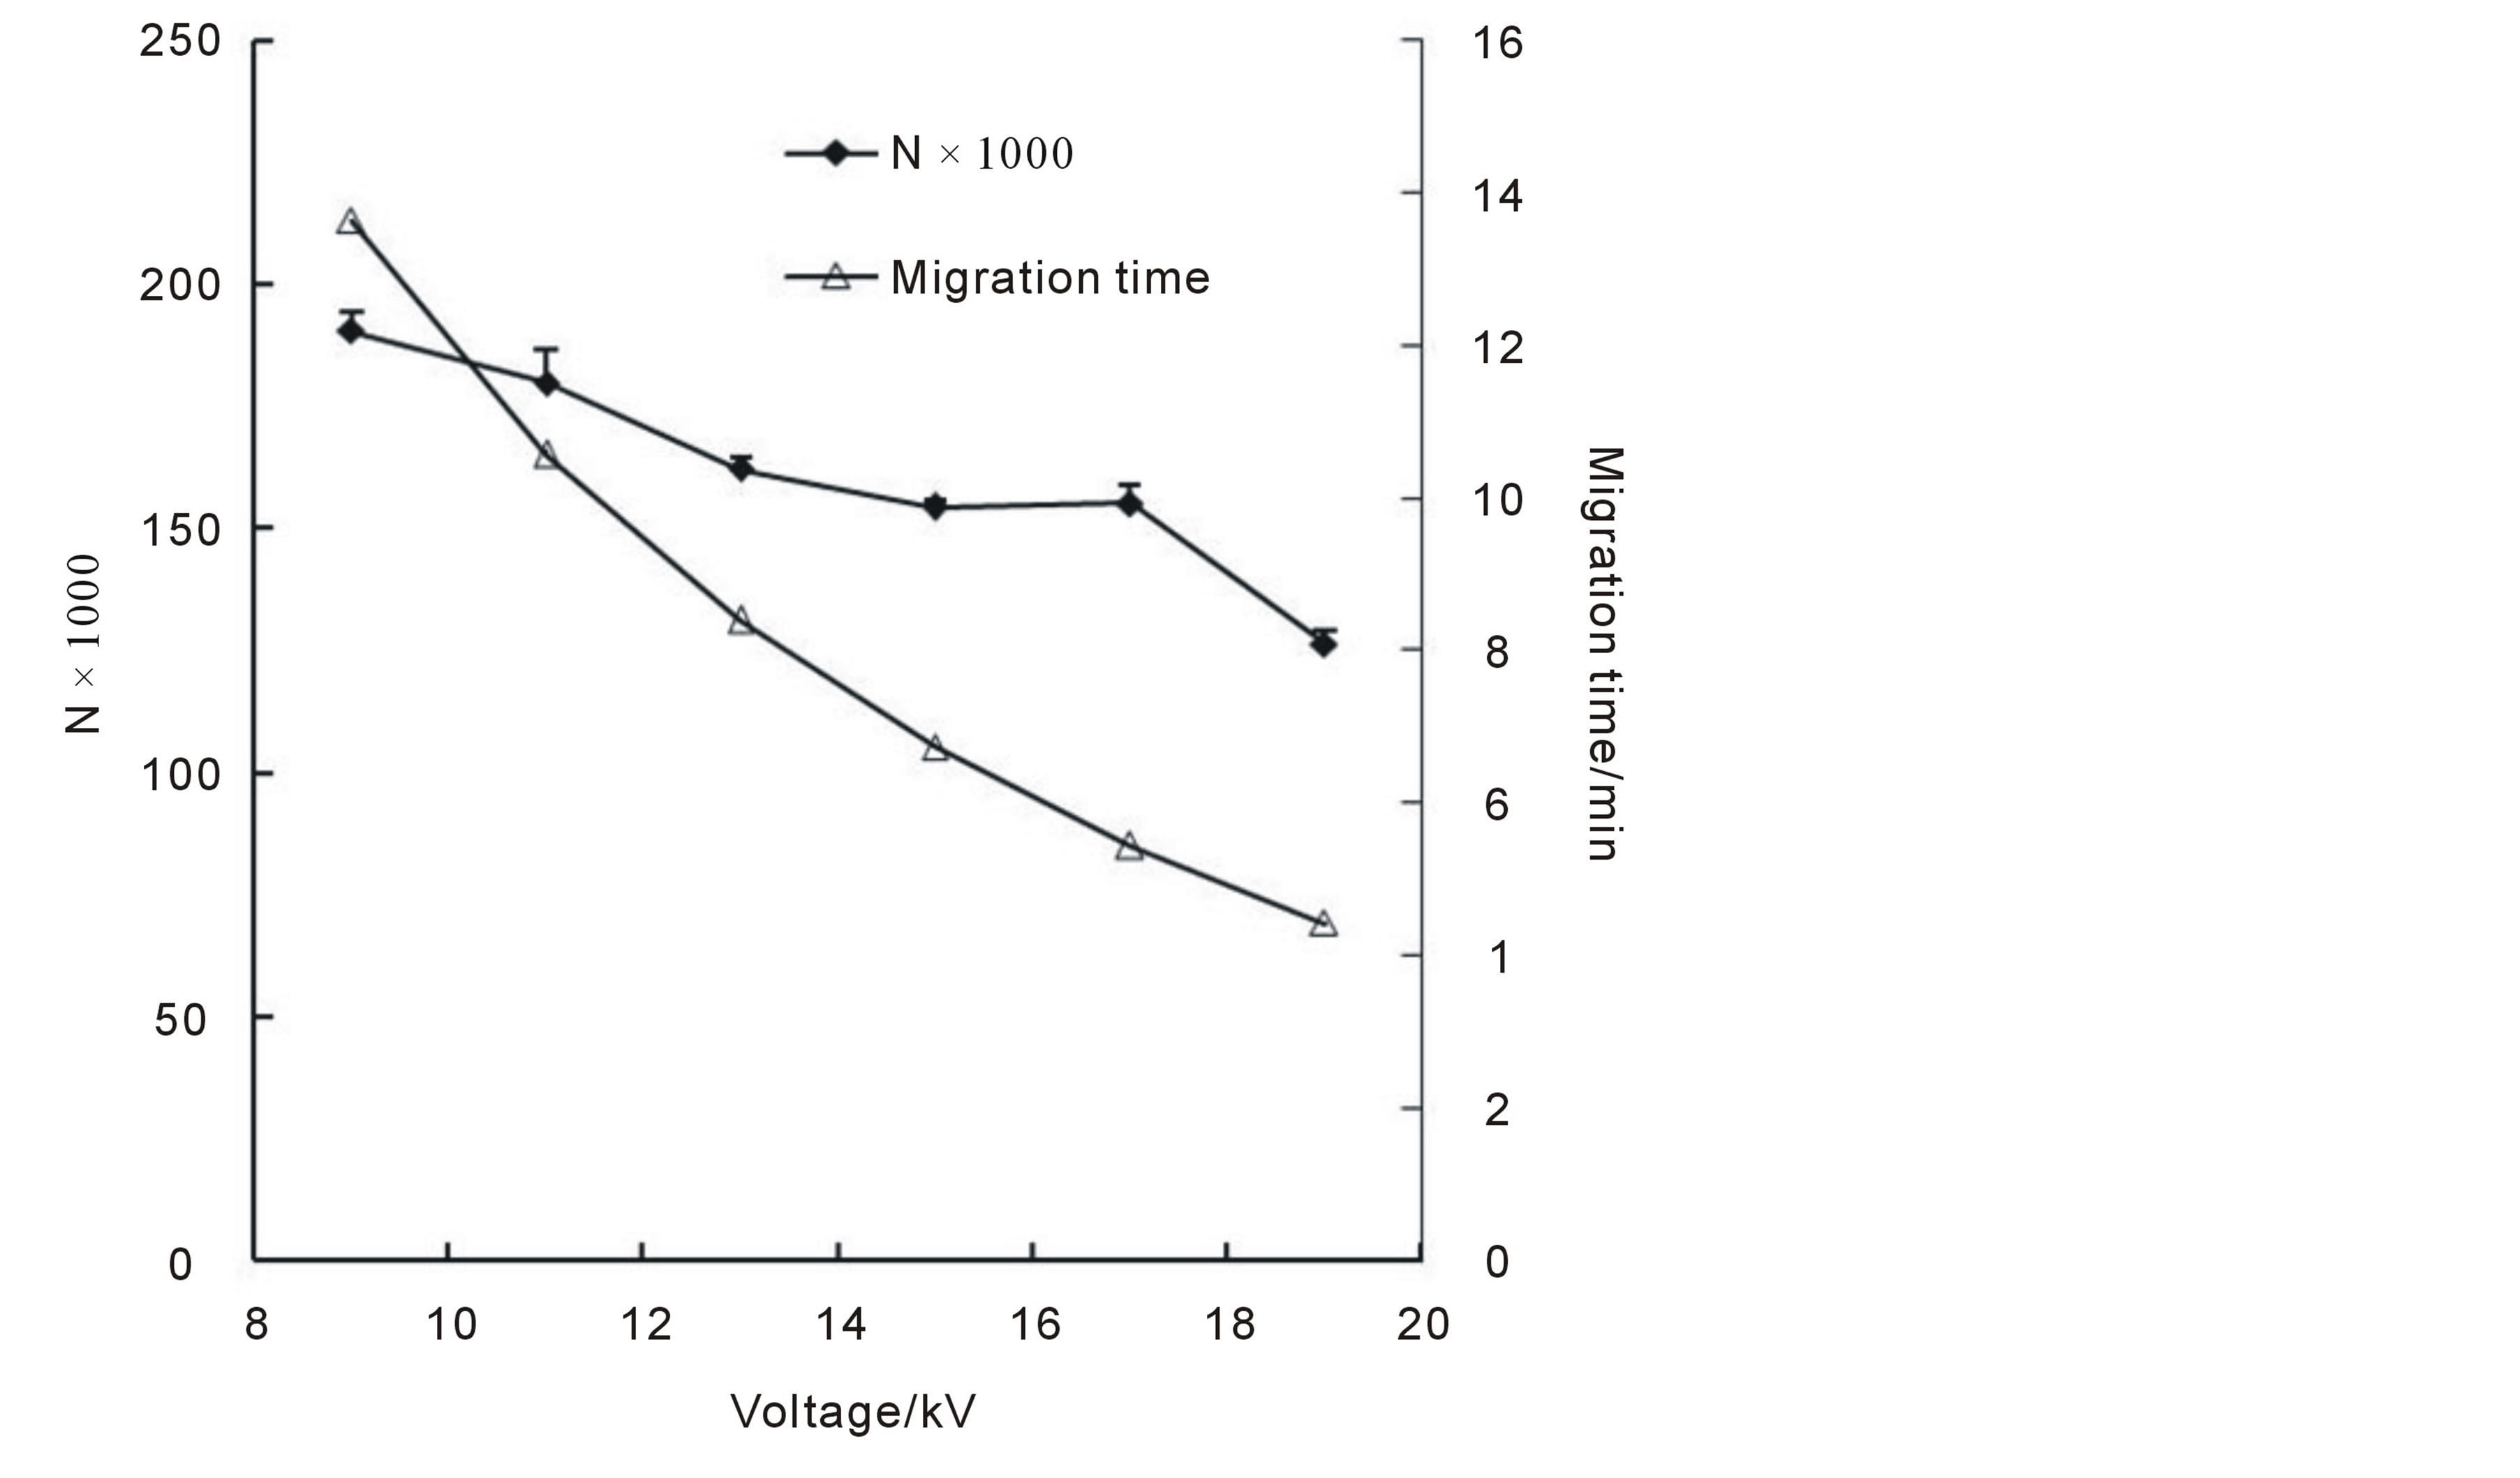
Figure 5. Influences of separation voltages on N values and migration times.

Table 1. Characters of the method.
= 3. All the data related were shown in Table 1. All these data indicated that the proposed method had good linearity range, reproducibility and lower LOD.
5. Separation Results and Application
Based on the selection of several parameters mentioned above, the optimized separation could be achieved in a 75 μm I.D. × 40 cm fused-silica capillary, using 60 mmol/L pH3.1 phosphate buffer as separation buffer, with a separation voltage of 17 kV, at 20˚C and a detecting wavelength of 200 nm. Under this condition, MEL could be easily baseline separated within 8 min (Electropherogram of the MEL standard was shown in Figure 6(E)). Figures 6(A)-(D) showed the electropherograms of milk product and quail egg with (final concentration was ~2.0 μmol/L)/without adding MEL. It could be seen that MEL could be well detected and separated from the interferent peak using the established method and that the method has potential to be applicable for similar food samples.
6. Conclusion
A CZE method for separation and determination of melamine in quail egg and milk was proposed. Under the optimum conditions, a low concentration of 0.5 μmol/L melamine in real sample can be successfully determined. The established method also had good reproducibility (RSD% for migration time and peak area was both less than 3.2%) and wider linearity (0.5 -10.0 μmol/L, R2 = 0.9907) which indicated that it’s potential to be suitable for routine assay of related foods.
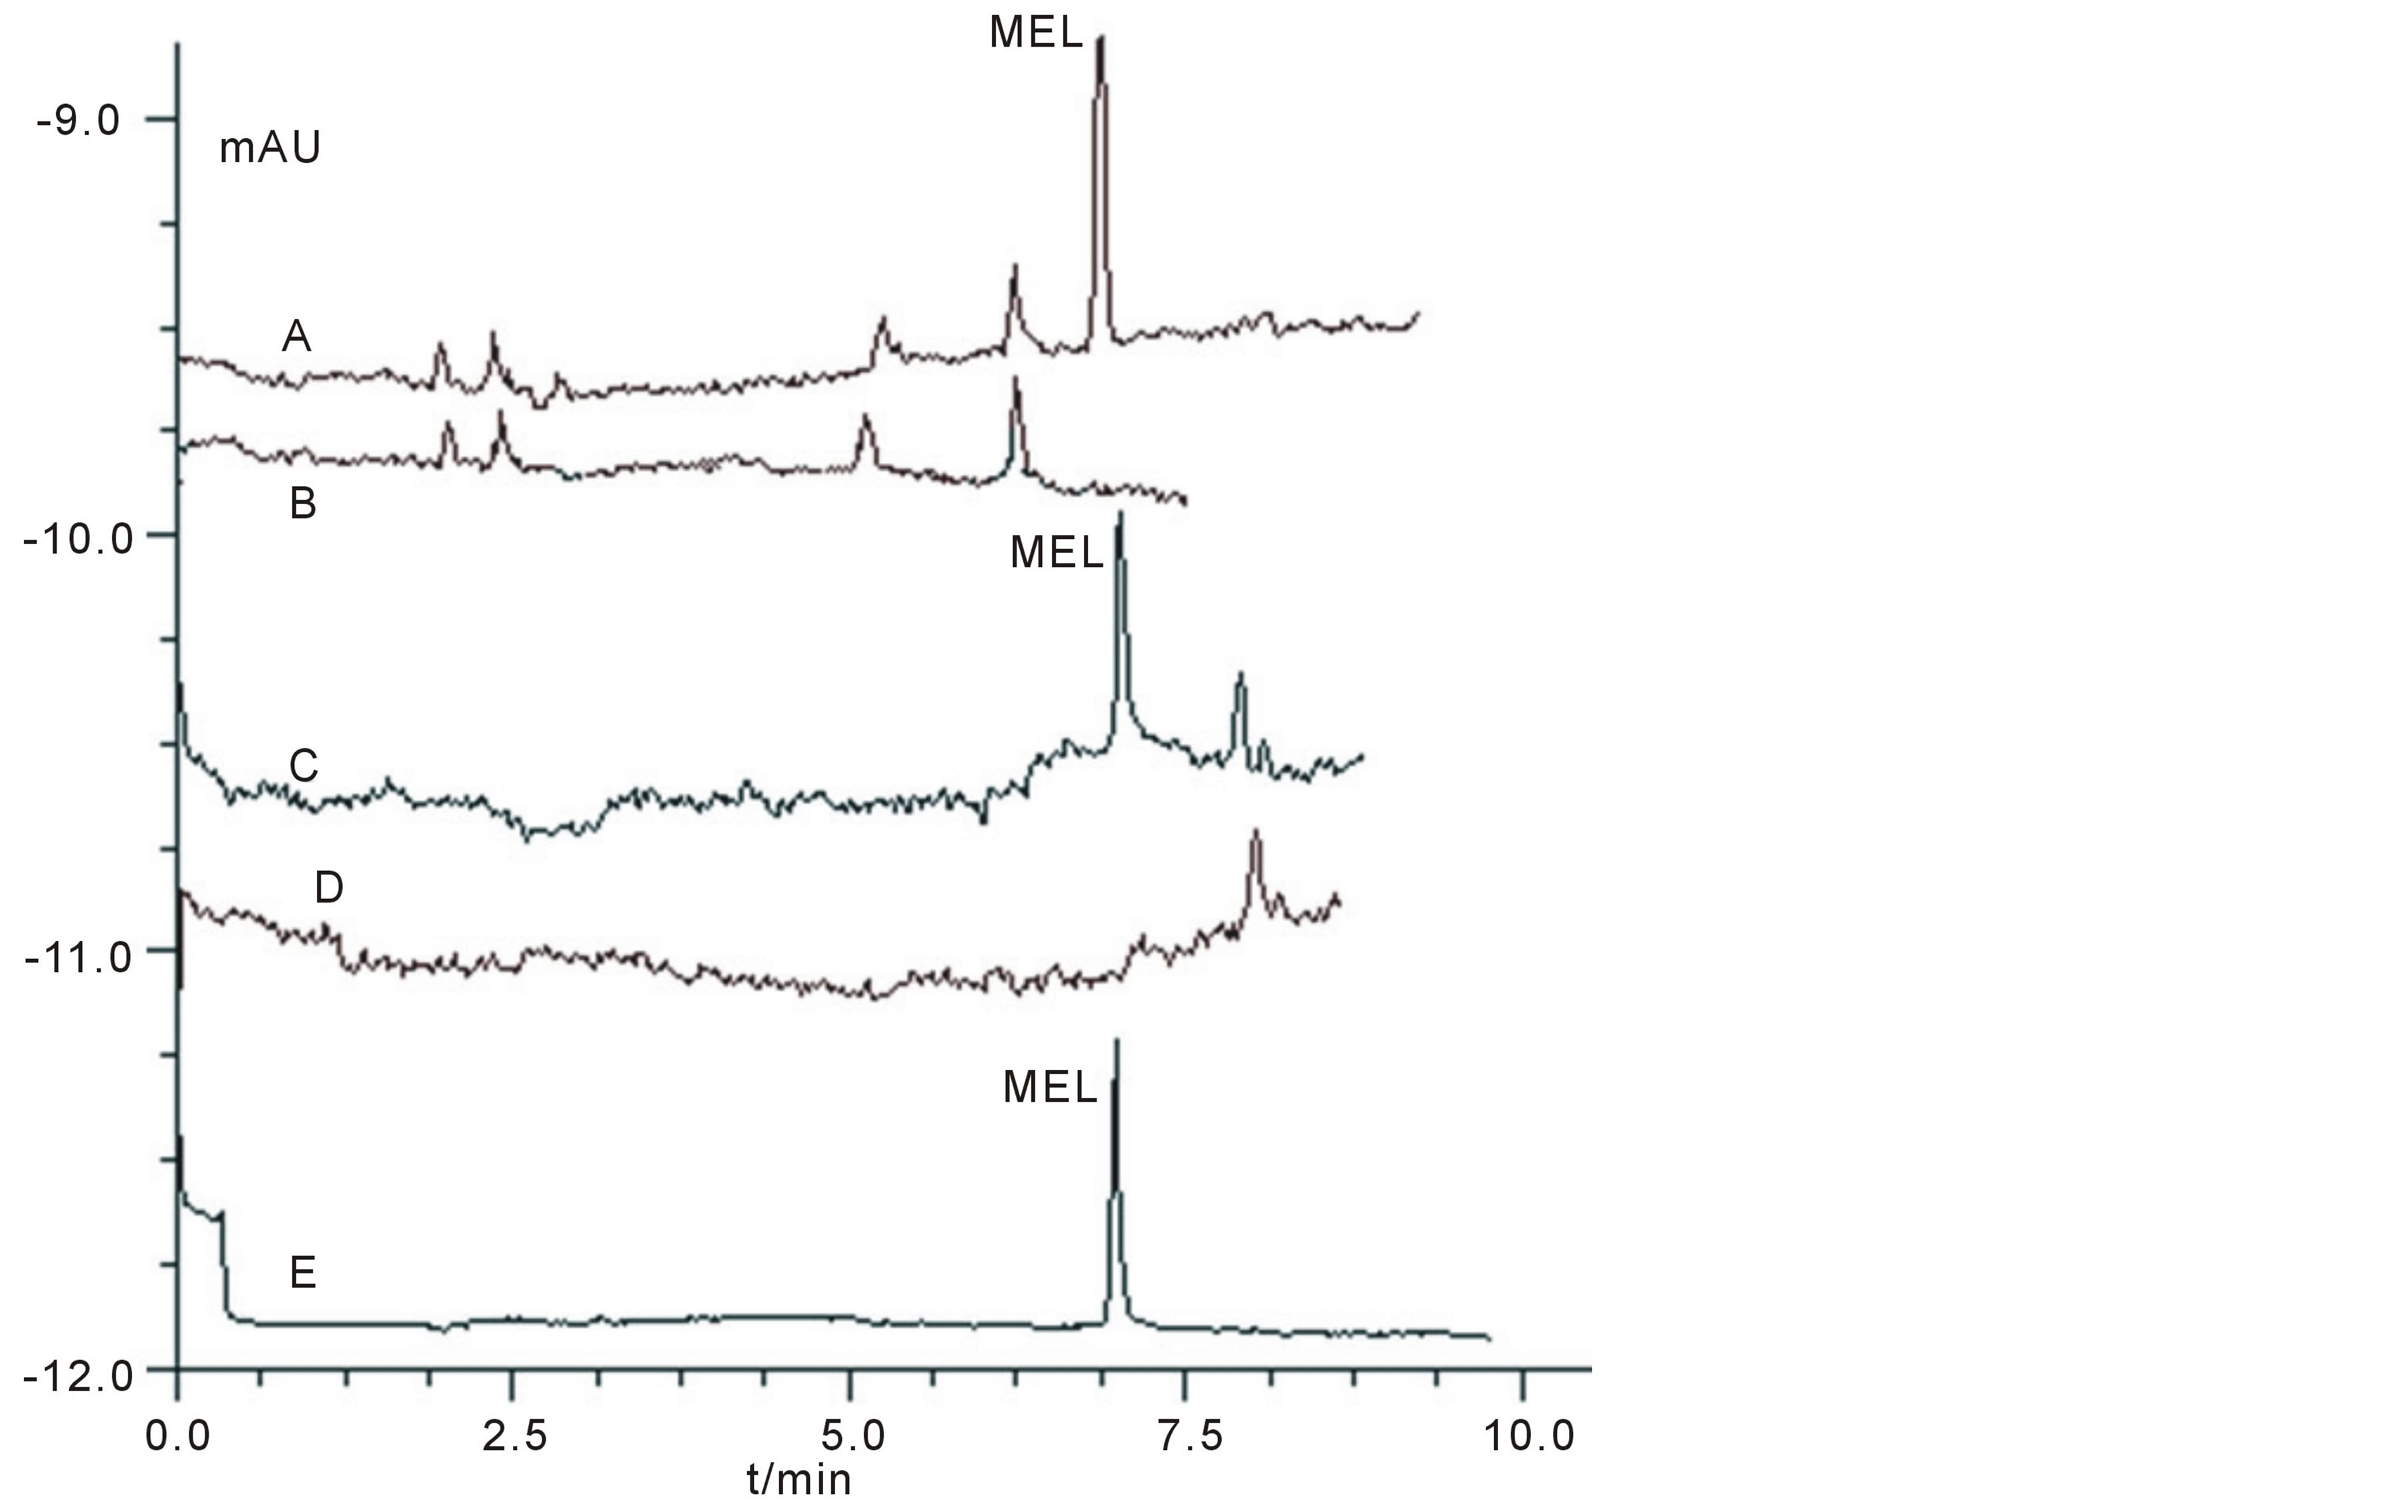
Figure 6. Electropherograms of standard and real samples under optimized condition stated in section 5. Condition: A: pure milk sample with adding MEL at a final concentration of 2.0 μmol/L; B: real milk sample without adding MEL; C: real quail eggs sample with adding MEL at a final concentration of 2.0 μmol/L; D: real quail egg sample without adding MEL; E: standard MEL sample.
Acknowledgements
This study is supported by the Fundamental Research Funds for the Central Universities (2011jdhz43), grant from Xian Jiao Tong University (xjj2009097), National college student innovation experimental program in CHINA (012008120015, 2011028). National Natural Science Funds of CHINA (Grant No: 81101674).
References
- Rovner, S.L. (2008) Chinese Baby-Food Crisis Widens. http://pubs.acs.org/cen/news/86/i38/8638news7.html
- Brown, C.A., Poppenga, R.H., Puschner, B., Miller, D.M., Ellis, A.E., Kang, K.I., Sum, S., Cistola, A.M. and Brown, S.A. (2007) Outbreaks of Renal Failure Associated with Melamine and Cyanuric Acid in Dogs and Cats in 2004 and 2007. Journal of Veterinary Diagnostic Investigation, 19, 525-531. http://dx.doi.org/10.1177/104063870701900510
- Dobson, R.L.M., Quijano, M., Cambron, R.T., Baker, T.R., Pullen, A.M., Regg, B.T., Bigalow-Kern, A.S., Vennard, T., Fix, A., Reimschuessel, R., Overmann, G., Shan, Y. and Daston, G.P. (2008) Identification and Characterization of Toxicity of Contaminants in Pet Food Leading to an Outbreak of Renal Toxicity in Cats and Dogs. Toxicological Sciences, 106, 251-262. http://dx.doi.org/10.1093/toxsci/kfn160
- Goscinny, S., Hanot, V., Halbardier, J.F., Michelet, J.Y. and Van Loco, J. (2011) Rapid Analysis of Melamine Residue in Milk, Milk Products, Bakery Goods and Flour by Ultra-Performance Liquid Chromatography/Tandem Mass Spectrometry: From Food Crisis to Accreditation. Food Control, 22, 226-230. http://dx.doi.org/10.1016/j.foodcont.2010.04.032
- Karbiwnyk, C.M., Turnipseed, S.B., Storey, J.M., Madson, M.R., Miller, K.E., Gieseker, C.M., Miller, R.A., Rummel, N.G. and Reimschuessel, R. (2009) Determination of Cyanuric Acid Residues in Catfish, Trout, Tilapia, Salmon and Shrimp by Liquid Chromatography-Tandem Mass Spectrometry. Analytica Chimica Acta, 637, 201-211.
- Andersen, W.C., Karbiwnyk, C.M., Clark, S.B., Madson, M.R., Gieseker, C.M., Miller, R.A., Rummel, N.G. and Reimschuessel, R. (2008) Determination and Confirmation of Melamine Residues in Catfish, Trout, Tilapia, Salmon, and Shrimp by Liquid Chromatography with Tandem Mass Spectrometry. Journal of Agricultural and Food Chemistry, 56, 4340-4307. http://dx.doi.org/10.1021/jf800295z
- Litzau, J.J. and Mulligan, K.J. (2007) GC-MS Screen for the Presence of Melamine, Ammeline, Ammelide and Cyanuric Acid. http://www.fda.gov/cvm/GCMSMelamine.htm
- Wang, Z.Y., Zhang, L.Y., Yang, W.J., Gong, L.M., He, P.L. and Li, Z. (2010) Screening and Determination of Melamine Residues in Tissue and Body Fluid Samples. Analytica Chimica Acta, 662, 69-75. http://dx.doi.org/10.1016/j.aca.2010.01.004
- Vallejo-Cordoba, B. and González-Córdova, A.F. (2010) Capillary Electrophoresis for the Analysis of Contaminants in Emerging Food Safety Issues and Food Traceability. Electrophoresis, 31, 2154-2164. http://dx.doi.org/10.1002/elps.200900777
- Tsai, I.-L., Liao, H.-W., Lin, S.-C. and Kuo, C.-H. (2009) Rapid Analysis of Melamine in Infant Formula by Sweeping-Micellar Electrokinetic Chromatography. Journal of Chromatography A, 1216, 8296-8303. http://dx.doi.org/10.1016/j.chroma.2009.06.008
- Klampfl, C.W., Haunschmidt, M., Himmelsbach, M. and Buchberger, W. (2009) Analysis of Melamine in Milk Powder by CZE Using UV Detection and Hyphenation with ESI Quadrupole/TOF MS Detection. Electrophoresis, 30, 1743- 1746. http://dx.doi.org/10.1002/elps.200800786
- Yan, N., Zhu, Z.F. and Chen, X.G. (2009) Determination of Melamine in Dairy Products, Fish Feed, and Fish by Capillary Zone Electrophoresis with Diode Array Detection. Journal of Agricultural and Food Chemistry, 57, 807-811. http://dx.doi.org/10.1021/jf803429e
- Wang, J.Y., Chu, Q.C. and Ye, J.N. (2010) Residue Analysis of Melamine in Milk Products by Micellar Electrokinetic Capillary Chromatography with Amperometric Detection. Food Chemistry, 121, 215-219. http://dx.doi.org/10.1016/j.foodchem.2009.11.074
- Ono, S., Inoue, Y., Munechika, T., Yoshimura, T., Morita, H., Rengakuji, S.-I. and Shimasaki, C. (1998) Determination of Melamine Derivatives, Melame, Meleme, Ammeline and Ammelide by High-Performance Cation-Exchange Chromatography. Journal of Chromatography A, 815, 197-214. http://dx.doi.org/10.1016/S0021-9673(98)00441-5