American Journal of Analytical Chemistry
Vol.3 No.12(2012), Article ID:25667,8 pages DOI:10.4236/ajac.2012.312109
Quantitative Determination of Fluoxetine in Pharmaceuticals and Plasma Samples Using Bromatometric Method
Institute of Chemical Sciences, University of Peshawar, Peshawar, Pakistan
Email: *jasminshah2001@yahoo.com
Received October 25, 2012; revised November 26, 2012; accepted December 3, 2012
Keywords: Fluoxetine; Bromatometric Method; Methyl Orange; Spectrophotometry
ABSTRACT
Asensitive and simple spectrophotometric method has been developed for quantitative determination of fluoxetine using bromatometric method. The method is based on the addition of measured excess amount of bromate-bromide mixture to fluoxetine in hydrochloric acid medium. The residual bromine was determined by reacting with a fixed amount ofmethyl orange and absorbance was measured at 505 nm. The amount of bromine reacted corresponds to the amount of fluoxetine. Linear relationship between absorbance and fluoxetine concentration was found and Beer’s law was obeyed in the concentration range of 0.4 - 12 µg·mL–1. The molar absorptivity was found to be 3.8 × 10⁴ L·mol–1·cm–1. The limit of detection and limit of quantification was calculated and found to be 0.32 µg·mL–1 and 1.0 µg·mL–1 respectively. The common excipients were investigated for their interferences effect in the assay. The validity of the developed method was checked through recoveries studies and successfully applied to the determination of fluoxetine in bulk powder, pharmaceutical formulations and spiked human plasma samples. The percent recoveries were found to be in the range of 97.0% - 101.0% for pharmaceutical formulations and from 97.0% - 99.0% for spiked human plasma.
1. Introduction
Fluoxetine hydrochloride, (±)-N-methyl-3-Phenyl-3-[(α, α,α-trifluoro-p-tolyl)] propylamine hydrochloride (Figure 1), is an antidepressant drug used for the handling of unipolar mental depression. Fluoxetine (FLX) is the most widely prescribed selective serotonin reuptake inhibitor antidepressant drug [1]. FXT has been shown to have comparable efficacy to tricyclic antidepressants but with fewer cardiovascular and anticholinergic side effects [2,3]. It is also effective in treatment of the obsessive compulsive disorders [4]. Fluoxetine is extensively metabolized by N-demethylation in liver into its active metabolite norfluoxetine [5]. It is well absorbed after oral administration, and it takes 6 - 8 hours to reach the plasma peak.
Since FXT is a compound of great pharmacological and analytical importance there has been an interest to develop accurate analytical method for the quantification of FXT in biological and pharmaceutical samples. Several instrumental methods developed for the determination of fluoxetine in pharmaceutical formulation include titrimetric [6], nuclear magnetic resonance spectrometric
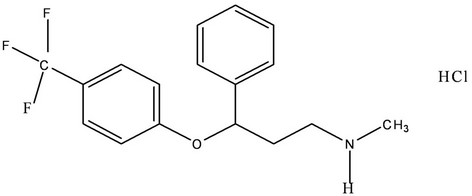
Figure 1. Chemical structure of fluoxetine.
[7], potentiometric [8], and thin-layer chromatographic [9]. Similarly several other methods for fluoxetine determination in biological fluids have been reported in the literature. These methods include liquid chromatography with different detection system [10-14], gas chromatography [15-17], and capillary electrophoresis [18,19]. Unfortunately, these methods are time consuming and require complicated analytical procedures, particularly due to the laborious pretreatment of plasma sample and also not chemically precise.
Comparatively limited number of spectrophotometric methods has been described in the literature for determination of fluoxetine in pharmaceutical formulations and biological samples. These methods require lengthy procedures, exploit expensive reagents, possess narrow linear ranges and suffer from limitation of application to biological samples [20-23].
The aim of the present work was to develop simple, sensitive and economical spectrophotometric method for the quantitative determination of fluoxetine in pharmaceutical formulations and biological samples. The method is based on bromine-generated in situ as the brominating agent and methyl orange as the spectrophotometric reagent.
2. Experimental
2.1. Instrument
UV/Vis spectrophotometer Sp-3000 plus Optima (Tokyo, Japan) with 1 cm matched quartz cells was used for all absorbance measurements.
2.2. Materials and Reagents
All reagents used were of analytical grade purity or of high grade purity. Potassium bromide, potassium bromide, hydrochloric acid, methanol (Merck KGaA 64271 Darmstadt, Germany) and methyl orang (BDH Laboratory Supplies Poole, England) were used in this work. Standard reference fluoxetine was provided by Libra Pharmaceutical Industry pvt. Ltd., Peshawar, Pakistan. Commercial formulations of fluoxetine (Dopex capsules 20 mg, manufactured by Merck (Pvt) Ltd, Quetta, Pakistan), Flux capsules 20 mg (manufactured by Hilton Pharma (pvt) Ltd, Karachi, Pakistan), Depricap capsules 20 mg (manufactured by Pharma Nabi Qasim industries (Pvt) Ltd, Karachi Pakistan were purchased from local market.
2.3. Preparation of Reagents Solutions
The bromate-bromide mixture (3.0 mM KBrO3 - 30 mM KBr) was prepared by dissolving 0.025 g of KBrO3 and 0.1785 g of KBr in distilled water and diluting to 50 mL with the same solvent. The solution was diluted to obtain 0.11 mM solutions with respect to KBrO3 for further use. Methyl orange solution (300 µg·mL−1) was prepared by dissolving 0.03 g of methyl orange dye and diluted to 100 mL with distilled water. Hydrochloric acid solution (5.0 M) was prepared by diluting 20.8 mL of 36% hydrochloric acid to 50 mL with distilled water.
2.4. Preparation of Standard Fluoxetine Solution (1000 µg·mL−1)
Standard stock solution of fluoxetine (1000 µg·mL–1) was prepared by dissolving 0.05 g of authentic standard in 0.5 mL methanol and diluted to 50 mL with distilled water. Working standard solutions were freshly prepared by diluting proper volume of the stock solution.
2.5. General Recommended Procedure
Bromate-bromide mixture of 1.0 mL (0.089 mM with respect to KBrO3) was taken in a set of 25 mL calibrated flasks. Then 1.0 mL of 4 M HCl solution was added. Fluoxetine standard solution in the range of 1 - 5 µg·mL−1 was added to each flask. The contents of the flasks were mixed thoroughly and allowed to stand for 20 minutes with occasional shaking. After equilibration, 1.0 mL of methyl orange solutions (300 µg·mL−1) was added to each flask and diluted to the mark with distilled water. The absorbance of all solutions was measured at 505 nm (Figure 2) using Optima SP-3000 Spectrophotometer against a reagent blank prepared by the same method except addition of drug.
2.6. Application to Pharmaceutical Formulations
Contents of 5 capsules and tablets containing 20 mg of active ingredient were mixed, weighted and average mass of the powder in one capsule was calculated. An accurately weighed amount of the powder equivalent to 0.01 g of fluoxetine was dissolved in 0.5 mL methanol and diluted with distilled water. The solution was filtered to separate any suspended particles and finally the volume of filtrate was adjusted to 100 mL with distilled water. Sample solution (10 µg·mL−1) was prepared from stock sample solution by dilution of the required volume with distilled water and treated according to the general recommended procedure.
2.7. Application to Spiked Human Plasma Sample
In a set of 15 mL centrifugation tubes; 3 mL aliquots of plasma was taken and 2.5 mL of 100 µg·mL−1 of fluoxetine solution was added. It was then deproteinized by mixing with 9 mL of acetonitrile and centrifuged for 5 min at a rate of 3000 rpm. The supernatant was transferred to 50 mL volumetric flask and diluted to the mark
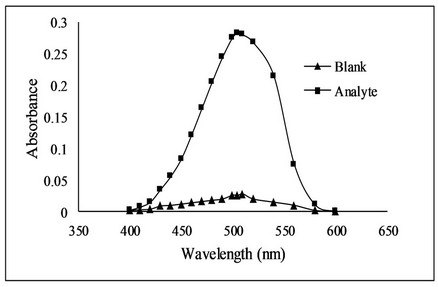
Figure 2. Absorption spectra of fluoxetine using bromatometric method.
with distilled water. Different volumes from deproteinized solution were analyzed according to the general recommended procedure.
3. Results and Discussion
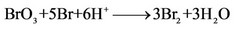
The present method deals with the spectrophotometric determination of fluoxetine using bromate-bromide mixture as the oxidimetric reagent. The proposed spectrophotometric method is based on the determination of unreacted bromine (in situ generated) after bromination reaction of fluoxetine in acidic media with a measured excess amount of bromate-bromide mixture via electrophilic substitution reaction. The excess bromine was determined by reacting it with a known amount of methyl orange dye. The method based on bleaching action of bromine on methyl orange due to the oxidative destructtion of methyl orange (Scheme 1).
Bromine was generated in situ using a mixture of potassium bromide and potassium bromate in acidic media (5 M HCl). Fluoxetine when added to a constant amount of in situ generated bromine, the bromine consumed proportionately with increase in concentration of fluoxetine and a concomitant fall in the amount of bromine occurred. When a fixed amount of methyl orange was added to the decreasing amounts of bromine resulted in a simultaneous increase in the methyl orange concentration. Consequently, a proportional increase in the absorbance at the respective λmax was observed with increasing concentration of fluoxetine, as shown by the correlation coefficients of 0.9956.
3.1. Effect of Reagents Concentration
The concentrations and volume of different reagents affecting the bromination reactions were carefully studied and optimized. The effect of concentration of bromate solution in the presence of excess of bromide was studied in the range of 0.029 mM to 0.179 mM. It was observed that absorbance increases with increase in concentration up to 0.089 mM of bromate (Figure 3). The effect of volume of bromate solution (0.089 mM) in the presence of excess of bromide was also investigated and found that maximum absorbance was obtained when 1.0 mL of 0.089 mM bromate solution was used.
For acidity of solution, different mineral acids like hydrochloric acid, nitric acid, perchloric acid and sulphuric acids were used. Among the acids, hydrochloric acid was found to be the suitable medium for bromination of fluoxetine by in situ generated bromine due to accurate and precise results. Effect of hydrochloric acid concentration was studied in the range of 1M to 6 M solution. The absorbance increases with increase in concentration of hydrochloric acid up to 4 M after which a slight decrease in absorbance was observed (Figure 4). The effect of volume of HCl was also studied and it was found that 1.0 mL of 4 M HCl give maximum absorbance.
Effect of methyl orange concentration was also investigated in the range of 200 - 450 µg·mL−1 and the absorbance increased with increase in concentration of methyl orange up to 300 µg·mL−1 after which it remain constant (Figure 5). The effect of volume of methyl orange was also investigated and it was observed that 1.0 mL of 300
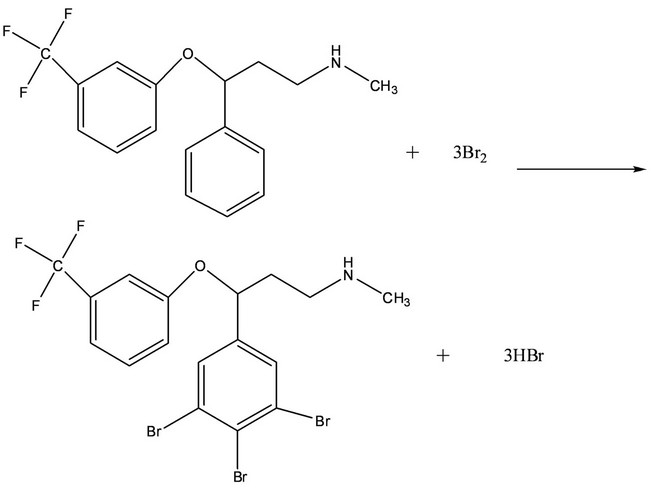
Scheme 1. Proposed reaction scheme for the reaction of fluoxetine with bromine.
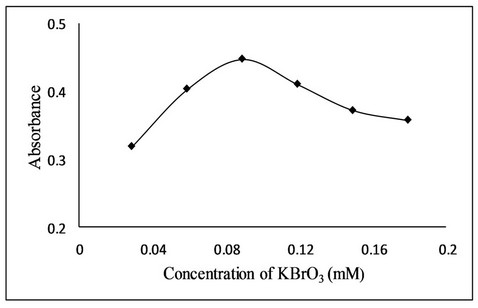
Figure 3. Effect of KBrO3 concentration on the bromination reaction.
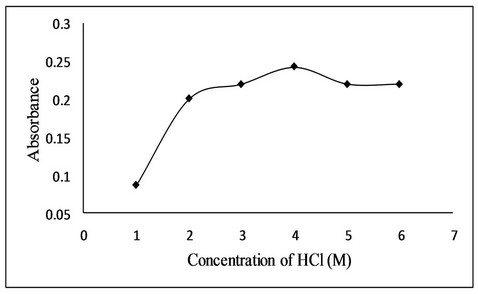
Figure 4. Effect of hydrochloric acid concentration on bromination reaction.
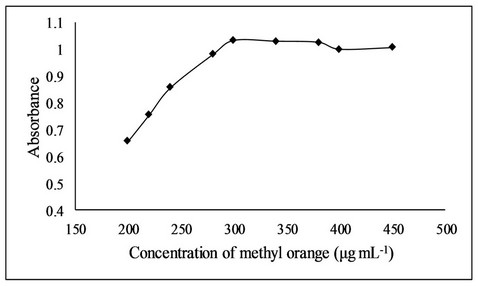
Figure 5. Effect of methyl orange concentration on bromination reaction.
µg·mL−1 methyl orange produced maximum absorbance.
3.2. Stability of the Reaction Product
The stability of the reaction product was studied by measuring the absorbance at regular interval up to 120 min (Figure 6). It was observed that no change in absorbance of the colored product was produced. Thus the colored product is stable and will not affect the results of analysis even if the absorbance is measured after 2 hours
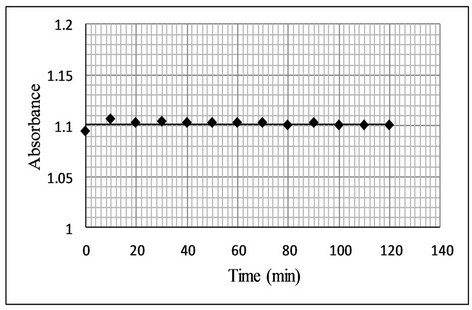
Figure 6. Effect of time on stability of bromination reaction.
of the dilution.
3.3. Effect of Interferences
To evaluate the selectivity of the developed method, the interferences effects of common excipients like starch, glucose, sucrose, talc, sorbitol, lactose, and magnesium stearate were tested for the determination of fluoxetine in pharmaceutical formulations. To a fixed amount of fluoxetine solution one of the excipients in ratio of 1:2, 1:4 and 1:8 were added and analyzed by the proposed method. No interferences were observed in the analysis of fluoxetine in the presence of these excipients. The percentage recoveries obtained were in the range of 97.11% to 103.84% (Table 1).
3.4. Method Validation
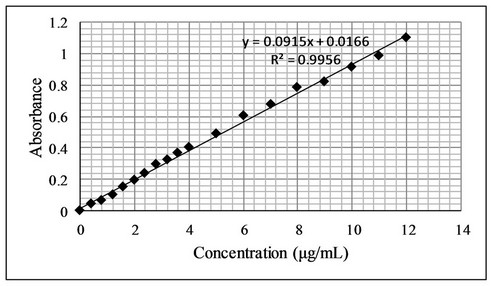
The proposed bromatometric method was validated according to the guidelines of ICH [24]. Under the optimum experimental conditions of the proposed method, a linear correlation was found between absorbance at λmax and fluoxetine concentration. Beer’s law was obeyed in the concentration range of 0.4 - 12 µg·mL−1 with a good correlation 0.9956 (Figure 7). The limit of detection (LOD) and limit of quantification (LOQ) values were found to be 0.32 µg·mL−1 and 1.0 µg·mL−1 respectively. The linear regression equations, correlation coefficients, intercepts, slope and molar absorptivity are given in Table 2.
3.5. Precision and Accuracy
The inter-day precision (repeatability) of the proposed method was checked by evaluating fluoxetine in pure form and pharmaceutical preparations at three different concentrations in triplicate with in the Beer’s law range at the same day. The results are summarized in Table 3 for pure form and Table 4 for dosage form. The percentage recoveries obtained in the range of 99.5% to 100.0% for pure form and 96.3% to 101.0% for dosage
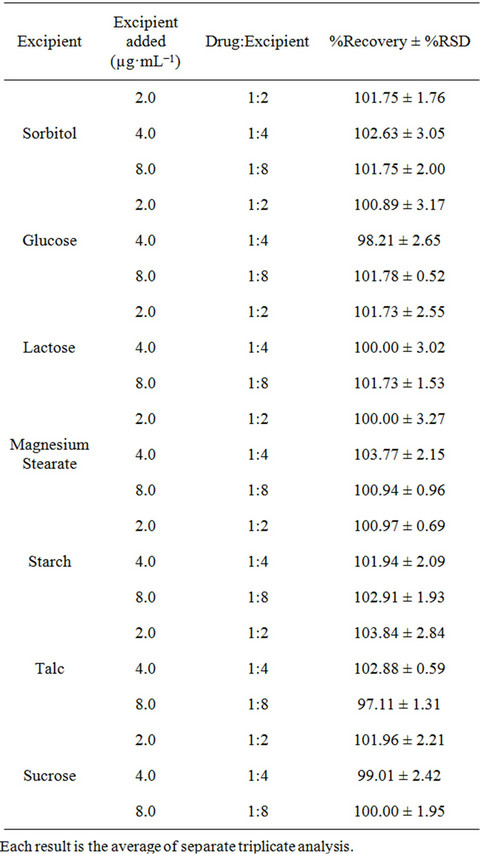
Table 1. Determination of fluoxetine (1.0 µg·mL−1) in the presence of excipients.
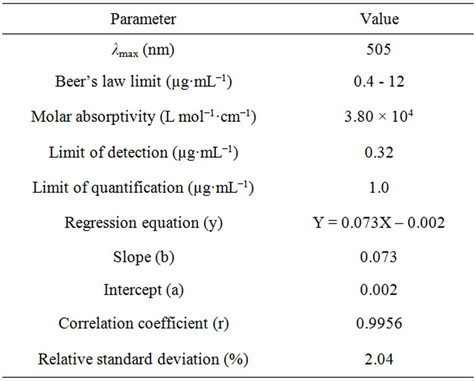
Table 2. Quantitative parameters for spectrophotometric determination of fluoxetine.
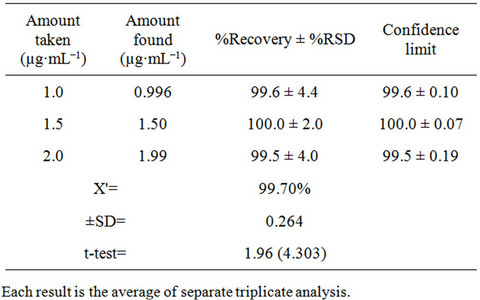
Table 3. Evaluation of precision of the proposed method for Fluoxetine determination in pure form.
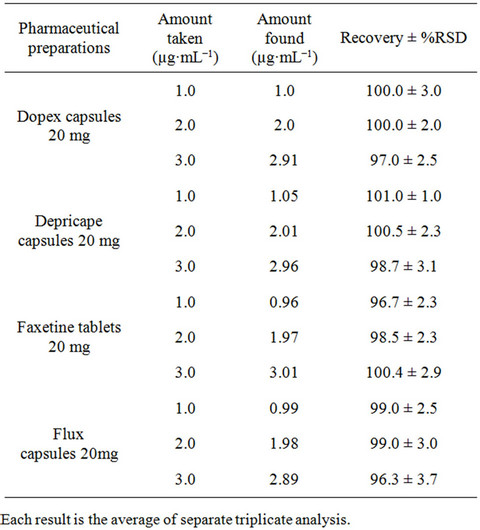
Table 4. Evaluation of accuracy and precision of the proposed Spectrophotometric method for Fluoxetine determination in dosage form.
form. The relative standard deviation was found to be satisfactory (RSD ≤ 3.0) specifying better reproducibility of the proposed method. Accuracy of the developed method was evaluated by standard addition method using four different brands of capsules (Dopex 20 mg, Depricape 20 mg, Faxetine 20 mg and Flux 20 mg) and spiked plasma sample. The percent recoveries were in the range of 97.0% to 103.0% for pharmaceutical formulations with a %RE ≤ 3.0 (Table 5) and from 97.0% to 99.0% for spiked plasma samples with a %RE ≤ 3.0 (Table 6). Good percent recovery with a small %RE indicates high accuracy of the developed method for the quantification of fluoxetine in pharmaceutical preparations and spiked plasma samples.
 (a)
(a)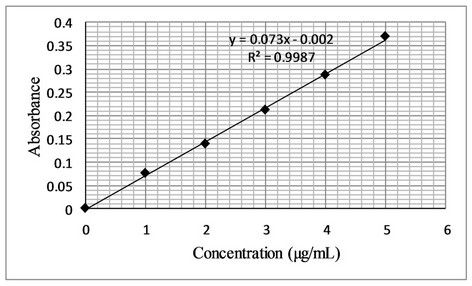 (b)
(b)
Figure 7. (a) Beer’s Law range; (b) Calibration curve for determination of fluoxetine by the proposed method.
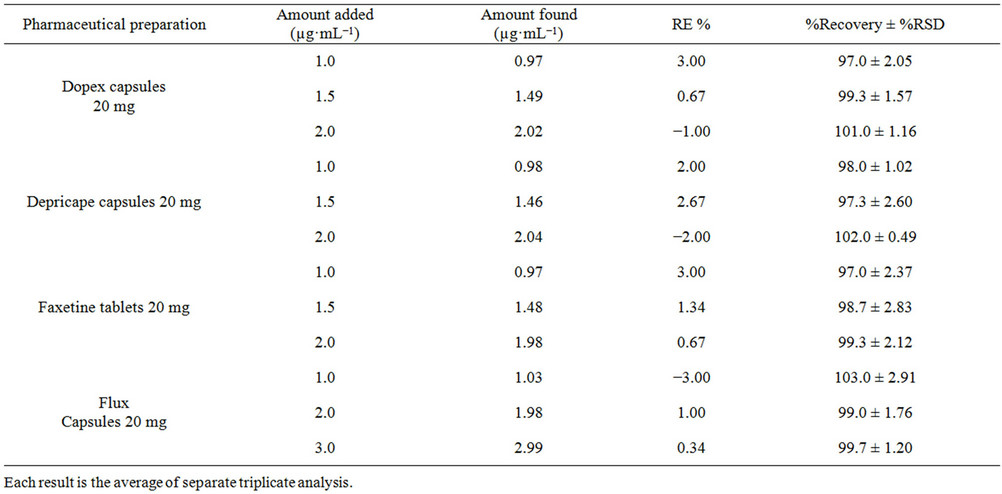
Table 5. Recoveries test of fluoxetine in commercial formulations (capsules, tablet) by the proposed method (standard addition method).
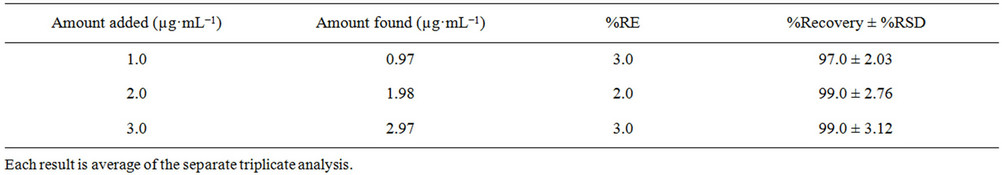
Table 6. Recovery test of fluoxetine from Plasma (standard addition method).
4. Application
The proposed method has been successfully applied for the determination of fluoxetine in four different brands of capsules and tablets (Dopex 20 mg capsules, Depricape 20 mg capsules, flux 20 mg capsules, Faxetine 20 mg tablets). The result showed good recoveries and close agreement with the label claims (Table 7) without any interference. The results were also compared statistically using student’s t-test for accuracy. The calculated value of “t” found less than the tabulated value for three degrees of freedom.
5. Conclusion
A sensitive, accurate and simple spectrophotometric
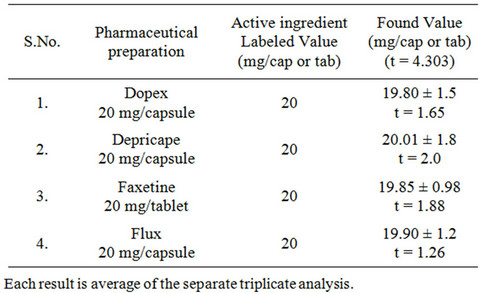
Table 7. Determination of fluoxetine in pharmaceutical formulations by the proposed method.
method has been developed and validated for the analysis of fluoxetine in pure form and in its capsules and tablets according to the guidelines of ICH [24]. The main advantage of the bromatometric method is the use of nontoxic bromate-bromide instead of hazardous liquid bromine reagent which is easily available and environment friendly. The proposed method does not involve tedious sample preparation, heating or extraction like other nonspectrophotometric methods [10-14].
REFERENCES
- K. Parfitt, “Martindale: The Complete Drug Reference,” 33rd Edition, Pharmaceutical Press, London, 2002.
- J. E. F. Reynolds, “Martindale: The Extra Pharmacopeia,” 31st Edition, Royal Pharmaceutical Society, London, 1996, p. 312.
- J. F. Wernicke, “The Side Effect Profile and Safety of Fluoxetine,” Journal of Clinical Psychology, Vol. 46, No. 3, 1985, pp. 59-67.
- T. A. Piggott and S. M. Seay, “A Review of the Efficacy of Selective Serotonin Reuptake Inhibitors in Obsessive-Compulsive Disorder,” Journal of Clinical Psychology, Vol. 60, No. 2, 1999, pp.101-106.
- F. Gevirtz, K. Way, C. H. Young, T. Coleman and K. Gregor, “SSRI-to-SSRI Switching and Associated Dosing Characteristics,” Journal of Managed Care Pharmacy, Vol. 5, No. 2, 1999, pp. 138-143.
- F. Bueno, A. M. Bergold and P. E. Froehlich, “Assay of Fluoxetine Hydrochloride by Titrimetricand HPLC Methods,” Bollettino Chimico Farmaceutico, Vol. 139, No. 6, 2000, pp. 256-259.
- M. Shamsipur, L. S. Dastjerdi, S. Haghgoo, D. Armspach, D. Matt and H. Y. Aboul-Enein, “Chiral Selectors for Enantioresolution and Quantitation of the Antidepressant Drug Fluoxetine in Pharmaceutical Formulations by 19F NMR Spectroscopic Method,” Analytica Chimica Acta, Vol. 601, No. 1, 2007, pp.130-138. doi:10.1016/j.aca.2007.08.017
- J. Atta-Politou, I. Skopelitis, I. Apatsidis and M. Koupparis, “In Vitro Study on Fluoxetine Adsorption onto Charcoal Using Potentiometry,” European Journal of Pharmaceutical Sciences, Vol. 12, No. 3, 2001, pp. 311- 319. doi:10.1016/S0928-0987(00)00187-1
- C. R. Shah, N. J. Shah, B. N. Suhagia and N. M. Patel, “Simultaneous Assay of Olanzapine and Fluoxetine in Tablets by Column High-Performance Liquid Chromatography and High-Performance Thin-Layer Chromatography,” Journal of AOA CInternational, Vol. 90, No. 6, 2007, pp. 1573-1578.
- M. T. Maya, C. R. Domingos, M. T. Guerreiro and J. A. Morais, “Determination of the Antidepressant Fluoxetine in Human Plasma by LC with UV Detection,” Journal of Pharmaceutical and Biomedical Analysis, Vol. 23, No. 6, 2000, pp. 989-996. doi:10.1016/S0731-7085(00)00367-8
- M. A. Raggi, G. Casamenti, R. Mandrioli, C. Sabbioni and V. Volterra, “A Rapid LC Method for the Identification and Determination of CNS Drugs in Pharmaceutical Formulations,” Journal of Pharmaceutical and Biomedical Analysis, Vol. 23, No. 19, 2000, pp. 161-167. doi:10.1016/S0731-7085(00)00265-X
- N. Yilmaz, Y. Ozkan, S. A. Ozan, I. Biryol and H. Y. Aboul-Enein, “High Performance Liquid Chromatographic Assay and Drug Dissolution Studies of Fluoxetine Hydrochloride in Capsule Formulations,” Journal of Liquid Chromatography and Related Technology, Vol. 23, No. 11, 2000, pp. 1699-1710. doi:10.1081/JLC-100100446
- A. Lucca, G. Gentilini, S. Lopez-Silva and A. Soldarini, “Simultaneous Determination of Human Plasma Levels of Four Selective Serotonin Reuptake Inhibitors by HighPerformance Liquid Chromatography,” Therapeutic Drug Monitoring, Vol. 22, No. 3, 2000, pp. 271-276. doi:10.1097/00007691-200006000-00007
- I. Meineke, K. Schreeb, I. Kress and U. Gundert-Remy, “Routine Measurement of Fluoxetine and Norfluoxetine by High-Performance Liquid Chromatography with Ultraviolet Detection in Patients under Concomitant Treatment with Tricyclic Antidepressants.” Therapeutic Drug Monitoring, Vol. 20, No. 1, 1998, pp. 14-19. doi:10.1097/00007691-199802000-00003
- E. Lacassie, J. M. Gaulier, P. Marquet, J. F. Rabatel and G. Lachatre, “Methods for the Determination of Seven Selective Serotonin Reuptake Inhibitors and Three ActiveMetabolites in Human Serum Using High-Performance Liquid Chromatography and Gas Chromatography,” Journal of Chromatography B and Biomedical Science application, Vol. 742, No. 2, 2000, pp. 229-238.
- J. J. Berzas-Navado, M. J. Villasenor-Lierena, A. M. Contento-Salcedo and E. Aguas-Nuevo, “Determination of Fluoxetine, Fluvoxamine, and Clomipramine in Pharmaceutical Formulations by Capillary Gas Chromatography,” Journal of Chromatographic Science, Vol. 38, No. 5, 2000, pp. 200-206.
- N. H. Jourdil, P. D. Fontanille and G. M. Bessard, “Concurrent Determination of Second-Generation Anti-Depressants in Plasma by Using Gas Chromatography with Nitrogen-Phosphorus Detection,” Clinical Chemistry, Vol. 43, No. 11, 1997, pp. 2209-2210.
- T. Buzinkaiova and J. Polonsky, “Determination of Four Selective Serotonin Reuptake Inhibitors by Capillary Isotachophoresis,” Electrophoresis, Vol. 21, No. 14, 2000, pp. 2839-2841. doi:10.1002/1522-2683(20000801)21:14<2839::AID-ELPS2839>3.0.CO;2-J
- J. J. Berzas-Navado, A. M. Contento-Salcedo, M. J. Villasenor-Llerena and E. Aguas-Nuevo, “Method Development and Validation for the Simultaneous Determination of Fluoxetine and Fluvoxamine in Pharmaceutical Preparations by Capillary Electrophoresis,” Analytica Chimica Acta, Vol. 417, No. 2, 2000, pp. 169-176. doi:10.1016/S0003-2670(00)00926-0
- I. A. Darwish, S. M. Amer, H. H. Abdine and L. I. AlRayes, “New Spectrophotometric and Fluorimetric Methods for Determination of Fluoxetine in Pharmaceutical Formulations,” International Journal of Analytical Chemistry, Vol. 2009, pp. 1-9. doi:10.1155/2009/257306
- A. Afkhami, T. Madrakian and L. Khalafi, “Spectrophotometric Determination of Fluoxetine by Batch and Flow Injection Methods,” Chemical and Pharmaceutical Bulletin, Vol. 54, No. 12, 2006, pp. 1642-1644. doi:10.1248/cpb.54.1642
- H. P. Anandkumari, B. P. Vandana, and G. Rajani, “Spectrophotometric Determination of Fluoxetine Using Methyl Orange and Thymol Blue to Form Ion Pair Complex,” Journal of Pharmaceutical and Biomedical Analysis, Vol. 20, No. 3, 1999, pp. 427-432.
- J. Shah, M. R. Jan and F. Rehman, “Flow Injection Spectrophotometric Determination of Fluoxetine in Bulk and in Pharmaceutical Preparations,” Journal of the Chilean Chemical Society, Vol. 53, No. 3, 2008, pp. 1605-1608. doi:10.4067/S0717-97072008000300011
- International Conference on Harmonization, “Validation of Analytical Procedures: Test and Methodology,” Vol. 60, Federal Register, London, 1996, p. 11260.
NOTES
*Corresponding author.