Open Journal of Rheumatology and Autoimmune Diseases
Vol.2 No.3(2012), Article ID:21772,9 pages DOI:10.4236/ojra.2012.23013
Validation of Reference Genes for mRNA Quantification in Adjuvant Arthritis
![]()
1Department of Molecular Medicine and Surgery, Karolinska University Hospital, Karolinska Institutet, Stockholm, Sweden; 2Department of Clinical Neurosciences, Karolinska Institutet, Stockholm, Sweden; 3Department of Clinical Sciences, Danderyd Hospital, Karolinska Institutet, Stockholm, Sweden; 4Department of Medicine, Karolinska University Hospital, Karolinska Institutet, Stockholm, Sweden; 5Department of Neurobiology, Care Sciences and Society, Karolinska Institutet, Stockholm, Sweden.
Email: *mahmood.ahmed@ki.se
Received February 14th, 2012; revised March 26th, 2012; accepted April 10th, 2012
Keywords: Quantitative PCR; Adjuvant Arthritis; Housekeeping Gene
ABSTRACT
Real time quantitative PCR (RT-qPCR) requires a method to normalize the expression of target genes against an endogenous reference gene. It is known that commonly used housekeeping genes (HKGs) vary tremendously in inflammatory conditions; however information about the stability and expression of HKGs in chronic inflammatory joint disease such as rheumatoid arthritis (RA) is scarce. The expressional stability of 10 commonly used HKGs was analyzed in the neuronal (spinal cord, dorsal root ganglia) and in the musculoskeletal tissues (tendon, muscle, epiphysis, capsule, periosteum and ankle joint) using RT-qPCR in the rat model of RA. In individual tissues, suitable HKGs were selected by  (│Ct control − Ct arthritis│) and further analyzed by using software programs; geNorm and normfinder. We found hypoxanthine-guanine phosphoribosyl tranferase (HPRT) as the most stable gene except ankle joint while glyceraldehyde-3-phosphate dehydrogenase (GAPDH) was found as the least stable gene in musculoskeletal tissues. In inflamed ankle joint where no reference gene was found to be stably expressed, an inflammatory cell marker CD3 was used to normalize peptidylprolyl isomerase B (PPIB), the most homogenous HKG identified among the 10 HKGs. The normalized PPIB was then used to analyze the gene expression of neurokinin 1 (NK1), receptor of substance P, a potent pro-inflammatory mediator. We observed a 3.5 fold increase (p = 0.009) in NK1 expression in inflamed ankle joint compared to control. Our results indicate that reference genes stability should be evaluated before using them as reference during inflammatory conditions. In tissues with intense inflammatory cell infiltration, an inflammatory cell marker should be used to normalize the selected reference gene to avoid erroneous results.
1. Introduction
Real time quantitative PCR (RT-qPCR) is a sensitive and reproducible method for the estimation and comparative analysis of mRNA expression [1]. However, it requires a method to normalize the expression of target genes against an endogenous reference or housekeeping gene (HKG) to see the difference in RNA concentration. A prerequisite for a gene to serve as endogenous reference is that its expression level should not vary in different tissue types and under various experimental conditions. Several structural and metabolic genes have been used as internal controls; however, none of them seems to be identified as universally accepted endogenous control. Previous studies indicate that most commonly used HKGs i.e., glyceraldehyde-3-phosphate dehydrogenase (GAPDH) and beta-actin (ACTB) show considerable variation between tissues as well as in different experimental conditions [2]. It has been reported that expression levels of both GAPDH and ACTB were unstable in pancreatic islet grafts [3], colonic cancerous tissues [4], asthmatic airways [5] and T-lymphocytes [6]. Little information is available about the expression of HKGs in chronic inflammatory joint diseases such as rheumatoid arthritis (RA). RA is a chronic immune-mediated disease marked by inflammation in synovium of joint and destruction of cartilage and bone. It seems reasonable to speculate that inflammatory cell infiltration can cause huge differences in the level of expression of HKGs genes leading to erroneous results. Thus, appropriate validation of HKGs is a crucial step in inflammatory conditions.
Currently many methods are used for the selection of stable and reliable HKGs [7,8]. One software-based approach, developed by Vandesompele et al. [9] involves normalization of more than one housekeeping gene by using an algorithm based computer program, geNorm. GeNorm performs a pairwise comparison of candidate HKGs and ranks the potential reference genes according to their gene expression stability. Other software-based approaches include Excel-based BestKeeper [10], and normfinder [11]. Normfinder calculates a stability value based on the combined estimate of both intraand intergroup values and further determines the optimal reference gene among the HKGs. For the selection of most stable HKGs during inflammatory conditions we used constant amount of RNA and HKGs were selected by comparing Ct values and further analyzed by using geNorm and normfinder software.
A number of animal models closely resembling the clinical and pathological picture of RA are being used to study the mechanisms of pain, inflammation and joint destruction as well as to identify better pharmacological tools to treat RA. Adjuvant arthritis (AA) is a commonly used animal model of RA with several clinical and pathological similarities regarding inflammation, pain, synovial hyperplasia, and joint destruction [12]. It has been implicated that the neuropeptide substance P (SP) is involved in the modulation of inflammation and pain through its receptor neurokinin 1 (NK1) in inflammatory joint disorders such as RA and AA [13]. However, to our knowledge, no study has evaluated HKGs for mRNA quantification in arthritic conditions. The aim of this study was to evaluate and to validate HKGs for a reliable mRNA quantification using RT-qPCR in AA.
2. Materials and Methods
The study included a total of 12 female Sprague Dawley rats (bw 230 - 250 g). The rats were housed 4/cage at 21˚C in a 12-hour light/dark cycle with pellets and water ad lib according to the Karolinska Institute protocol. The study was approved by the Ethical Committee of Stockholm North.
2.1. Induction of Arthritis
Arthritis was induced in 6 rats by intradermal injections of a suspension (0.05 ml) of heat-killed Mycobacteriumbutyricum in paraffin oil (10 mg/ml) into the base of the tail (day 0) under 3% - 5% isoflurane anaesthesia [14]. An additional 6 rats received 0.05 ml of paraffin oil and served as control group. In rats inoculated with Mycobacterium butyrcium, signs of inflammation including bilateral paw swelling, redness and warmth were observed on days 12 - 14 and sustained later on. Rats were sacrificed on day 15.
2.2. Tissue Collection and RNA Extraction
Rats were anaesthetised with sodium pentobarbitone (60 mg/kg, intraperitoneally) and decapitated. The lumbar spinal cord, dorsal root ganglia (L2 - L6), ankle joint, achilles tendon, calf muscle, tibial epiphysis, knee joint capsule and periosteum were dissected and immediately frozen in liquid nitrogen. Frozen tissues were homogenized by Mikro-dismembrator S (B. Braun Biotech International), at 2600 rpm/min for 30 seconds and dissolved in 2 - 3 volumes of Trizol reagent (Invitrogen life technologies Inc., USA). RNA was then extracted and further purified using the RNeasy® MiniKit (Qiagen, USA) following the manufacturers protocol. Spectrophotometric analysis of the sample consistently showed absorption ratio (OD) OD260 nm/OD280 nm = 1.8 - 2.2 indicating excellent purity of the ribonucleic acids.
2.3. Real-Time Quantitative RT-PCR
Total RNA (1 μg) was reverse transcribed to cDNA with random hexamer primers using 1st strand cDNA Synthesis Kit for RT-PCR (Roche, Germany). For quantification cDNAs were diluted to 100 µl. A volume of 3 µl of individual cDNA for each HKG was used for real time RT-PCR with TaqMan 1X Universal PCR Master Mix (Applied Biosystems, Roche, Germany). Assay on Demand Kits containing corresponding primers and probes from Applied Biosystems were used. The 10 HKGs (Table 1) were evaluated as internal controls to normalize for RNA loading on ABI Prism 7700 Sequence Detection System. In addition, primers of NK1 (Rn00562004_m1) and CD3 (Rn00596773_m1) were run in the inflamed ankle joints. Data were collected in real-time during the elongation step of each cycle. Each cDNA sample was analyzed in duplicate. A standard curve was established using dilutions of cDNA from the spinal cord. Control with no template was included in each experiment. The standard curve was calculated by plotting the threshold cycle (Ct value) against the log nanograms of total RNA added to the reverse transcription reaction. The data acquired from each sample assayed was analysed for the stability of HKGs.
2.4. HKG Stability Analysis
Initially ± SEM was calculated for each HKG in the spinal cord (SC), dorsal root ganglia (DRG), ankle joint, muscle, tendon, capsule, periosteum and epiphysis as the difference of Ct values obtained in the control and arthritic rats. The Ct is defined as the number of cycles needed for the fluorescence to reach a specific threshold level of detection and is inversely correlated with the amount of template present in the reaction. Ideally, a good reference gene should have ∆Ct close to zero reflecting no change during pathological conditions. HKGs with
  > 1 were excluded for further analysis considering unstable genes. The relative stability of selected reference genes was then calculated using geNorm [9] and Normfinder [11], two Excel-based software programs in each tissue. GeNorm ranked all HKGs according to their stability by average expression stability (M) which was derived by pairwise exclusion of unstable genes to find the best pair of HKGs and further calculates pair-wise variation value V for each HKG compared to all other HKGs. Normfinder ranked HKGs by calculating the stability values on the basis of inter-and intra-group variations. An arbitrary cut-off value of 0.4 for geNorm and normfinder was used. All HKGs with the stability values more than the cut-off values were considered unstable with both programs.
2.5. Statistics
All calculations were carried out using statview program. Differences in Ct values are shown as  ± SEM and RT-qPCR data is expressed as mean ± SD. The comparison between the groups was performed by using unpaired Student t-test. Significance level was set at p ≤ 0.01.
3. Results
3.1. Analysis of HKG Stability
 ± SEM method. 10 HKGs were run in the neuronal (SC, DRG) and in the musculoskeletal tissues (tendon, muscle, epiphysis, capsule, periosteum and ankle joint) from the control and arthritic rats (Table 1). A difference in Ct values (
 ) was calculated in the normal and arthritic tissues for all HKGs [15]. All HKGs with
  > 1 were excluded for further analysis in the tissues analysed. Thus, 18S was excluded in DRG, B2M in muscle, GAPDH and UCE in capsule, GAPDH in epiphysis and GUSB, PPIB, ACTB and ARBP in periosteum (Table 2). No stable HKG was identified in the inflamed ankle joint according to the
  criteria. We observed minimal SEM in all tissues indicating a low biological and methodological variation.
GeNorm analysis. The HKGs selected on the basis of  criteria were further analyzed by geNorm software program in the control and arthritic tissues. All HKGs with M value below the cut-off level of 0.4 were considered as stable while HKGs with M > 0.4 suggested unstable HKGs [16]. Based on the expressional stability (M), HKGs were ranked (Table 3(a)). Additionally, pairwise variation analysis (V) with default value 0.15 helped to choose the optimum number of HKGs for the calculation of normalization factor (NF) in each tissue. Using geNorm program, we identified PPIB/GAPDH as the most stable HKG pair in SC, ARBP/GAPDH in DRG, ACTB/ B2M in tendon, ACTB/PPIB in muscle and capsule, PPIB/ARBP in epiphysis and HPRT/B2M in periosteum
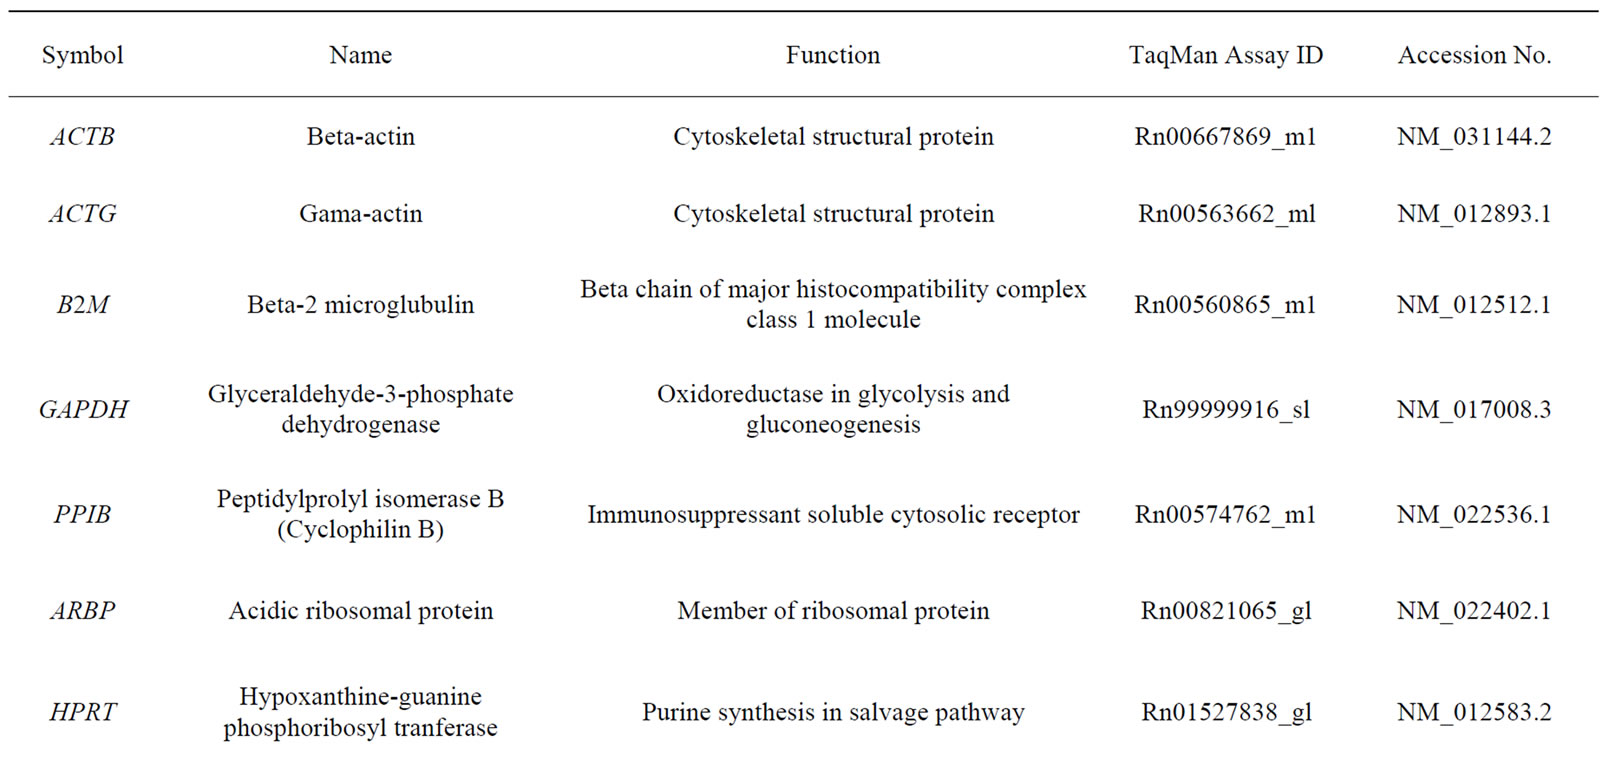
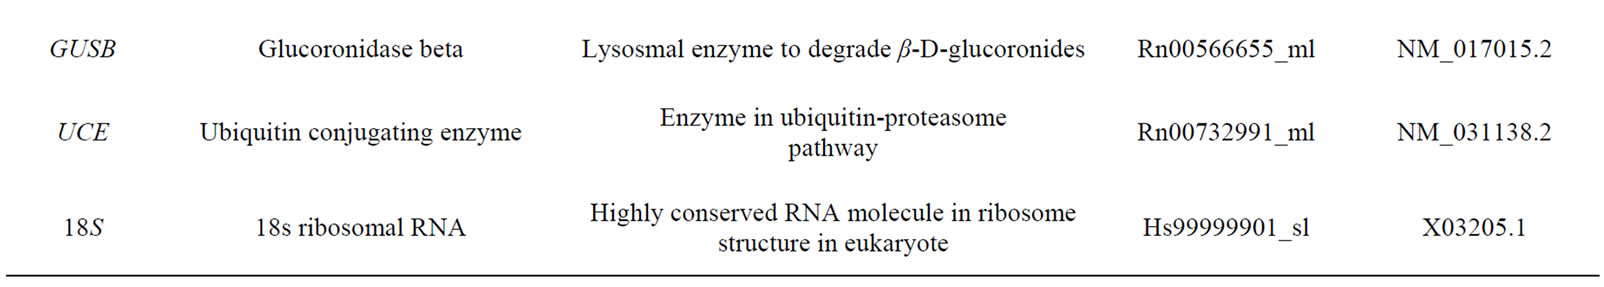
Table 1. Housekeeping genes evaluated in the study.
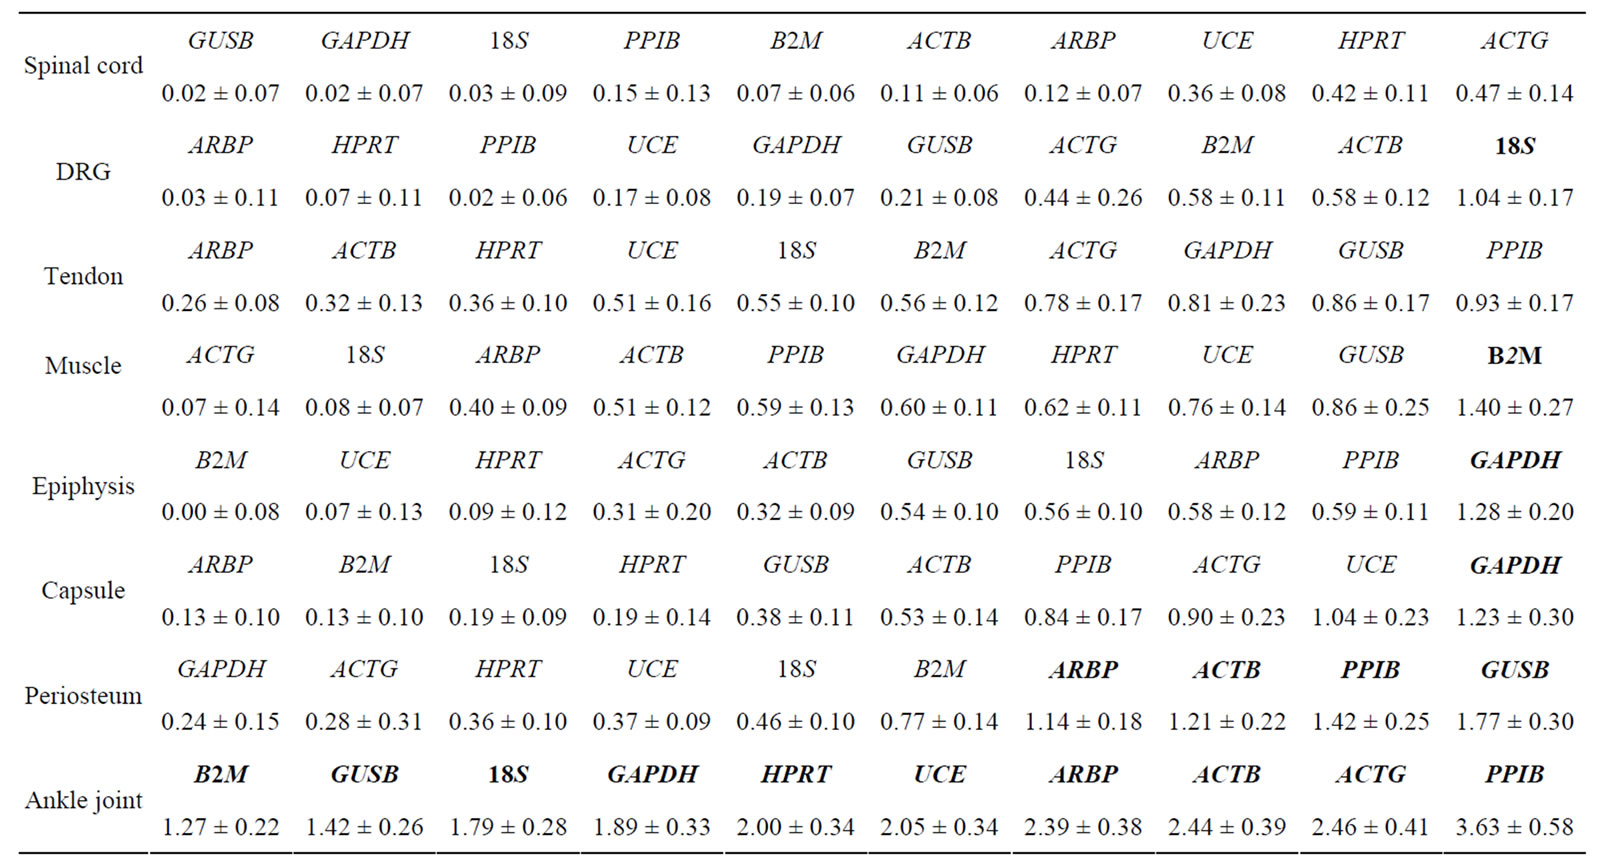
Table 2. Difference in Ct values ( ) in the spinal cord, dorsal root ganglia (DRG), tendon, muscle, epiphysis, capsule, periosteum and ankle joint of arthritis and control rats. HKGs are ranked from most stable to least stable. Values are expressed as
  ± SEM. Boldface indicates genes removed for analysis by geNorm and normfinder. For details, see Materials and Results. n = 6 in each group.
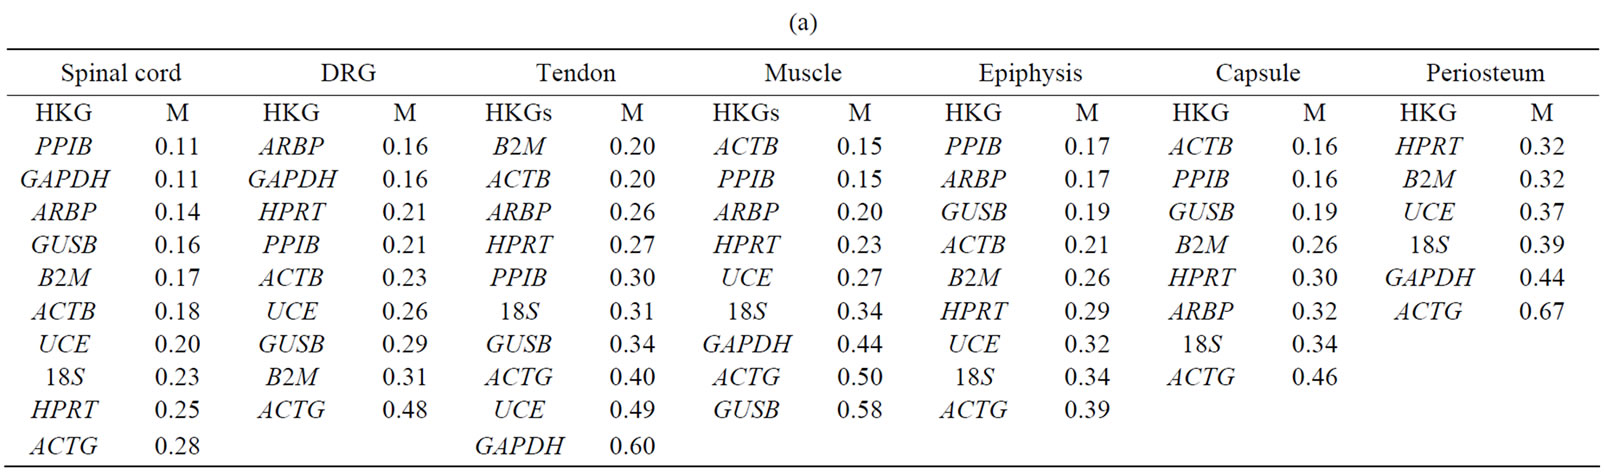
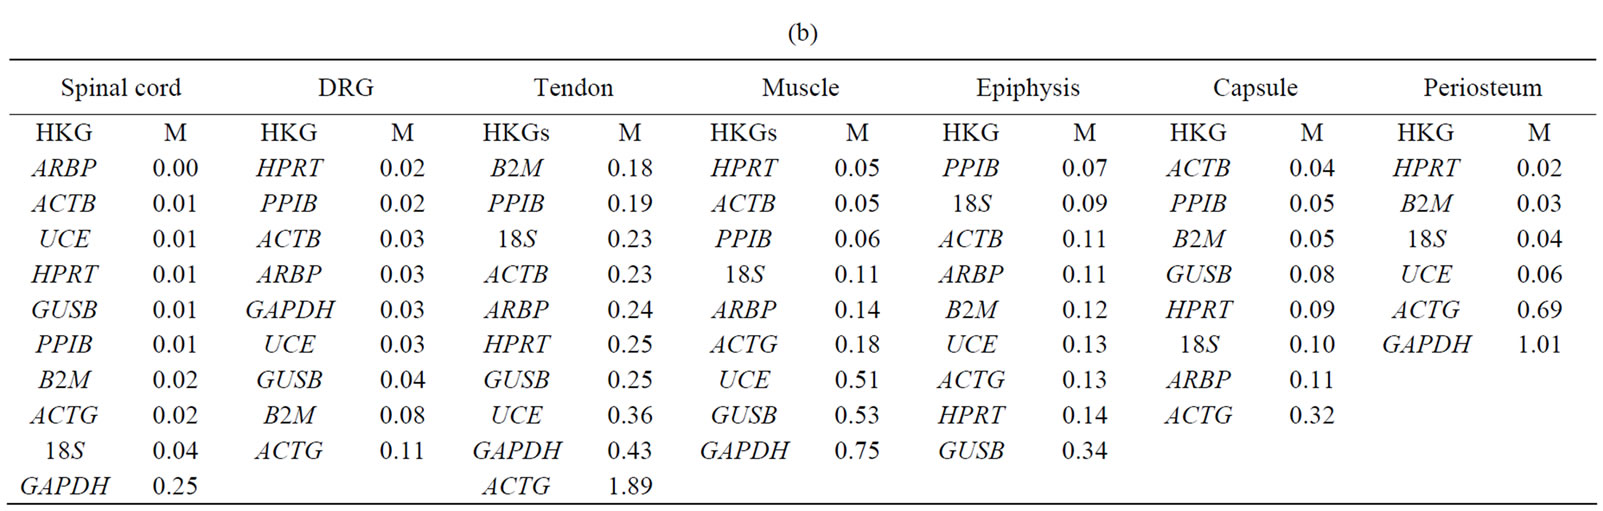
Table 3. The expressional stability of housekeeping genes calculated by geNorm (a) and normfinder (b). Genes are ranked from most stable to least stable (top to bottom) in the spinal cord, dorsal root ganglia (DRG), tendon, muscle, epiphysis, capsule, periosteum and in ankle joint.
(Table 4). Pairwise variation analysis (Vn/n + 1) further indicated that inclusion of an additional gene in a selected pair of HKGs did not increase the stability of NF and accuracy of results in any of the tissues (Figure 1).
Normfinder analysis. The stability of HKGs in the control and arthritic tissues was further analyzed by NormFinder. Normfinder strengthened and further evaluated the best HKG in a group of HKGs selected by thegeNorm (Table 3(b)). When ranking the top candidate HKG previously selected by geNorm, the normfinder identified ACTB as more stable gene than B2M in tendon (stability value = 0.18 compared to 0.23), in epiphysis PPIB was selected over ARBP (stability value = 0.07 compared to 0.11), ACTB over PPIB in capsule (stability value = 0.04 compared to 0.05) and HPRT (stability value = 0.02) was selected as more reliable gene compared to B2M (stability value = 0.03) in periosteum. However, in the neuronal tissues (SC and DRG) as well as in muscle, normfinder selected different HKGs as selected by the geNorm although in the same stability range. Thus, in the SC, ARBP (stability value = 0.14) was selected as the most stable HKG. In DRG and muscle, HPRT was selected as the most stable HKG with stability value equal to 0.05 and 0.06 respectively. In muscle, the most stable pair of HKGs as selected by geNorm was ACTB/PPIB. Correspondingly, normfinder ranked ACTB as second and PPIB as third best gene with stability value equal to 0.05 for ACTB and 0.06 for PPIB compared to 0.05 for HPRT (Table 4).
3.2. Stability of HKG
Our results showed HPRT as the most stable HKG in all studied tissues except the inflamed ankle joint. GeNorm calculated the stability value (M) for HPRT ranging from 0.21 to 0.32 while normfinder showed stability value between 0.01 to 0.25, all below the arbitrary cut-off value of 0.4. On the other hand, by using all three analyses GAPDH was identified as the most unstable HKG in peripheral tissues in arthritic rats. Thus, Capsule, epiphysis and ankle joint had  > 1 and equal to 1.23, 1.28 and 1.89, respectively for GAPDH (Table 2). GeNorm calculated M for as 0.44 in muscle, 0.44 in periosteum and 0.60 in tendon. Furthermore, normfinder analyzed M equal to 0.43 in tendon, 0.75 in muscle and 1.01 in the periosteum, all above the arbitrary cut-off value of 0.4 (Tables 3(a) and (b)).
3.3. Selection of HKG in Ankle Joint
According to  analysis (see Methods) all HKGs showed significant variations in the inflamed compared to normal ankle joint. Thus,
  > 1 in the inflamed ankle joint for all the HKGs ranged from 1.27 for B2M to 3.63 for PPIB (Table 2). Considering the variability of HKGs expression in the ankle joint as a result of severe inflammation, the expression of CD3, a T-lymphocyte marker was analyzed [17]. We observed an up-regulation of CD3 expression in the inflamed ankle joint with
  = 3.31 ± 0.56. Subsequent normalization of all HKGs with CD3 resulted in the differences in control and arthritis ankle joint ranging from 16.7% for PPIB to 79.4% for B2M. All the HKGs showed significant differences except PPIB and ACTG (Figure 2). The difference between the normal and inflamed ankle joints was 40.2% when ACTG normalized with CD was used but interestingly did not reach the level of significance (p = 0.07). The same difference for PPIB was 16.7% suggesting PPIB be the most homogenous HKG when normalized with CD3 (p = 0.6) (Figure 2). Therefore CD3-normalized PPIB (PPIB/CD3) was selected to analyse the gene expression of NK1 in inflamed ankle joint.
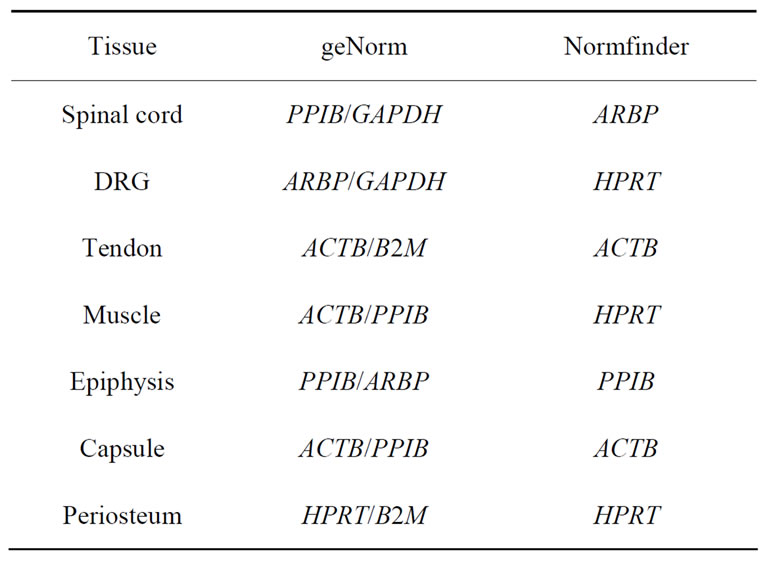
Table 4. Housekeeping genes selected by geNorm and Normfinder in the spinal cord, dorsal root ganglia (DRG), tendon, muscle, epiphysis, capsule and in periosteum of arthritis and control rats.
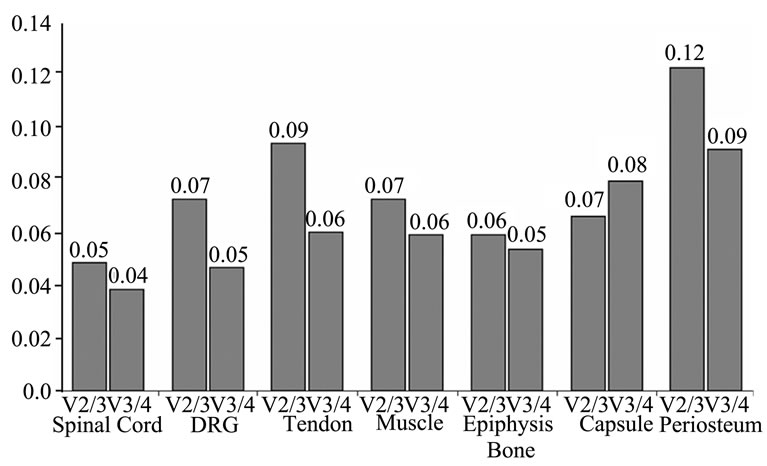
Figure 1. The optimum number of reference genes selected by the geNorm software. Variation analysis of the top four candidate HKGs in each tissue based on pairwise variation (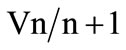 ) analysis. A value of V below the default value (V < 0.15) indicates no effect on increased stability by the inclusion of an additional HKG.
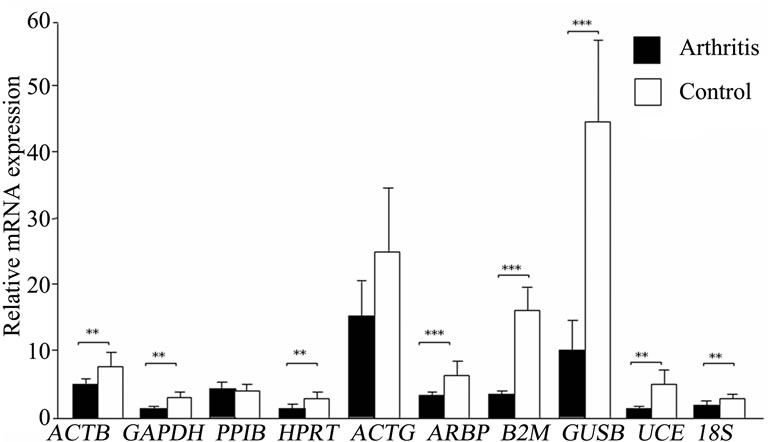
Figure 2. Variation in housekeeping genes expression in ankle joints of arthritis and control rats after CD3 normalization. Results are expressed as mean ± SD. **p ≤ 0.005 and ***p ≤ 0.0005, comparison of arthritis and control groups (unpaired students t-test). n = 6 rats in each group.
3.4. Evaluation of CD3-Normalized HKG in Ankle Joint
Following the identification of PPIB/CD3 as the most stable HKG, it was tested as an internal control in inflamed ankle joint. Previous reports have shown increased expression of NK1 in inflamed tissues [13,18]. Consequently, we normalized NK1 expression in the control and inflamed ankle joints both with the nonnormalized and CD3-normalized PPIB expression. We observed a down-regulation of NK1 expression by 3.2 fold (p = 0.06), when non-normalized PPIB was used, whereas an up-regulation of NK1 expression by 3.5 fold (p = 0.009) was demonstrated after normalizing PPIB with CD3 which was comparable with the results when NK1 data was analyzed without using any HKG (5.5 fold increase, p < 0.0001) (Figure 3).
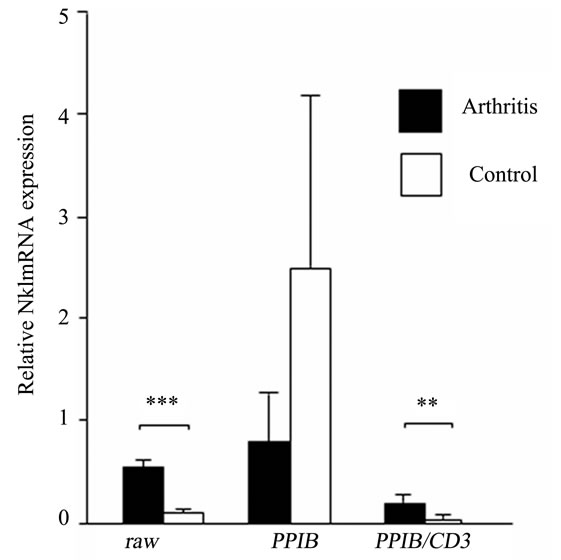
Figure 3. Non-normalized (raw), PPIB normalized and PPIB/CD3 normalized relative NK1 mRNA expression in the ankle joints of arthritis and control rats. Results are expressed as mean ± SD. **p ≤ 0.005 and ***p ≤ 0.0005, comparison of arthritis and control groups (unpaired students t-test). n = 6 rats in each group.
4. Discussion
This study clearly highlights the importance of HKGs validation for analysis by RT-qPCR. Our results showed that the most stable HKG or the geometric mean of two most stable HKGs should be used as internal control to normalize genes of interest. We have demonstrated that most commonly used HKG, GAPDH is not stably expressed and therefore not suitable for normalization in peripheral tissues during inflammatory conditions. Moreover, our study indicates that in heavily inflamed tissues, normalization of HKGs, by an inflammatory cell marker, can be employed as an additional strategy.
To study the effects of inflammation on the expression of commonly used HKGs, we used adjuvant arthritis rat model which closely resemble the clinical, pathological and etiological picture of RA. Like RA, there is bilateral symmetrical involvement of peripheral joints where an intense inflammatory cell infiltration is identified in the hypertrophied synovium leading to cartilage and subchondral bone destruction. The pathological changes are not only confined to ankle joints but also observed in the draining lymph nodes, spleen, lever and the neuronal tissues like dorsal root ganglia and spinal cord.
It is known that for a reliable mRNA quantification, a stable internal control gene is a prerequisite which should express an inherent stability regardless of the experimental conditions. A number of studies have shown that the expression of commonly used HKGs vary not only between the different tissues in normal condition but also in pathological tissues [2-6]. Consistent with these observations, our present study reports that during peripheral inflammation, most of the commonly used reference genes are up-regulated in the peripheral and neuronal tissues. In the inflamed ankle joints with intense inflammatory cells infiltration, none of the ten HKGs used in this study was found to be expressed in a stable manner. It is known that inflammation not only change the phenotype of pro-inflammatory mediators like cytokines and neuropeptides but also trigger an increased expression of inflammatory mediators in the target organs. Thus, in adjuvant arthritis we have previously shown an increased expression of substance P and calcitonin gene-related peptide, the known pro-inflammatory neuropeptides, in the inflamed ankle joints as well as their increased synthesis in the corresponding dorsal root ganglia [19]. It is reasonable to speculate that the inflammatory reaction in the ankle joint and other tissues in adjuvant arthritis change the gene expression of neuropeptides but also the HKGs observed in this study.
Present study clearly demonstrates the importance of employing multiple approaches to select the reliable and stable HKG/s to detect the difference in target genes in conditions like adjuvant arthritis. A number of commonly used HKGs should be included and tested in individual tissues before a suitable HKG is selected for comparative analysis using RT-qPCR. Furthermore, the available methodologies like , geNorm and normfinders are recommended to utilize to further refine the selection of HKGs in order to avoid erroneous results. In the present study of adjuvant arthritis where inflammation affects all the analyzed tissues, application of
  method identifies and discards 8 out of 10 HKGs not suitable to be used as reference genes in DRG (18S), muscle (B2M), capsule (GAPDH/UCE), epiphysis (GAPDH) and periosteum (GUSB/PPIB/ACTB/ARBP). None of the 10 HKGs was found stable in inflamed ankle joints by this method. We then select the stable HKGs based on
  criteria in individual tissues and further analyzed by geNorm and normfinder. Using geNorm program, we identified 6 different pairs of HKGs suitable to be used as reference genes in spinal cord (PPIB/ GAPDH), DRG (ARBP/GAPDH), tendon (ACTB/B2M), muscle/capsule (ACTB/PPIB), epiphysis (PPIB/ARBP) and periosteum (HPRT/B2M) but could not identify a common pair of HKGs to be used in all the tissues again highlighting the importance of testing a number of HKGs in individual pathological tissues. The results also indicate that adding a third HKG to a selected pain does not increase the stability and sensitivity of the pair. Also, geNorm program fails to identify a pair of stable HKGs in the inflamed ankle joints.
We then apply the normfinder program to further refine and select the best HKG in a pair of HKGs as selected by geNorm in individual tissues. Comparing the results of both programs, it is interesting to find that the top ranked HKGs more or less retain their positions in most of the peripheral tissues studied. It is safe to say that the reproducibility of the results obtained by the two methods reflects the inherent stability of the selected reference genes in a particular tissue. However, in spinal cord, DRG and muscle, minor differences were observed in the ranking of HKGs between the geNorm and normfinder methods, although the differences between the selected HKGs were in the acceptable range. Similar discrepancies have been reported earlier and our results are in line with previous reports [8,20]. It is assumed that minimal differences within the calculation algorithms of each applet may cause the observed differences in the ranking positions [8,20,21], probably due to the reason that the two programs use different methods for calculations. GeNorm calculates the stability value M on the basis of geometric mean expression levels. This program is not designed to choose a single gene rather it selects the best pair of HKG based on pairwise analysis. The principle is that the expression ratio of two ideal HKGs is identical in each experimental condition. Variations in expression ratio in tested HKGs can be due to the variation in one or both genes. Normfinder on the other hand, is a more model-based program that calculates stability value based on inter-group and intra-group variations and chooses single best HKGs.
It has been reported that GAPDH is one of the most commonly used HKG even though several reports indicated that GAPDH is not stable in different tissues and during different experimental conditions [7,22,23]. Our results based on 3 different methods to select a stable HKG among 10 HKGs confirm that GAPDH is not suitable to be used as a reference gene to normalize the target gene expression in inflammatory tissues and can lead to totally misleading results. In our experiments, HPRT was the only HKG which was consistently ranked as a stable HKG in all the inflammatory tissues except ankle joint.
We were unable to identify any stable HKG among the ten commonly used HKGs in the inflamed ankle joint. We observed a significant up regulation of all HKGs in the ankle joint during inflammation compared to normal ankle joint. This change in the expression of HKGs is probably due to the reason that there is intense infiltration of various inflammatory cells in the ankle joint compared to other tissues in AA. The synovium of ankle joint in AA like RA transforms from relatively few cellular structure into a hyperplastic invasive tissue teeming with immunocompetent cells like lymphocytes, NK-cells, neutrophils and macrophages etc. T-lymphocyte is the most abundant and important cell present in the inflamed synovium which participate in the induction and maintenance of disease process. CD3 is a well known cell marker for T-lymphocyte.
In the present study, a significant up regulation of CD3 expression was demonstrated along with similar increased expression of HKGs in the inflamed ankle joint. It is clear that increased CD3 expression is due to intense inflammatory cell infiltration in inflamed ankle joint and we believe the same reason behind the increased expression of all the tested HKGs making them unstable to be used as reference genes. When all the HKGs were normalized with CD3 to remove the effects of inflammatory cells on HKGs, PPIB was found to be the least effected HKG. When normalized and non-normalized PPIB with CD3 was used to study the change in the expression of NK1, a receptor of pro inflammatory neuropeptide SP, opposite results were seen. A down regulation of NK1 expression was demonstrated when non-normalized PPIB was used and an expected significant up regulation of NK1 was observed with CD3 normalized. An increased expression of NK1 was also seen in the inflamed joint when no HKG (raw data) was used. Tricarico et al. encountered the similar problems when they could not identify appropriate HKGs in human breast tissue biopsies [23]. They suggested normalization of target genes with total RNA concentration as an acceptable method. Other suggested strategies are the measurements of sample volume, genomic DNA or incorporating alien molecules [24].
5. Conclusion
Thorough investigations of the expression pattern of HKGs should be performed before using them as internal control in inflammatory joint disorders. Furthermore, in tissues with intense inflammatory cell infiltration, an inflammatory cell marker should be used to normalize the selected HKG to avoid erroneous results.
6. Acknowledgements
This study was funded by a grant from Sven Noren Foundation to AS and a grant from Swedish research council (12660) to PE.
REFERENCES
- F. Ferre, “Quantitative or Semi-Quantitative PCR: Reality versus Myth,” PCR Methods and Applications, Vol. 2, No. 1, 1992, pp. 1-9.
- T. J. Chang, C. C. Juan, P. H. Yin, C. W. Chi and H. J. Tsay, “Up-Regulation of Beta-Actin, Cyclophilin and GAPDH in N1S1 Rat Hepatoma,” Oncology Reports, Vol. 5, No. 2, 1998, pp. 469-471.
- S. Rodriguez-Mulero and E. Montanya, “Selection of a Suitable Internal Control Gene for Expression Studies in Pancreatic Islet Grafts,” Transplantation, Vol. 80, No. 5, 2005, pp. 650-652. doi:10.1097/01.tp.0000173790.12227.7b
- N. Tsuji, C. Kamagata, M. Furuya, D. Kobayashi, A. Yagihashi, T. Morita, S. Horita and N. Watanabe, “Selection of an Internal Control Gene for Quantitation of mRNA in Colonic Tissues,” Anticancer Research, Vol. 22, No. 6C, 2002, pp. 4173-4178.
- E. M. Glare, M. Divjak, M. J. Bailey and E. H. Walters, “Beta-Actin and GAPDH Housekeeping Gene Expression in Asthmatic Airways Is Variable and Not Suitable for Normalising mRNA Levels,” Thorax, Vol. 57, No. 9, 2002, pp. 765-770. doi:10.1136/thorax.57.9.765
- A. Bas, G. Forsberg, S. Hammarstrom and M. L. Hammarstrom, “Utility of the Housekeeping Genes 18S rRNA, Beta-Actin and Glyceraldehyde-3phosphate-dehydrogenase Fornormalization in Real-Time Quantitative Reverse Transcriptase-Polymerase Chain Reaction Analysis of Gene Expression in Human T lymphocytes,” Scandinavian Journal of Immunology, Vol. 59, No. 6, 2004, pp. 566-573. doi:10.3171/jns.2004.100.3.0523
- M. D. Al-Bader and H. A. Al-Sarraf, “Housekeeping Gene Expression during Fetal Brain Development in the Rat-Validation by Semi-Quantitative RT-PCR,” Developmental Brain Research, Vol. 156, No. 1, 2005, pp. 38-45. doi:10.1111/j.0300-9475.2004.01440.x
- N. Silver, E. Cotroneo, G. Proctor, S. Osailan, K. L. Paterson and G. H. Carpenter, “Selection of Housekeeping Genes for Gene Expression Studies in the Adult Rat Submandibular Gland under Normal, Inflamed, Atrophic and Regenerative States,” BMC Molecular Biology, Vol. 9, 2008, p. 64. doi:10.1186/1471-2199-9-64
- J. Vandesompele, K. De Preter, F. Pattyn, B. Poppe, N. Van Roy, A. De Paepe and F. Speleman, “Accurate Normalization of Real-Time Quantitative RT-PCR Data by Geometric Averaging of Multiple Internal Control Genes,” Genome Biology, Vol. 3, No. 7, 2002, pp. 1-21.
- M. W. Pfaffl, A. Tichopad and C. Prgomet, “Determination of Stable Housekeeping Genes, Differentially Regulated Target Genes and Sample Integrity: BestKeeper-ExcelBased Tool Using Pair-Wise Correlations,” Biotechnology Letters, Vol. 26, No. 6, 2004, pp. 509-515.
- C. L. Andersen, J. L. Jensen and T. F. Orntoft, “Normalization of Real-Time Quantitative Reverse Transcription-PCR Data: A Model-Based Variance Estimation Approach to Identify Genes Suited for Normalization, Applied to Bladder and Colon Cancer Data Sets,” Cancer Research, Vol. 64, No. 15, 2004, pp. 5245-5250.
- P. H. Wooley, “Animal Models of Rheumatoid Arthritis,” Current Opinion in Rheumatology, Vol. 3, No. 3, 1991, pp. 407-420. doi:10.1097/00002281-199106000-00013
- S. M. Carlton and R. E. Coggeshall, “Inflammation-Induced Up-Regulation of Neurokinin 1 Receptors in Rat Glabrous Skin,” Neuroscience Letters, Vol. 326, No. 1, 2002, pp. 29-32. doi:10.1016/S0304-3940(02)00299-9
- C. M. Pearson and F. D. Wood, “Studies of Arthritis and Other Lesions Induced in Rats by the Injection of Mycobacterial Adjuvant. VII. Pathologic Details of the Arthritis and Spondylitis,” American Journal of Pathology, Vol. 42, No. 1, 1963, pp. 73-95.
- A. T. McCurley and G. V. Callard, “Characterization of Housekeeping Genes in Zebrafish: Male-Female Differences and Effects of Tissue Type, Developmental Stage and Chemical Treatment,” BMC Molecular Biology, Vol. 9, 2008, p. 102. doi:10.1186/1471-2199-9-102
- L. J Maccoux, D. N. Clements, F. Salway and P. J. Day, “Identification of New Reference Genes for the Normalisation of Canine Osteoarthritic Joint Tissue Transcripts from Microarray Data,” BMC Molecular Biology, Vol. 8, 2007, p. 62. doi:10.1186/1471-2199-8-62
- Y. Yoshikai, G. Matsuzaki, T. Inoue and K. Nomoto, “An Increase in Number of T-Cell Receptor Gamma/DeltaBearing T Cells in Athymic Nude Mice Treated with Complete Freund’s Adjuvants,” Immunology, Vol. 70, 1990, pp. 61-65.
- M. K. Schafer, D. Nohr, J. E. Krause and E. Weihe, “Inflammation-Induced Upregulation of NK1 Receptor mRNA in Dorsal Horn Neurones,” Neuroreport, Vol. 4, No. 8, 1993, pp. 1007-1010. doi:10.1097/00001756-199308000-00003
- M. Ahmed, A. Bjurholm, M. Schultzberg, E. Theodorsson and A. Kreicbergs, “Increased Levels of Substance P and Calcitonin Gene-Related Peptide in Rat Adjuvant Arthritis. A Combined Immunohistochemical and Radioimmunoassay Analysis,” Arthritis & Rheumatism, Vol. 38, No. 5, 1995, pp. 699-709.
- V. R. Cicinnati, Q. Shen, G. C. Sotiropoulos, A. Radtke, G. Gerken and S. Beckebaum, “Validation of Putative Reference Genes for Gene Expression Studies in Human Hepatocellular Carcinoma Using Real-Time Quantitative RT-PCR,” BMC Cancer, Vol. 8, 2008, p. 350. doi:10.1186/1471-2407-8-350
- H. Schmid, C. D. Cohen, A. Henger, S. Irrgang, D. Schlondorff and M. Kretzler, “Validation of Endogenous Controls for Gene Expression Analysis in Microdissected Human Renal Biopsies,” Kidney International, Vol. 64, No. 1, 2003, pp. 356-360. doi:10.1046/j.1523-1755.2003.00074.x
- R. D. Barber, D. W. Harmer, R. A. Coleman and B. J. Clark, “GAPDH as a Housekeeping Gene: Analysis of GAPDH mRNA Expression in a Panel of 72 Human Tissues,” Physiological Genomics, Vol. 21, No. 3, 2005, pp. 389-395. doi:10.1152/physiolgenomics.00025.2005
- C. Tricarico, P. Pinzani, S. Bianchi, M. Paglierani, V. Distante, M. Pazzagli, S. A. Bustin and C. Orlando, “Quantitative Real-Time Reverse Transcription Polymerase Chain Reaction: Normalization to rRNA or Single Housekeeping Genes Is Inappropriate for Human Tissue Biopsies,” Analytical Biochemistry, Vol. 309, No. 2, 2002, pp. 293-300. doi:10.1016/S0003-2697(02)00311-1
- J. Huggett, K. Dheda, S. Bustin and A. Zumla, “RealTime RT-PCR Normalisation; Strategies and Considerations,” Genes and Immunity, Vol. 6, No. 4, 2005, pp. 279- 284. doi:10.1038/sj.gene.6364190
NOTES
*Corresponding author.