Open Journal of Blood Diseases
Vol.3 No.1(2013), Article ID:29299,7 pages DOI:10.4236/ojbd.2013.31006
ARFGEF2 Knockdown Enhances TNF-α Induced Endothelial Expression of the Cell Adhesion Molecules VCAM1 and ICAM1*
![]()
1Department of Medicine, Boston University School of Medicine, Boston, USA; 2Center for Human Genetics, Boston University School of Medicine, Boston, USA; 3Department of Biostatistics, Boston University School of Public Health, Boston, USA.
Email: klingon@bu.edu
Received December 27th, 2012; revised January 29th, 2013; accepted February 8th, 2013
Keywords: Cell Adhesion Molecules; Endothelium; Hemoglobin; Inflammation; Sickle Cell Disease
ABSTRACT
Sickle cell anemia (SCA) is an autosomal-recessive hemoglobinopathy with a highly variable phenotype. Multiple clinical complications are characteristic of SCA including inflammatory and oxidant damage to both small and large blood vessels, hemolysis, vasoocclusion, and premature mortality. The overall severity of SCA is affected by multiple genetic modifier loci, including ARFGEF2, a gene known to modify TNF-α receptor release from human endothelial cells. In this report, we examine the effect of siRNA mediated knockdown of ARFGEF2 in human pulmonary artery endothelial cells and report that TNF-α induced expression of ICAM1 and VCAM1, both important mediators of endothelial-leukocyte adhesion, is significantly enhanced after ARFGEF2 knockdown. Levels of ICAM-1 protein are also increased in TNF-α treated endothelial cells after ARFGEF2 knockdown; the increased ICAM-1 appears to be localized in the cytoplasm. IL-1β stimulation of endothelial cells without ARFGEF2 produced enhanced ICAM1 expression only. Additionally, ARFGEF2 knockdown distinctly altered endothelial cell morphology. Large-vessel pathology in SCA is believed to begin with endothelial activation by inflammatory cytokines and adhesion of sickle erythrocytes and leukocytes, leading to a progressive vasculopathy characterized by smooth muscle cell migration and proliferation. Understanding how variability in the function of ARFGEF2 alters the response of pulmonary vasculature to TNF-α might suggest new targets for SCA treatment.
1. Introduction
Sickle cell anemia (SCA, HBB glu6val) is an autosomalrecessive hemoglobinopathy characterized by the mutant hemoglobin, HbS. Polymers of HbS form in hypoxic conditions and deform the red blood cell (RBC) altering its rheology, blood viscosity and reducing the RBC lifespan [1,2]. Multiple clinical complications are characteristic of SCA; the specific pattern of disease in individuals is variable and likely, in part, determined by environmental factors and genetic modifier loci [3,4]. Pulmonary vascular disease, particularly the acute chest syndrome and pulmonary hypertension, are among the most common causes of morbidity and mortality in SCA and pulmonary hypertension, in particular, is reflective of disease severity. [5,6] Recently, we reported genetic associations between SCA severity and single nucleotide polymorphisms (SNPs) in the ADP-ribosylation guanine nucleotide exchange factor-2 (ARFGEF2), a gene involved in release of tumor necrosis factor-α (TNF-α) receptor-1 (TNF-R1) from endothelial cells, and reported elevated plasma levels of both soluble TNF-R1 and soluble vascular cell adhesion molecule-1 (VCAM1, VCAM- 1) in subjects with more severe SCA [3,7].
The TNF-α signaling pathway plays key roles in immunity, inflammation, and apoptosis [8] and, in response to stimulation by pro-inflammatory cytokines such as TNF-α and interleukin-1β (IL-1β), endothelial cells (ECs) are activated and up-regulate cell-surface molecules involved in leukocyte-endothelial attachment and leukocyte extravasation, including VCAM-1 and intercellular adhesion molecule-1 (ICAM1, ICAM-1) [8,9]. Appropriate leukocyte-endothelial interactions are necessary for normal immune function [10,11], however, excessive expression of these adhesion molecules can induce vasoocclusive episodes in SCA [12].
ARFGEFs regulate spatiotemporal activation of ADPribosylation factors (ARFs) through their GTP exchange activity [13-15]. ARFs alter membrane biophysics and affect intracellular vesicle formation, the trans-Golgi network, and the recycling endosome system [16]. In this study, we found that ARFGEF2 knockdown alters the release of TNFR1-containing exosome vesicles from human pulmonary artery endothelial cells (HPAEC), similar to what was previously reported in human umbilical vein endothelial cells [17]. We also report that significant alterations in the expression of cell surface adhesion molecules important in endothelial cell activation occurs and that these effects may be independent of the role of ARFGEF2 in release of TNFR1 containing exosomes.
2. Methods
2.1. Cell Culture
HPAECs and primary human microvascular endothelial cells of lung origin (HMVEC-Ls) were purchased from Lonza (Hopkinton, MA) and grown as previously described [18,19]. HPAECs were cultured in Clonetics EBM-2 media (Lonza) supplemented with EGM-2 BulletKits. HMVECs were cultured in identical media supplemented with EGM-2-MV BulletKits (Lonza).
2.2. siRNA Knockdown
Cells were transfected for 72 hours according to the Dharmafect-1 lipofection protocol (Dharmacon, Lafayette, CO). The transfection mix was diluted in OptiMEM I media (Invitrogen, Carlsbad, CA), and contained either media only (“control”), media and vehicle (“mock”), or media, vehicle and siRNA against non-targeting controls (“non-targeting”, Dharmacon siGENOME controls) or against a particular gene (“knock-down”, Dharmacon siGENOME SMART pools).
2.3. Measurement of TNF-R1 Export by ELISA
Media was frozen at −20˚C until use and prior to ELISA measurement, centrifuged sequentially at 200 g (10 minutes), 500 g (10 minutes), 1200 g (20 minutes), and then 10,000 g (30 minutes). Assays were performed in duplicate with a TNF-R1 specific ELISA kit (R & D Biosystems, Minneapolis, MN).
2.4. RNA Isolation and Reverse Transcription
RNA was isolated using an RNAeasy kit with Qiashredder homogenizers (Qiagen, Valencia, CA). RNA concentrations were measured using a NanoDrop spectrophotometer (Fisher Scientific, Pittsburg, PA). cDNA was generated by reverse transcription PCR using TaqMan reverse transcription kits (Applied Biosystems).
2.5. qRT-PCR
Relative expression levels of individual genes were measured in duplicate using quantitative real-time PCR (qRT-PCR) with TaqMan Gene Expression Assays and TaqMan Universal PCR Master Mix, without AmpErase UNG (Applied Biosystems), using 40 cycles of amplification. Expression levels were averaged and referenced to the expression of the housekeeping gene GAPDH from the same sample using the ∆∆Ct method [20].
2.6. Morphological Analysis
Cells were photographed at 10× magnification using a Nikon Digital Sight Ds Ri1 Camera running NIS Elements D 3.0 software attached to a Nikon Eclipse TS100 microscope (Nikon Instruments Inc. Melville, NY). Cellular aspect ratio was measured using ImageJ, and a paired t-test was used for analysis.
2.7. Immunofluorescence
HPAECs were grown on Lab-Tek II two chamber slides (Nalge-Nunc International, Rochester NY) fixed, frozen, and stained with mouse monoclonal ICAM-1 primary antibodies (sc-71294, Santa Cruz Biotechnology, Santa Cruz, CA) followed by Alexa-Fluor-594-conjugated goat anti-mouse secondary antibodies (Invitrogen, Carlsbad, CA). For each chamber, three fields of view were photographed at 20× or 100× magnification with a 750 ms exposure using a Photometric CoolSnap HQ2 camera (Photometrics, Tuscon, AZ) running NIS Elements AR software (Nikon), attached to a Nikon Eclipse TE2000- E microscope (Nikon). Backgroundcorrected mean cellular fluorescent signal intensity was measured for seven cells chosen at random from each field using the NIS Elements software, and compared with a paired t-test.
2.8. Statistical Analyses
Univariate analyses comparing expression of an individual gene under different biological conditions within a single experiment were performed using Mann-Whitney U tests or Student’s t-tests, as appropriate. More complex analyses considering potential interactions were carried out using generalized linear models (GLMs) fit with a top-down search approach. All statistical analyses were performed using R software [21].
3. Results
3.1. Effect of ARFGEF2 Knockdown on EC Response to TNF-α
To examine the role of ARFGEF2 in the endothelial response to TNF-α, we created models of siRNA knockdown. In both HPAECs and HMVECs cultured without TNF-α, ARFGEF2-specific siRNA reduced ARFGEF2 expression to approximately 20% of basal levels as expected. There was no change in TNFSFR1A levels, the gene for TNF-R1 (Figure 1). In HAPECs, ARFGEF2 knockdown decreased 24-hour TNF-R1 export by approximately 19% (Figure 2, 160 ± 9 pg/mL, mean ± SD, compared to 197 ± 12 pg/mL, p-value = 0.004). In contrast, ARFGEF2 knockdown had no effect on TNFR1 export from HMVECs (Figure 2, p-value > 0.05). Because of the cell-specific effect on TNF-R1 export, in the subsequent experiments, we examined the effect of ARFGEF2 knockdown in in HPAECs only.

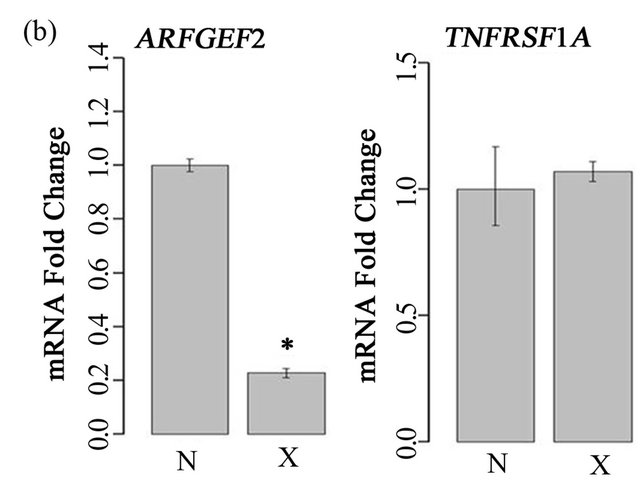
Figure 1. Effect of ARFGEF2 knockdown on expression of ARFGEF2 and TNFRSF1A. (a) mRNA expression of ARFGEF2 and TNFRSF1A in HPAECs transfected with either media only (“C”), media and vehicle (“M”), or media, vehicle and siRNA against non-targeting controls (“N”) or against ARFGEF2 (“X”). *: p-value < 0.05 compared to expression of ARFEGEF2 in cells transfected with siRNA against non-targeting controls (“N”); (b) mRNA expression of ARFGEF2 and TNFRSF1A in un-stimulated HMVECs transfected with media, vehicle and either siRNA against non-targeting controls (“N”) or against ARFGEF2 (“X”). *: p-value < 0.05 compared to expression of ARFGEF2 in cells transfected with siRNA against non-targeting controls (“N”).
3.2. Effect of ARFGEF2 Knockdown on TNF-α Induced VCAM1 and ICAM1 Expression
TNF-α treatment of HPAECs, induced expression of both ICAM1 and VCAM1 significantly, as expected (Figure 3). Treatment of cells with both ARFGEF2 siRNA and TNF-α, however, resulted in a two-fold additional enhancement of ICAM1 and VCAM1 expression above the level of cells treated only with TNF-α. To confirm this finding, results from 4 independent replicate experiments were fit to GLMs involving categorical variables representing ARFGEF2 knockdown and treatment with TNF-α, a bivariate term modeling potential interaction, and a multi-part categorical variable uniquely identifying each
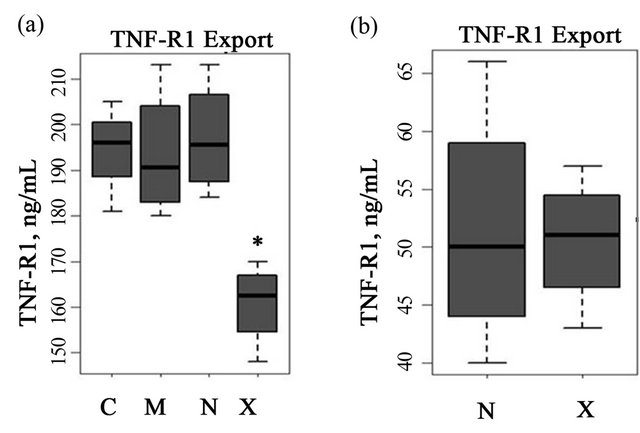
Figure 2. Effect of ARFGEF2 knockdown on TNF-R1 export. (a) TNF-R1 export in HPAECs transfected with either media only (“C”), media and vehicle (“M”), or media, vehicle and siRNA against non-targeting controls (“N”) or against ARFGEF2 (“X”). *: p-value < 0.05 compared to levels in cells transfected with siRNA against non-targeting controls (“N”); (b) TNF-R1 export in un-stimulated HMVECs transfected with media, vehicle and either siRNA against non-targeting controls (“N”) or against ARFGEF2 (“X”). *: p-value < 0.05 compared to levels in cells transfected with siRNA against non-targeting controls (“N”).
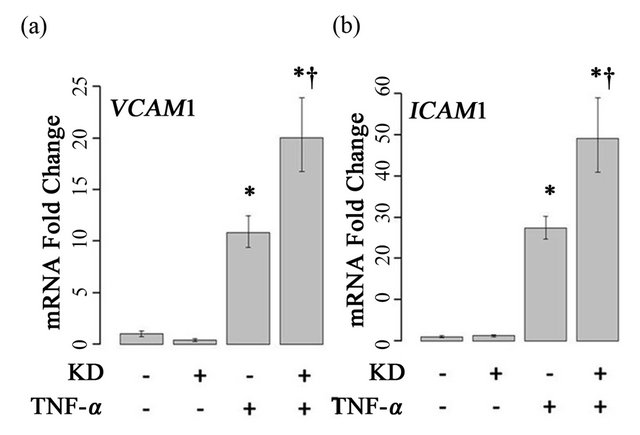
Figure 3. Effects of ARFGEF2 knockdown and TNF-α treatment of HPAECs. mRNA expression of VCAM1 (a) and ICAM1 (b) in HPAECs transfected with non-targeting siRNA (KD−) or siRNA against ARFGEF2 (KD+), with and without TNF-α. Data shown is from a single experiment with six replicates. *: p-value < 0.05 compared to un-stimulated controls, †: p-value < 0.05 compared to stimulated controls.
experiment. A top-down approach was used to search for the most appropriate GLM. For both ICAM1 and VCAM1, the best-fit models included an interaction term between ARFGEF2 knockdown and stimulation with TNF-α, indicating that ARFGEF2 knockdown modifies the effect of TNF-α on the expression of VCAM1 and ICAM1. (E(CAM)~KD +TNF+KD*TNF, p-values = 9.6 × 10⁻⁴, and 9.0 × 10⁻¹², respectively). The best-fit models did not include an experimental identifier term, confirming that the observed effects of ARFGEF2 knockdown on TNF-α induced expression of ICAM1 and VCAM1 were stable across all experiments.
To determine if ARFGEF2 knockdown altered the time course of ICAM1 and VCAM1 expression, HPAECs were treated with 20 ng/mL of TNF-α with and without ARFGEF2 knockdown for 1, 2, 4, 8, 16, or 32 hours (3 replicates each). VCAM1 expression rose rapidly and peaked at 4 hours followed by a rapid decline between 4 and 8 hours. ICAM1 expression showed a different pattern of increase and levels rose steadily throughout the experiment. These patterns of expression were qualitatively the same after ARFGEF2 knockdown (Figure 4(a)). Increasing doses of TNF-α in control cells yielded marginal increases in the expression levels of both VCAM1 and ICAM1 and, except for absolute levels, the same pattern was observed in the cells with ARFGEF2 knockdown (Figure 4(b)).
3.3. Effect of ARFGEF2 Knockdown on HPAEC Response to IL-1β
We next examined if ARFGEF2 knockdown would alter HPAEC expression of ICAM1 and VCAM1 after treatment with IL-1β, another cytokine known to activate endothelial cells. Treatment with 20 ng/mL of IL-1β for 2-hours increased expression of VCAM1 and ICAM1 by approximately 17-fold and 12-fold, respectively (p-values = 0.005 and 0.008). After ARFGEF2 knockdown, expression of ICAM1 was further increased to approximately 30-fold over control levels. Expression of VCAM1 was unchanged compared to stimulation with IL-1β alone (p-values = 0.045 and 0.98, respectively). Data from a representative experiment is shown in Figure 5.
3.4. Effect of ARFGEF2 Knockdown on ICAM-1 Protein Expression
To determine if ARFGEF2 knockdown alters ICAM-1 protein expression, HPAECs were immunostained with antibodies against ICAM-1. In the absence of TNF-α, no ICAM-1 staining was observed. There was intense ICAM-1 staining after TNF-α treatment, and the combination of ARFGEF2 knockdown and TNF-α treatment, resulted in an additional increase in fluorescent staining compared with TNF-α treatment alone (Figures 6(a) and (b)). Quantitative image analysis showed a mean ICAM-1 staining per cell of 1859 ± 113 counts for both TNF-α and ARFGEF2 knockdown, compared to 1422 ± 63 counts (p-value = 0.0094, Figure 6(c)) for the cells treated with TNF-α alone. The increase in ICAM-1 protein expression is consistent with increases in gene expression due to ARFGEF2 knockdown. A large portion of the staining in TNF-α/ARFGEF2 knockdown cells
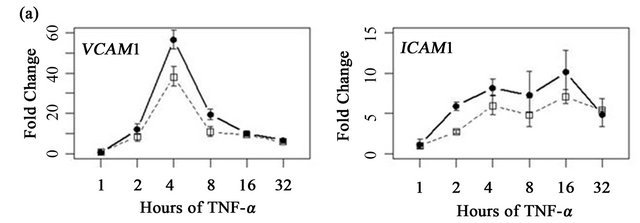
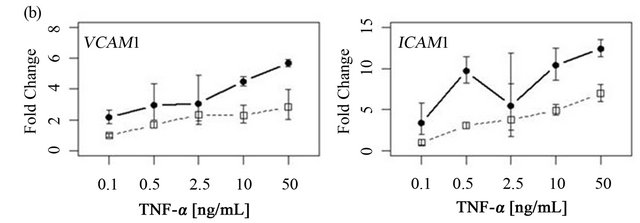
Figure 4. Time course and dose-response curves of HPAEC response to TNF-α. (a) Expression levels of VCAM1 and ICAM1 were measured by qRT-PCR in HPAECs with or without ARFGEF2 knockdown (n = 3 replicates each) after stimulation with 20 ng/mL of TNF-α for 1, 2, 4, 8, 16, or 32 hours; (b) Expression levels of VCAM1 and ICAM1 were measured by qRT-PCR in HPAECs with or without ARFGEF2 knockdown (n = 3 replicates each) after stimulation with 0.1, 0.5, 2.5, 10, or 50 ng/mL of TNF-α for 4 hours.
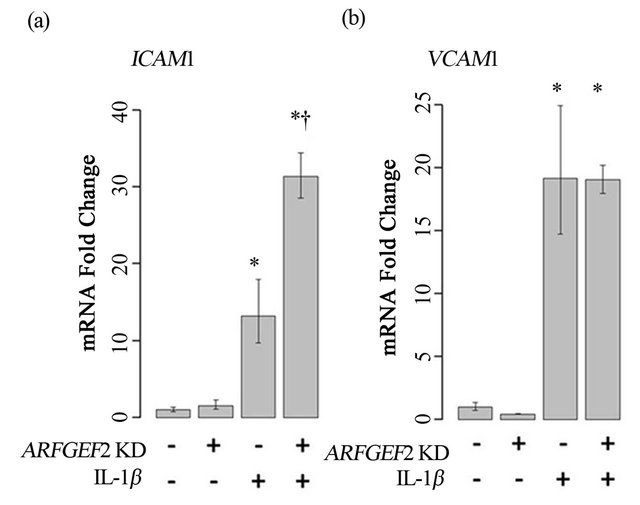
Figure 5. Treatment of HPAECs with IL-1β. ICAM1 (a) and VCAM1 (b) levels in HPAECs transfected with non-targeting siRNA (KD−) or siRNA against ARFGEF2 (KD+) with or without IL-1β. Data shown is from a single experiment with three replicates. *: p-value < 0.05 compared to unstimulated controls, †: p-value < 0.05 compared to stimulated controls.
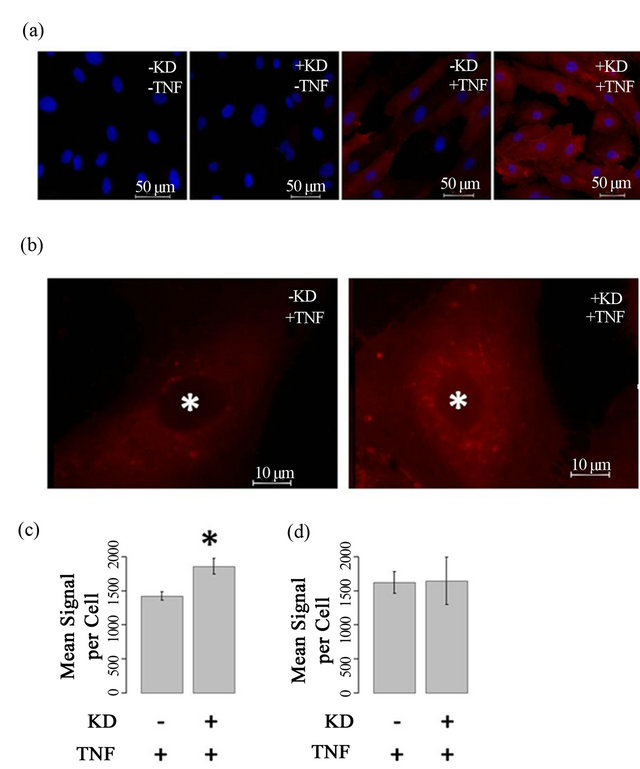
Figure 6. ARFGEF2 knockdown alters intensity and pattern of ICAM-1 immunofluorescence (a) and (b) HPAECs with and without ARFGEF2 knockdown (KD±) were treated with and without TNF-α (TNF±) and stained for ICAM-1 (red). Nuclei were counterstained with DAPI (blue). Representative images taken at 20×, 750 ms exposure (a) or 100×, 750 ms exposure (b); (c) Quantification of mean fluorescence-per-cell for total-cell ICAM-1. *: p-value < 0.05 compared to total-cell ICAM-1 in stimulated control cells; (d) Quantification of mean fluorescence-per-cell for cell-surface ICAM-1.
occurred in a peri-nuclear, punctate pattern reminiscent of vesicular staining. To examine cell surface levels of ICAM-1, cells were not treated with Triton and the ICAM1 staining was similar between untreated and ARFGEF2 knockdown cells indicting that the increased levels of ICAM1 are intercellular (1621 and 1647 counts, respectively, p-value = 0.89, Figure 6(d)). We also noted that ARFGEF2 knockdown produced a change in unstimulated HPAECs morphology that was appreciable on bright-field microscopy. The cells became elongated with some areas of local cell-cell alignment (Figure 7). Measurement of the cellular aspect ratio, defined as the ratio of major to minor axes, confirmed that ARFGEF2 knockdown resulted in significantly higher aspect ratios (p-value = 0.027).
4. Discussion and Conclusions
Exposure to TNF-α activates endothelial cells leading to up-regulation and enhanced cell-surface expression of multiple proteins including ICAM-1 and VCAM-1. This process is an important first step in the normal response of the endothelium to inflammatory signals. Excessive or persistent activation of endothelial cells is suspected to contribute to vasoocclusive events in SCA. ARFGEF2, also known as BIG2, was previously reported to modulate the extracellular release of TNF-R1 containing vesicles by HUVECs [17] and we report a similar response in HPAECs. Since these TNF-R1 containing vesicles can sequester TNF-α and reduce TNF-α availability to EC’s, we hypothesized that ARFGEF2 levels may alter EC activation by TNF-α and that this pathway may be an important modulator of disease severity in SCA.
The effect of TNF-α with ARFGEF2 knockdown was not previously examined in endothelial cells. In the presence of TNF-α, we found that ARFGEF2 knockdown results in a large number of additional changes not previously suspected. Specifically, we found that ARFGEF2 knockdown enhances expression of the cell adhesion molecules ICAM1 and VCAM1. In dose-response experiments, the increase in VCAM1 and ICAM1 due to ARFGEF2 knockdown was similar across all concentrations of TNF-α suggesting the altered sequestration of
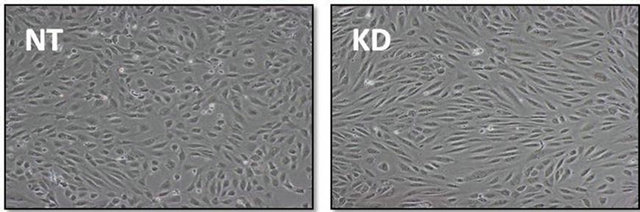
Figure 7. Effect of ARFGEF2 knockdown on HPAEC morphology. Bright field microscopy of HPAECs with nontargeting siRNA (NT) or siRNA for ARFGEF2 (KD) taken at 10× magnification.
TNF-α by TNF-R1 containing vesicles is not an important factor in this observation.
Recently, we reported a genetic association between SCA disease severity and single nucleotide polymerphisms (SNPs) in ARFGEF2 as well as demonstrated elevated TNF-R1 and VCAM-1 levels in the serum of subjects with severe SCA compared to those with less severe disease [7]. Together with the observation that ARFGEF2 modulates VCAM1 and ICAM1 expression, this suggests that genetic polymorphisms in ARFGEF2 may alter either its function or expression level in the endothelium. This may contribute to a pro-inflammatory response to TNF-α, which may predispose some SCA patients to more severe disease.
The increased ICAM-1 protein expression observed in HPAECs after ARFGEF2 knockdown and TNF-α stimulation was located in a peri-nuclear punctate pattern, suggestive of its presence in vesicles. Given the role of ARFGEF2 in intracellular vesicle transport and vesicle formation [13], disruptions in the trans-Golgi network and the recycling endosome would be expected. Since ICAM-1 can undergo recycling in the cell [22], we suggest that the observed increase in ICAM-1 protein may be the result of abnormal vesicle trafficking. However, the mechanism by which ARFGEF2 knockdown results in an increase in ICAM-1 mRNA is unclear. Perhaps abnormal VCAM-1/ICAM-1 trafficking activates a feedback mechanism to ensure proper cell-surface delivery of ICAM-1 after TNF-α stimulation.
We hypothesize that there are multiple mechanisms by which ARFGEF2 can influence endothelial cell biology and the response to inflammation, including, but not limited to, its role in altering TNF-R1 export. Since EC activation by inflammatory cytokines, such as TNF-α and IL-1β, and subsequent adhesion of sickle erythrocytes and leukocytes are thought to be one of the primary mechanisms of the vascular pathology of SCA, these findings are clinically relevant as they identify a potential new pathway to target pharmacologically [23,24]. Further work needs to be done to elucidate the exact mechanism by which ARFGEF2 alters VCAM-1 and ICAM-1 expression within the pulmonary vascular endothelium and to define the contribution of this pathway to vasoocclusion in SCA. It is through this work that potentially novel therapeutics for this disease may be developed.
REFERENCES
- G. A. Barabino, M. O. Platt and D. K. Kaul, “Sickle Cell Biomechanics,” Annual Review of Biomedical Engineering, Vol. 12, 2010, pp. 345-367. doi:10.1146/annurev-bioeng-070909-105339
- R. P. Hebbel, “Beyond Hemoglobin Polymerization: The Red Blood Cell Membrane and Sickle Disease Pathophysiology,” Blood, Vol. 77, No. 2, 1991, pp. 214-237.
- P. Sebastiani, et al., “Genetic Modifiers of the Severity of Sickle Cell Anemia Identified through a Genome-Wide Association Study,” American Journal of Hematology, Vol. 85, No. 1, 2010, pp. 29-35.
- M. H. Steinberg, “Predicting Clinical Severity in Sickle Cell Anaemia,” British Journal of Haematology, Vol. 129, No. 4, 2005, pp. 465-481. doi:10.1111/j.1365-2141.2005.05411.x
- E. S. Klings and H. W. Farber, “Pulmonary Hypertension as a Risk Factor for Death in Patients with Sickle Cell Disease.” The New England Journal of Medicine, Vol. 350, 2004, pp. 2521-2522. doi:10.1056/NEJM200406103502418
- M. T. Gladwin and E. Vichinsky, “Pulmonary Complications of Sickle Cell Disease,” The New England Journal of Medicine, Vol. 359, 2008, pp. 2254-2265. doi:10.1056/NEJMra0804411
- D. A. Dworkis, et al., “Severe Sickle Cell Anemia Is Associated with Increased Plasma Levels of TNF-R1 and VCAM-1,” American Journal of Hematology, Vol. 86, No. 2, 2011, pp. 220-223. doi:10.1002/ajh.21928
- L. A. Madge and J. S. Pober, “Tnf Signaling in Vascular Endothelial Cells,” Experimental and Molecular Pathology, Vol. 70, No. 3, 2001, pp. 317-325. doi:10.1006/exmp.2001.2368
- G. Molema, “Heterogeneity in Endothelial Responsiveness to Cytokines, Molecular Causes, and Pharmacological Consequences,” Seminars in Thrombosis and Hemostasis, Vol. 36, No. 3, 2010, pp. 246-264. doi:10.1055/s-0030-1253448
- G. Chen and D. V. Goeddel, “TNF-R1 Signaling: A Beautiful Pathway,” Science, Vol. 296, No. 5573, 2002, pp. 1634-1635. doi:10.1126/science.1071924
- K. Ley, C. Laudanna, M. I. Cybulsky and S. Nourshargh, “Getting to the Site of Inflammation: The Leukocyte Adhesion Cascade Updated,” Nature Reviews Immunology, Vol. 7, 2007, pp. 678-689. doi:10.1038/nri2156
- A. Turhan, L. A. Weiss, N. Mohandas, B. S. Coller and P. S. Frenette, “Primary Role for Adherent Leukocytes in Sickle Cell Vascular Occlusion: A New Paradigm,” Proceedings of the National Academy Sciences of the USA. Vol. 99, No. 5, 2002, pp. 3047-3051. doi:10.1073/pnas.052522799
- M. Zeghouf, B. Guibert, J. C. Zeeh and J. Cherfils, “Arf, Sec7 and Brefeldin A: A Model towards the Therapeutic Inhibition of Guanine Nucleotide-Exchange Factors,” Biochemical Society Transactions, Vol. 33, 2005, pp. 1265- 1268. doi:10.1042/BST20051265
- H. W. Shin, N. Morinaga, M. Noda and K. Nakayama, “Big2, a Guanine Nucleotide Exchange Factor for ADPRibosylation Factors: Its Localization to Recycling Endosomes and Implication in the Endosome Integrity,” Molecular Biology of the Cell, Vol. 15, No. 12, 2004, pp. 5283-5294. doi:10.1091/mbc.E04-05-0388
- F. Boal and D. J. Stephens, “Specific Functions of BIG1 and BIG2 in Endomembrane Organization,” PLoS One, Vol. 5, 2010, p. e9898. doi:10.1371/journal.pone.0009898
- N. Segev, “Coordination of Intracellular Transport Steps by Gtpases,” Seminars in Cell & Developmental Biology, Vol. 22, No. 1, 2011, pp. 33-38. doi:10.1016/j.semcdb.2010.11.005
- A. Islam, X. Shen, T. Hiroi, J. Moss, M. Vaughan and S. J. Levine, “The Brefeldin A-Inhibited Guanine NucleotideExchange Protein, BIG2, Regulates the Constitutive Release of TNFR1 Exosome-Like Vesicles,” Journal of Biological Chemistry, Vol. 282, 2007, pp. 9591-9599. doi:10.1074/jbc.M607122200
- S. Safaya, E. S. Klings, A. Odhiambo, G. Li, H. W. Farber and M. H. Steinberg, “Effect of Sodium Butyrate on Lung Vascular TNFSF15 (TL1A) Expression: Differential Expression Patterns in Pulmonary Artery and Microvascular Endothelial Cells,” Cytokine, Vol. 46, No. 1, 2009, pp. 72-78. doi:10.1016/j.cyto.2008.12.013
- E. S. Klings, et al., “Differential Gene Expression in Pulmonary Artery Endothelial Cells Exposed to Sickle Cell Plasma,” Physiological Genomics, Vol. 21, No. 3, 2005, pp. 293-298. doi:10.1152/physiolgenomics.00246.2004
- K. J. Livak and T. D. Schmittgen, “Analysis of Relative Gene Expression Data Using Real-Time Quantitative PCR and the 2(-Delta Delta c(t)) Method,” Methods, Vol. 25, No. 4, 2001, pp. 402-408. doi:10.1006/meth.2001.1262
- Team RDC, “R: A Language and Environment for Statistical Computing,” 2009.
- S. Muro, C. Gajewski, M. Koval and V. R. Muzykantov, “Icam-1 Recycling in Endothelial Cells: A Novel Pathway for Sustained Intracellular Delivery and Prolonged Effects of Drugs,” Blood, Vol. 105, No. 2, 2005, pp. 650- 658. doi:10.1182/blood-2004-05-1714
- M. T. Gladwin and E. Vichinsky, “Pulmonary Complications of Sickle Cell Disease,” New England Journal of Medicine, Vol. 359, 2008, pp. 2254-2265. doi:10.1056/NEJMra0804411
- O. S. Platt, “Preventing Stroke in Sickle Cell Anemia,” New England Journal of Medicine, Vol. 353, pp. 2743- 2745. doi:10.1056/NEJMp058274
NOTES
*This work was supported by NIH grants 5T32 HL007501 and R01 HL 068970.
The authors have no conflict of interest to report.