Natural Resources
Vol.4 No.8(2013), Article ID:41454,20 pages DOI:10.4236/nr.2013.48063
Powder River Basin Coal: Powering America
![]()
School of Energy Resources, University of Wyoming, Laramie, USA.
Email: tconsidi@uwyo.edu
Copyright © 2013 Timothy J. Considine. This is an open access article distributed under the Creative Commons Attribution License, which permits unrestricted use, distribution, and reproduction in any medium, provided the original work is properly cited. In accordance of the Creative Commons Attribution License all Copyrights © 2013 are reserved for SCIRP and the owner of the intellectual property Timothy J. Considine. All Copyright © 2013 are guarded by law and by SCIRP as a guardian.
Received September 28th, 2013; revised October 30th, 2013; accepted November 20th, 2013
Keywords: Coal; Scale Economies; Natural Gas; Electricity; Environment
ABSTRACT
Powder River Basin (PRB) coal in Wyoming and Montana is used to produce 18 percent of the electricity consumed in the United States. Coal production from the PRB more than doubled between 1994 and 2009. PRB coal companies produced greater amounts of coal at declining real prices over much of this period through investment in equipment and production systems that achieved massive economies of scale. The bulk of PRB coal is shipped to the middle part of America from Texas in the south to Michigan in the north and New York in the east. States that consume significant amounts of PRB coal have electricity rates well below the national average. The largest industrial users of electricity are in these regions. Replacing PRB coal would require almost 5.5 trillion cubic feet of natural gas per year, representing a 26 percent increase in demand. Such an increase in gas consumption would increase prices for natural gas by roughly 76 percent. In such a world, U.S. energy users would pay $107 billion more each year for electricity and natural gas. Hence, by using PRB coal, the U.S. economy avoids $107 billion per year in higher energy costs. Estimates reported in the literature indicate that the gross environmental damages from PRB coal production are $27 billion. Hence, the net social benefits of PRB coal are $80 billion per year. Given the large size and low cost of these reserves, PRB coal will likely supply societal energy needs well into the future as long as the public and their elected officials are willing to accept the environmental impacts in return for the substantial economic benefits from using PRB coal.
1. Introduction
Energy is a key factor in economic development, transforming agrarian societies to modern industrial ones. This societal transformation driven by the accumulation of income and wealth eliminates many contagious diseases, reduces child mortality, and lengthens adult life expectancy. This virtuous cycle has been demonstrated over the past two centuries in dozens of countries around the world. The emergence from poverty begins as countries develop transportation systems using petroleum and electricity networks, often based upon coal. These technologies are capable of achieving massive economies of scale that provide large amounts of energy at low cost. These abundant and reliable supplies of energy spur technological change, productivity gains and ultimately economic growth, improving the living standards of millions of people. Ayers and Warr [1] recognize the critical importance of energy in economic growth, observing that energy enables technology to utilize capital and labor resources.
It is no coincidence that the world energy complex is built upon fossil fuels. Consumers prefer low-cost, reliable energy and producers who provide these services prosper. Based upon data reported by British Petroleum [2], during 2012, the world economy derived 87.3% of its total energy from coal, oil, and natural gas, which was up from 86.8% in 2002. The share of coal in world energy consumption actually increased from 25.1% in 2002 to 26.3% in 2012. These fuels have empowered modern industrial societies to raise living standards for billions of people. Of the 12.7% of carbon-free energy used worldwide during 2012, 6.0% is nuclear, 6.0% is hydroelectric power, and the remaining 0.7% is renewable energy.
One of the largest low-cost sources of energy on the planet is the Powder River Basin (PRB) coal reserve in Wyoming and Montana. Unlike Eastern U.S. coal deposits that average a few feet in thickness, PRB coal seams are as tall as eight-story office buildings. Coupled with advanced mining technology and efficient transportation systems, these enormous coal seams enable incredible economies of scale and low production costs as described by Gerking and Hamilton [3]. In addition, PRB coal has very low sulfur content, allowing some electricity producers to use it directly without installing and operating expensive pollution control equipment [4].
The expanded use of PRB coal has generated important economic and environmental benefits for the United States. The rising market share of PRB coal was one of the key factors contributing to falling real electricity prices during much of the 1980s and 1990s. Lower electricity costs encourage the adoption of advanced electricityusing technologies that reduce the direct use of fossil fuels and increase end-use energy efficiency in a wide range of applications. These technologies augment productivity growth, which is the key driver for higher per capita income and wealth.
The goal of this paper is to estimate the importance of PRB coal to the U.S. economy. The paper is organized as follows. Section two provides an overview of energy and economic development. Along this, continuum is another important linkage between energy and productivity growth, which is the focus of section three. The fourth section provides an overview of the rise of PRB coal. The driving forces encouraging its use are identified and discussed in the fifth section. The role of PRB coal in providing low-cost and clean electricity to more than 30 states is then examined in section six. To appreciate how important a cog PRB coal is to the U.S. electricity sector, the impacts on electricity rates of replacing Wyoming PRB coal with natural gas are estimated in section seven. The results reveal that electricity rates would increase substantially. While such a switch is unlikely for a variety of economic and political reasons, this exercise illustrates the opportunity cost of not using PRB coal and, hence, its value to the U.S. economy. These benefits are then compared with the social costs arising from the environmental damages from coal-fired electricity production. The paper then discusses the challenges and opportunities for the utilization of PRB coal before the concluding section.
2. Energy and Economic Development
Energy plays an important role in economic development. The discovery of large fossil fuel reserves and the development of technology to deliver energy from these resources literally provide the fuel for an economic growth engine in which declining costs for energy contribute to lower prices for goods and services and an increase in demand for this lower priced output, which then drives costs down further due to economies of scale and learning effects [1]. The United States during the late 19th and early 20th century provides a classic example of this growth engine. China is in a similar situation today providing an example of how coal can be used to pull people out of poverty and lift an entire society to higher living standards. India and many other countries around the world are learning from China’s example.
Energy provides basic services for human existence, such as light for reading and fuel for cooking. Barnes and Floor [5] describe a continuum of different fuels used through various stages of economic development, known as the “energy ladder.” For subsistence cultures, energy tends to come from harvested or scavenged biological resources, such a wood and dung. During the intermediate stage, processed biofuels, such as charcoal, animal power and some commercial fossil fuels are consumed. Liquid fuels, natural gas, and electricity are widely used during the last stage of industrialization.
These stages entail different resource requirements with labor intensity falling and capital intensity rising as the economy advances. For example, households relying upon wood for cooking devote considerable amounts of labor to collect firewood. During the intermediate stages, some capital outlays are required for kerosene lamps or coalfired cook stoves [5]. Much more capital is required during the final stage of development to build electricity and natural gas supply networks.
Expanded energy availability leads to a disproportionate increase in productivity and economic growth. The first source of these gains arises from the expanded use of commercial energy by households. Consider the shift from kerosene to electric lighting. As the price of light declines, more illumination services are consumed, which leads to a direct increase in economic welfare. For example, people can read and learn during the evening hours. There is a second round effect stemming from the productivity enhancements that light provides. Households can divert hours once spent gathering firewood to working in the market economy, which generates income for the household and labor services for the economy [5]. In addition, with inexpensive illumination household members can devote time at night to improving literacy and education capacity. These productivity enhancements lead to an additional increase in the demand for lighting that contributes even more economic welfare for society.
Besides raising households from the depths of poverty, increased energy availability contributes to the construction of infrastructure and buildings and the manufacturing of durable producer equipment. These durable assets are made from materials, such as steel, aluminum, copper, concrete, and glass. Producing these materials requires significant amounts of energy [6]. Utilizing abundant energy supplies helps lower the cost of materials, structures and equipment, which facilitate the accumulation of capital assets.
All economies advancing into the industrialization stage go through this phase of infrastructure development. For example, during the period from 1880 to 1920 the United States experienced material intensive economic development so that energy intensity, or the ratio of energy consumption to gross domestic product, was rising. China is at a similar stage in recent years. For analysis of how materials affect economic development see Considine [7] and Van Den Bergh and Janssen [8].
Greater energy availability also may enhance the productivity of energy infrastructure investments, leading to lower transportation costs and expanding the geographic size, scale, and efficiency of markets. Efficient electricity networks also generate positive economic externalities by lowering the costs of telecommunications and information, which in turn generate additional productivity enhancements.
Case studies done by the Office of Technology Assessment (OTA) [9,10] provide definitive evidence of how energy service availability spurs economic growth. In addition, the World Development Report by the World Bank [11] discusses the importance of infrastructure provision to economic development. The OTA studies [9,10] identify how much labor time is invested in subsistence energy provision and how much inefficient manual labor is used for activities that could be accomplished with simple machines powered by external energy sources.
On the business side of the economy, greater supplies of energy and lower costs for energy services foster:
• Economies of scale from larger scale energy provision, such as petroleum refineries and electric power generation• Lower transportation costs and more competitive manufacturing, and
• The development of communication networks that generate productivity enhancements across broad swaths of the economy Therefore, household and business sector impacts contribute to an overall increase in the quality of life, including better health, less drudgery, more leisure, greater communication, and increased social status.
All of these factors contribute to a strong positive correlation between economic output and energy use, which also generates greenhouse gas emissions. The growth in greenhouse gas emissions, however, has been less than the rate of growth in gross domestic product (GDP) due to energy efficiency gains, energy conservation, and switching to less carbon intensive fuels. For example, during the 1950s real U.S. GDP grew at a 4% annual rate while CO2 emissions from energy rose 2.4%. From 1960 to 1973, the growth rates were 4.1% and 3.7% respectively. CO2 emissions increased only 0.7% from 1974 to 1986 while GDP growth also slowed to 2.8%. During the next two decades from 1988 to 2011, real GDP rose 2.5% per annum while CO2 emissions grew 0.6% per year. In 1950, the carbon intensity of GDP was 1.34 million metric tons of carbon dioxide per billion dollars of GDP. By 2011, the carbon intensity of GDP was 0.41 million metric tons per billion dollars of GDP. So as the economy grows, carbon intensity, defined as CO2 per dollar of GDP, falls [12].
These improvements in carbon intensity arise largely from productivity growth that ultimately comes from higher levels of investment, spurred by expectations of higher sales from greater economic growth. There are many sources of productivity growth—education, training, technological innovations, and notably reliable and low-cost supplies of energy. A closer look at the energy connection now follows.
3. Energy and Productivity Growth
Schurr [13] maintains that the increased use of more flexible energy forms, liquid fuels and especially electricity enhanced “the discovery, development, and use of new processes, new equipment, new systems of production, and new industrial locations.” The effect was powerful enough in terms of raising labor and capital productivity that the energy intensity of output fell. In other words, changes in the quality of energy services drive broader economic productivity, apart from the physical availability of energy.
Economists have long sought to accurately measure and identify the key drivers for productivity growth. Multifactor productivity is defined as total output divided by all factor inputs. Output growth in excess of the growth of inputs is known as the rate of technical progress. Economists have used a variety of advanced econometric methods to identify the separate contributions of input growth and technical change in multifactor productivity growth. Studies by Jorgenson [14,15] disaggregate technical change into several components, including that portion of productivity growth associated with the use of electricity. Jorgenson finds that for 23 of 35 sectors of the economy, technical progress tended to be electricity using, which emphasizes the connection between electrification and broader economic progress. In addition, 28 sectors had technical progress that were non-electric energy using. So the relationship between technical change and energy use is pervasive. Jorgenson’s studies clearly demonstrate that technical progress is associated with energy use. Overall, Jorgenson finds that for 32 of the 35 sectors of the economy, energy-using technical change occurred. By symmetry, this finding suggests that higher energy prices act as a drag on productivity growth.
Another important dimension is energy reliability, especially for electricity. The costs of electricity supply interruptions per lost megawatt hour are several orders of magnitude larger than the cost of base load or peak electricity supply costs [10]. These costs arise from the need to maintain backup generators that could have been more productively employed under greater system reliability.
While the growing use of microcomputers and the Internet gets a good share of the credit for the impressive productivity growth in the U.S. economy since the late 1980s, based upon the findings of Schurr [13] and Jorgenson [14,15], falling real electricity prices at least should be considered as a contributing factor. One of the key factors contributing to the fall in the real price of electricity during the 1980s and 1990s was the development of Powder River Basin coal. This is an important lesson of how advances in a basic industry can have broad ramifications for our entire economy. A closer look at the Powder River Basin now follows.
4. The Emergence of Powder River Basin Coal
Great energy reserves have played an important role in economic development and national strategy. The giant oil field in East Texas that went into production during the Great Depression allowed America to power the Allied war effort during World War II. The super-giant oil fields of the Middle East developed during the 1950s fueled the Marshall Plan for rebuilding Western Europe and Japan after the war. Together these fields contributed to strong, non-inflationary economic growth from 1948 to 1972 by supplying large amounts of energy at low and stable prices.
Similar to the aftermath of the oil price shocks during the 1970s and 1980s, the world has emerged from a deep recession after record high oil and natural gas prices during 2008. Unlike the cartel actions that contributed to earlier price shocks, energy supply constraints were the principal culprit for the 2008 oil and natural gas price spike. As the world renews its search for new energy reserves, Powder River Basin coal may play an important role.
The Powder River Basin (PRB) in eastern Wyoming and Montana contains one of the largest and lowest-cost sources of energy on the planet. According to a recent assessment by Luppens et al. [16], the PRB has over 200 billion short tons of coal in place, which is equivalent to over 3616 quadrillion British Thermal Units (quads) (see Table 1). According to Luppens et al. [16] technically recoverable reserves are 77 billion tons but these reserves increase considerably with higher market prices for coal. Boyd [17] estimates 620 billion tons of PRB coal in place.
Using the 200 billion ton reserve estimate for PRB coal as a basis for comparison, the next largest energy reserve, the North Dome-South Pars natural gas field in the Middle East, is a distant second at 1228 quads. Ghawar, the world’s largest oil field in Saudi Arabia has 418 quads in reserve.
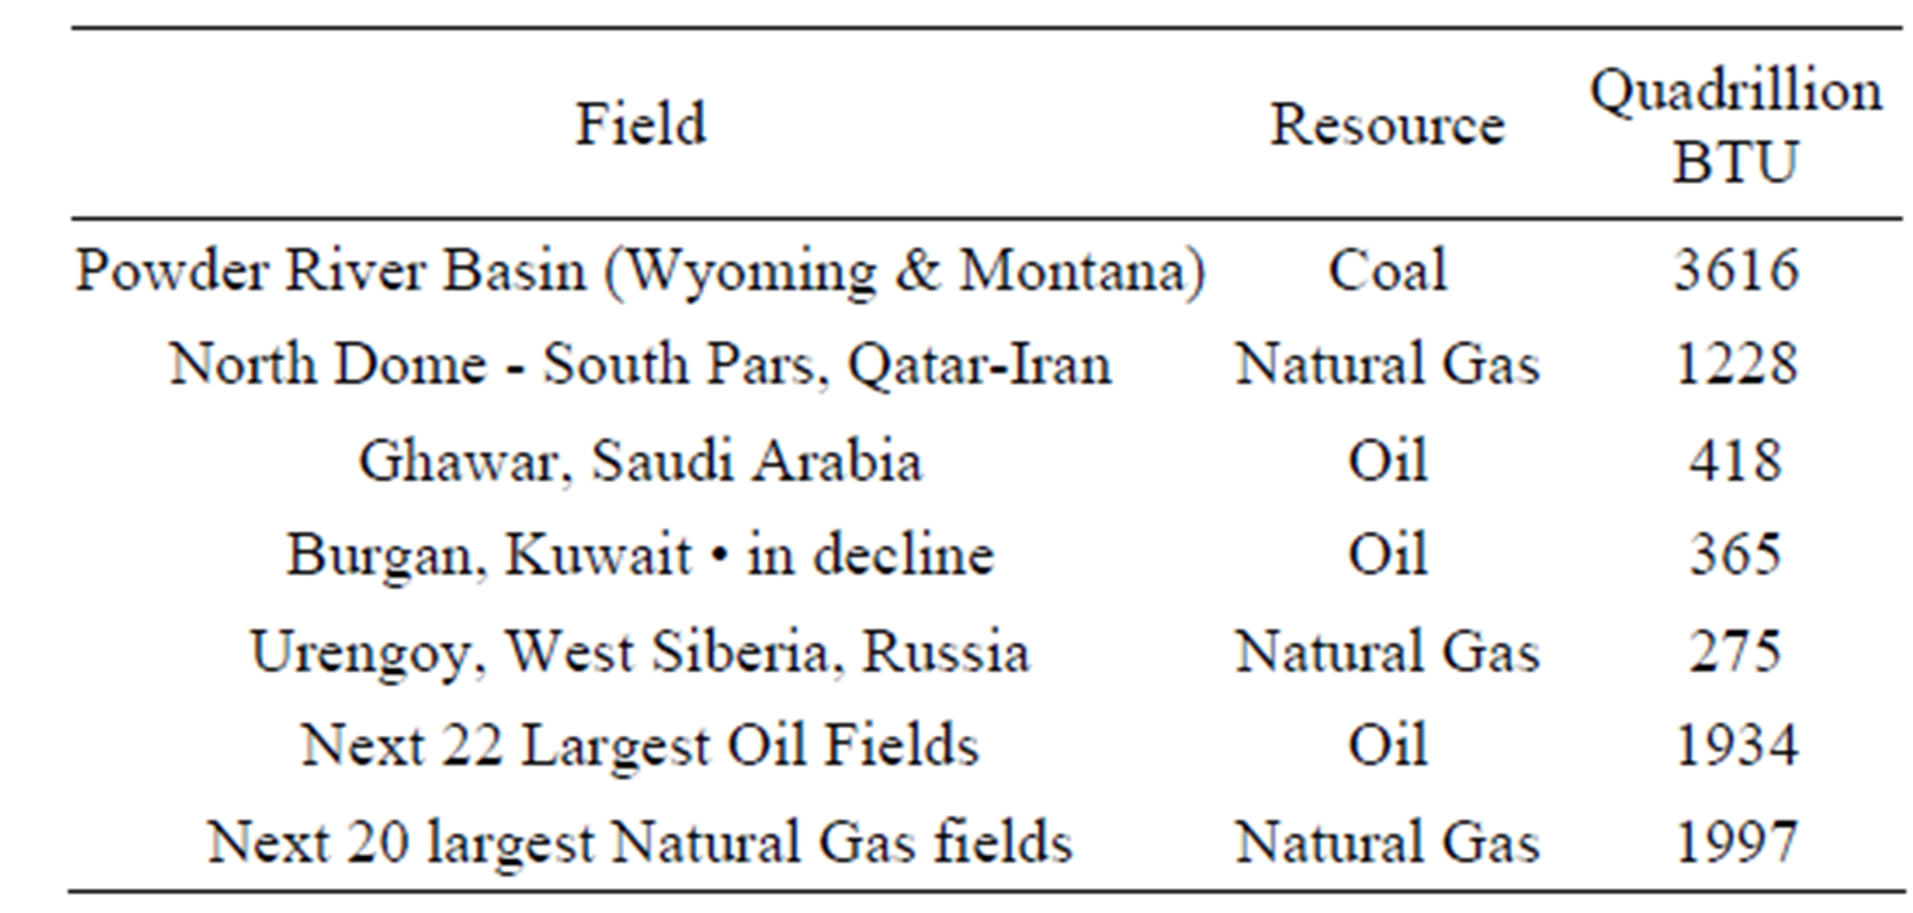
Table 1. Comparative Size of Powder River Basin Coal Reserves.
At current production rates of roughly 400 million tons per year, Powder River Basin technically recoverable reserves would support over 192 years of continuous coal production. Even if production doubled, there would be enough reserves to last over 95 years. As mining technology and extraction strategies continue to advance, additional PRB reserves could be produced that would extend the production horizon to the distant future.
The Powder River Basin is in northeast Wyoming and southeast Montana, measuring approximately 120 miles from east to west and about 200 miles from north to south. Most of the coal being mined there now comes from a relatively narrow string of mines located in the green shaded area in Figure 1.
The coal deposits formed about 60 million years ago when the land began uplifting from a shallow sea. During that time, the local climate was subtropical with about 120 inches of annual rainfall. Organic material collected into peat bogs on the basin floor for over 25 million years. Sediments from mountain runoff buried the peat, compressed it, and converted it into coal. Over the last several million years, the overlying sediment eroded, leaving the coal seams relatively near the surface.
The Powder River Basin coal producing area includes two counties in Wyoming, Campbell and Converse, and two in Montana, Big Horn and Rosebud. Campbell County with Gillette as the center is by far the largest producing area within the PRB.
The first coal mine in the Powder River Basin dates back to the 1920s, but large-scale open cut mining did not begin until the 1970s. By 1994, the PRB was producing more than 250 million tons, which was 25% of total U.S. coal production (see Figure 2). After growing at a 4.8% annual rate from 1994 to 2008, total PRB coal production reached almost 496 million tons in 2008, constituting 42.3% of U.S. coal production. Non-PRB coal production increased only 0.8% per annum over the same period. Since 2008, PRB coal production has declined 6.7 percent due to fuel switching in the electric utility sector from coal to natural gas and from the closure of coal-fired coal plants as they reached the end of their useful life or faced higher costs arising from envi-
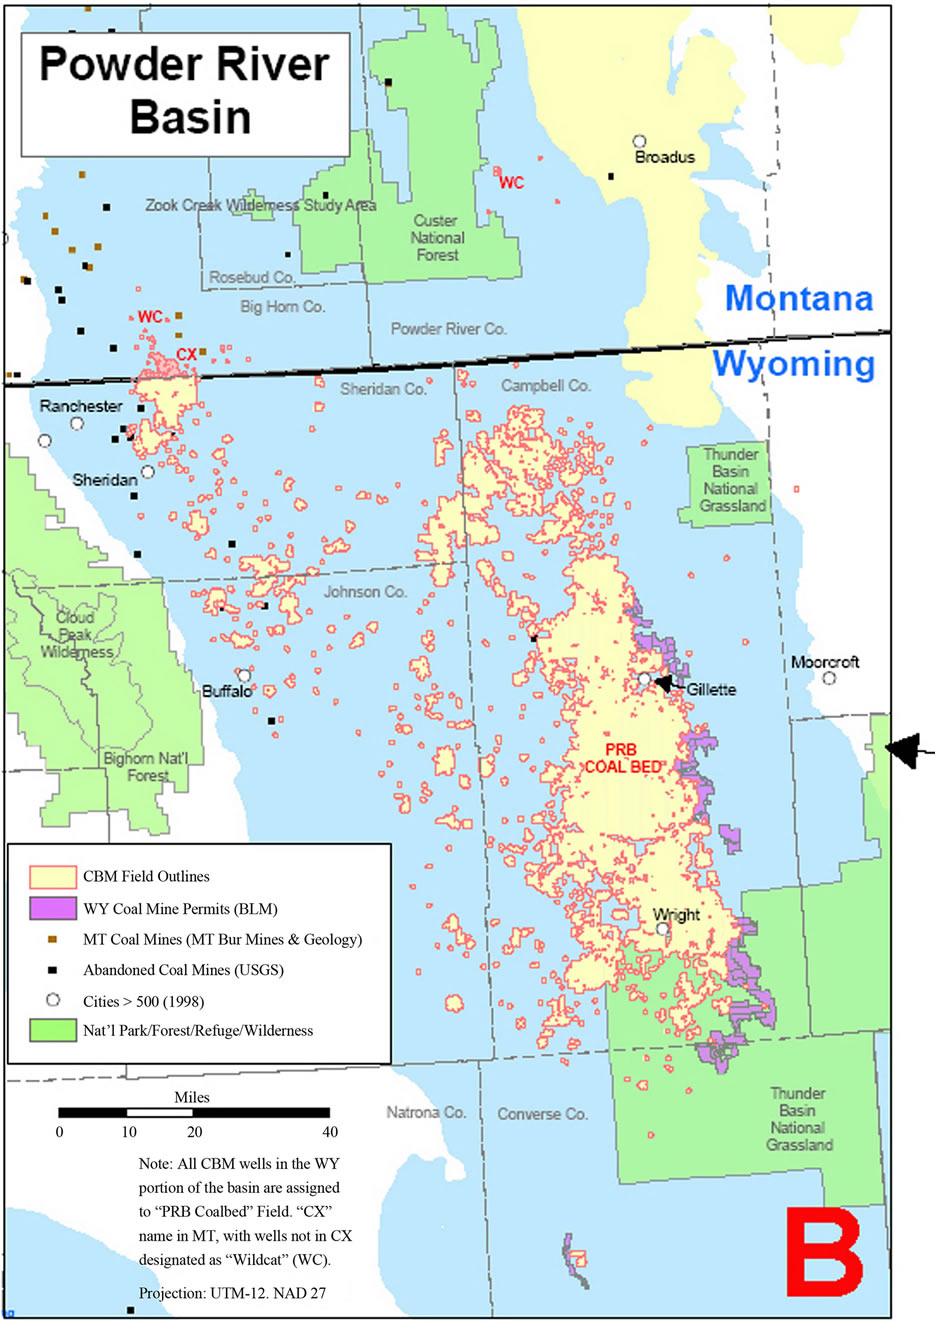
Figure 1. Map of the Powder River Basin Coal Field [18].

Figure 2. Coal Production from PRB, 1994-2011 [19].
ronmental regulations.
As Figure 2 indicates, most PRB coal comes from Wyoming, where PRB coal production went from 216 million tons in 1994 to 452 million tons in 2008 and then to 426 million tons in 2011. In contrast, PRB coal production from Montana increased from 41 to 44 million tons between 1994 and 2008 and then declined to 37 million tons in 2011.
5. The Competitiveness of PRB Coal
The dramatic increase in PRB coal production is driven by the fundamental economics of coal production, transportation, and utilization. Most coal consumers in the U.S. are producers of electricity. These firms generally try to minimize their fuel costs. Most of these producers are regulated utilities. As a result, these companies must justify their fuel choices before Public Utility Commissions who are interested in keeping electricity rates at just and prudent levels. The unique geology of the PRB coalfields combined with the application of advanced mining technology enables PRB coal producers to satisfy their customer’s needs to minimize fuel acquisition costs.
Other key players enhancing the competitiveness of PRB coal are the railroads. Roughly half of the delivered cost of coal to electricity producers is transportation [3]. Deregulation and investments in rail improvement and access played a key role in reducing transportation costs for delivering PRB coal.
Finally, another key factor involves environmental regulations, see [20,21]. The Clean Air Act Amendments of 1990 mandated significant reductions in emissions of sulfur dioxide from energy consuming facilities, such as electric power plants. Electricity providers have a number of options to achieve emission control standards, including the substitution of low-sulfur PRB coal for higher sulfur fuels, such as Eastern coal and residual fuel oil [21].
A key source of PRB coal’s competitiveness is the high productivity of the mining operations in the region. Figure 3 below plots labor productivity of coal producers in Wyoming, in the Powder River Basin, and outside the region. Labor productivity among PRB producers is on average nine times greater than other U.S. coal producers. PRB mines averaged 40 tons of coal mined per employee per hour while other producers averaged 4.4 tons per employee per hour. To a certain extent, this huge difference in productivity reflects the relatively larger coal seams in the PRB. Other factors, however, are at work.
Rather than differences in absolute levels of productivity these factors are manifested in the trends in productivity over time. To measure these trends, a comparison between Wyoming and other U.S. producers is required because PRB productivity statistics are unavailable prior to 2000. The average annual growth in labor productivity in Wyoming between 1985 and 2007 was 3.9% per annum, while the same measure in other re
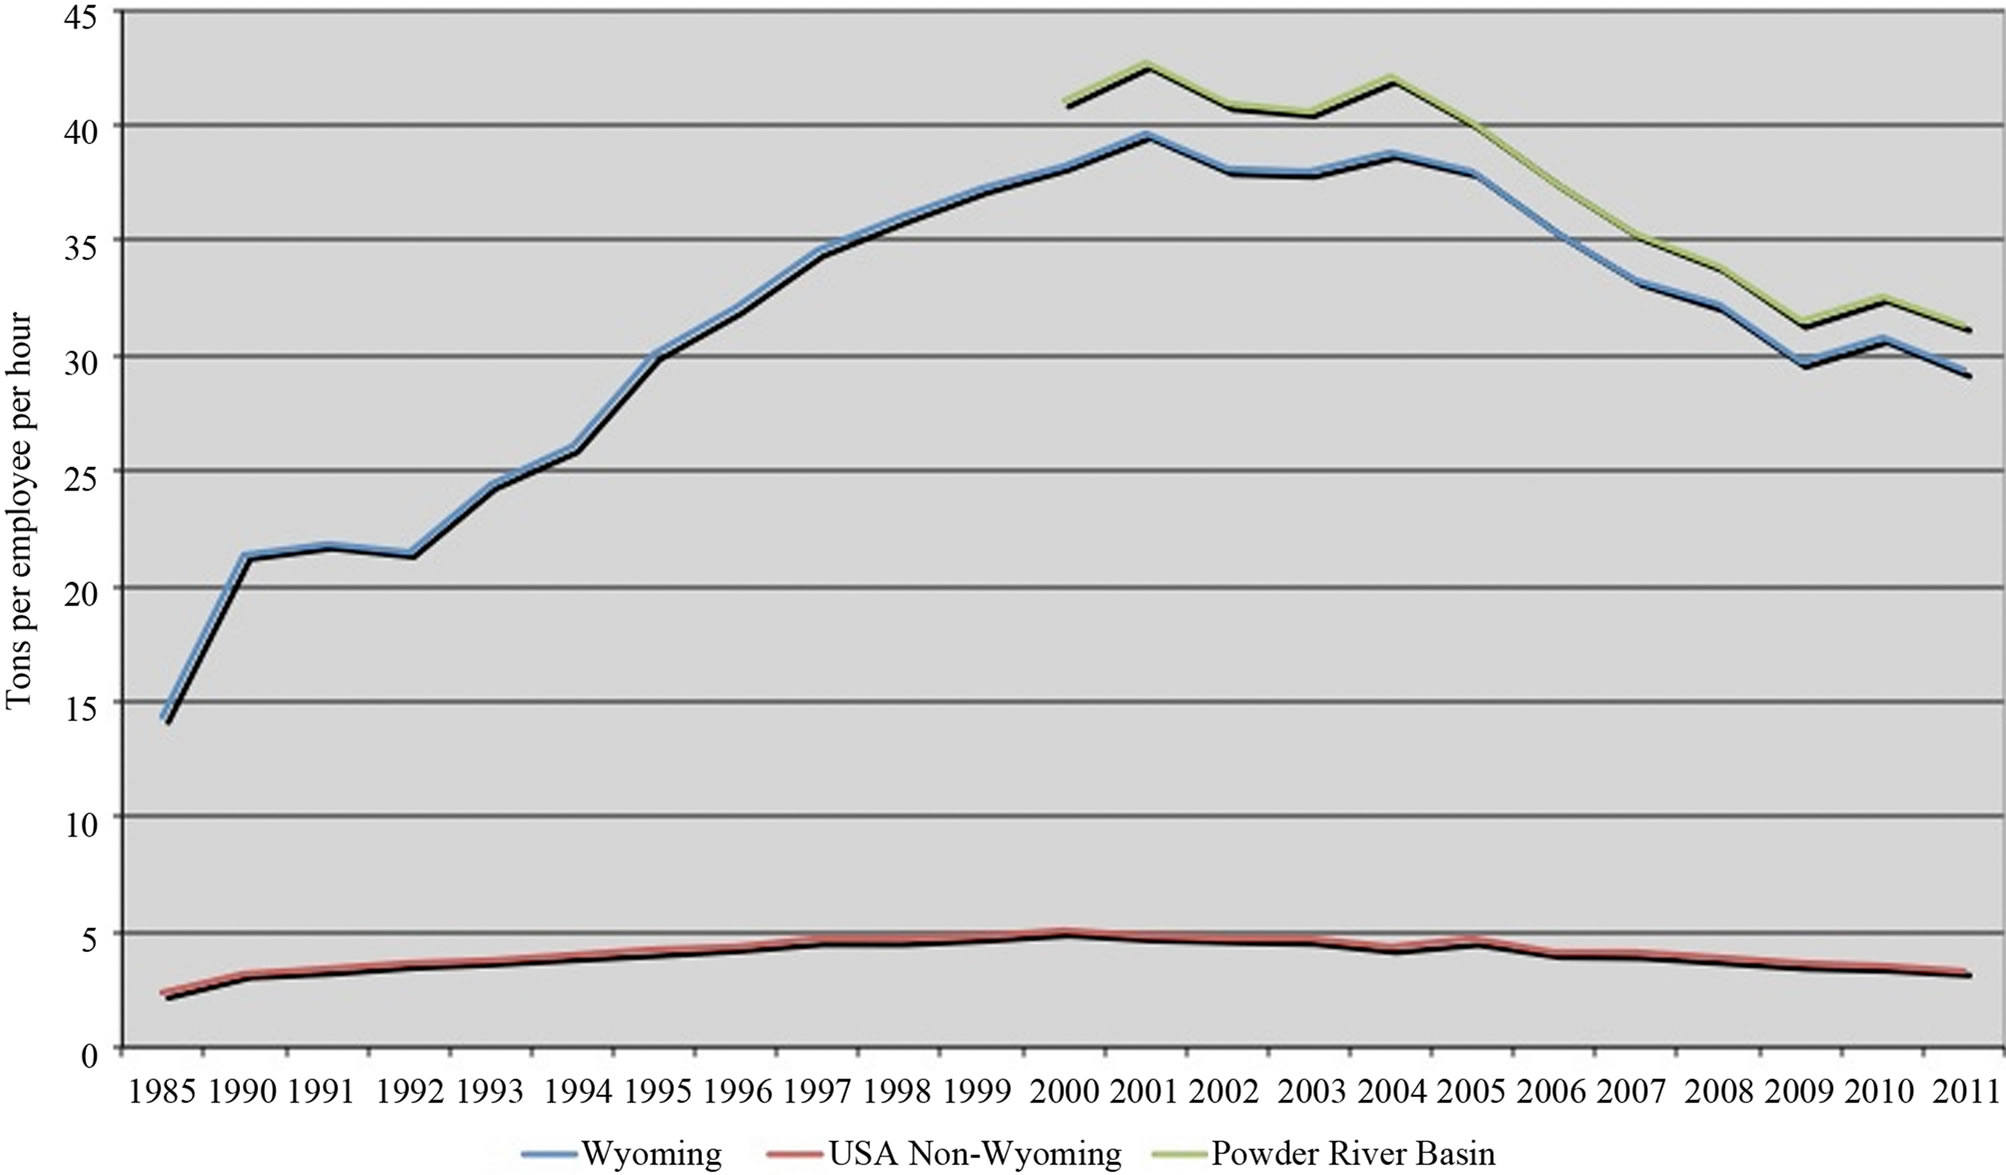
Figure 3. Labor Productivity of Various Coal Producers, 1985-2011 [22].
gions was 1.9% per year. Although both productivity growth rates are impressive, the higher growth rate in Wyoming may reflect differences in labor incentive structures, workplace rules, and technology adoption.
Another key factor contributing to PRB coal competitiveness has been lower transportation rates. In 1980, the U.S. Congress passed the Staggers Rail Act that deregulated the railroad industry. Prior to the Act’s passage, rail rates were linked to tariffs regulated by the Interstate Commerce Commission. After the passage, railroads could charge their own tariffs and began to compete with each other for business by setting competitive rates. After the early to mid-1980s average rates for coal transportation declined steadily. In Figure 4 below regional coal transportation rates are reported from 1979 to 2010 for coal shipped from Appalachia, Illinois, and the Powder River Basin. Coal transportation rates for PRB coal declined 45% from 1979 to 2010 while rates increased 30% and 54% respectively for coal shipped from Appalachia and Illinois (see Figure 4).
Higher productivity and lower transportation costs contributed to a trend of declining real prices for coal in the U.S. from the late 1970s through the first few years of this century. Prices for bituminous and sub-bituminous coal are plotted in Figure 5 from 1979 to 2011. PRB coal is sub-bituminous so prices for this grade reflects trends in PRB coal prices. The first notable feature of this time series plot is the wide differential between prices for bituminous and sub-bituminous coal. These price differentials are consistent with a competitive market in which prices reflect productivity and cost differences between regions. Early in the sample, sub-bituminous coal prices were about 40% of prices for bituminous grades. Towards the end of the period, prices for sub-bituminous grades were only 27% of bituminous prices. These trends are also consistent with the productivity trends discussed above in which the PRB region became relatively more productive over time.
These differences in prices between coal grades affected the relative composition of shipments over time. As Figure 6 illustrates, bituminous coal shipments were substantially higher than sub-bituminous coal shipments until 2001. By 2006, sub-bituminous shipments were just 4 tons less than bituminous coal deliveries and by 2010 they exceeded bituminous shipments. These adjustments in part reflect fuel use decisions by electricity producers in response to delivered cost and environmental regulations.
Sub-bituminous coal has substantially lower sulfur content with about 0.4% sulfur by weight as opposed to 1.5% for bituminous coals. The rising share of PRB coal played an important role in reducing U.S. emissions of sulfur dioxide from 1995 to 2010. From their peak of 13.5 thousand tons in 1997, sulfur dioxide emissions dropped to 5.4 thousand tons in 2010 (see Figure 7). Emissions per unit of electricity generated from fossil
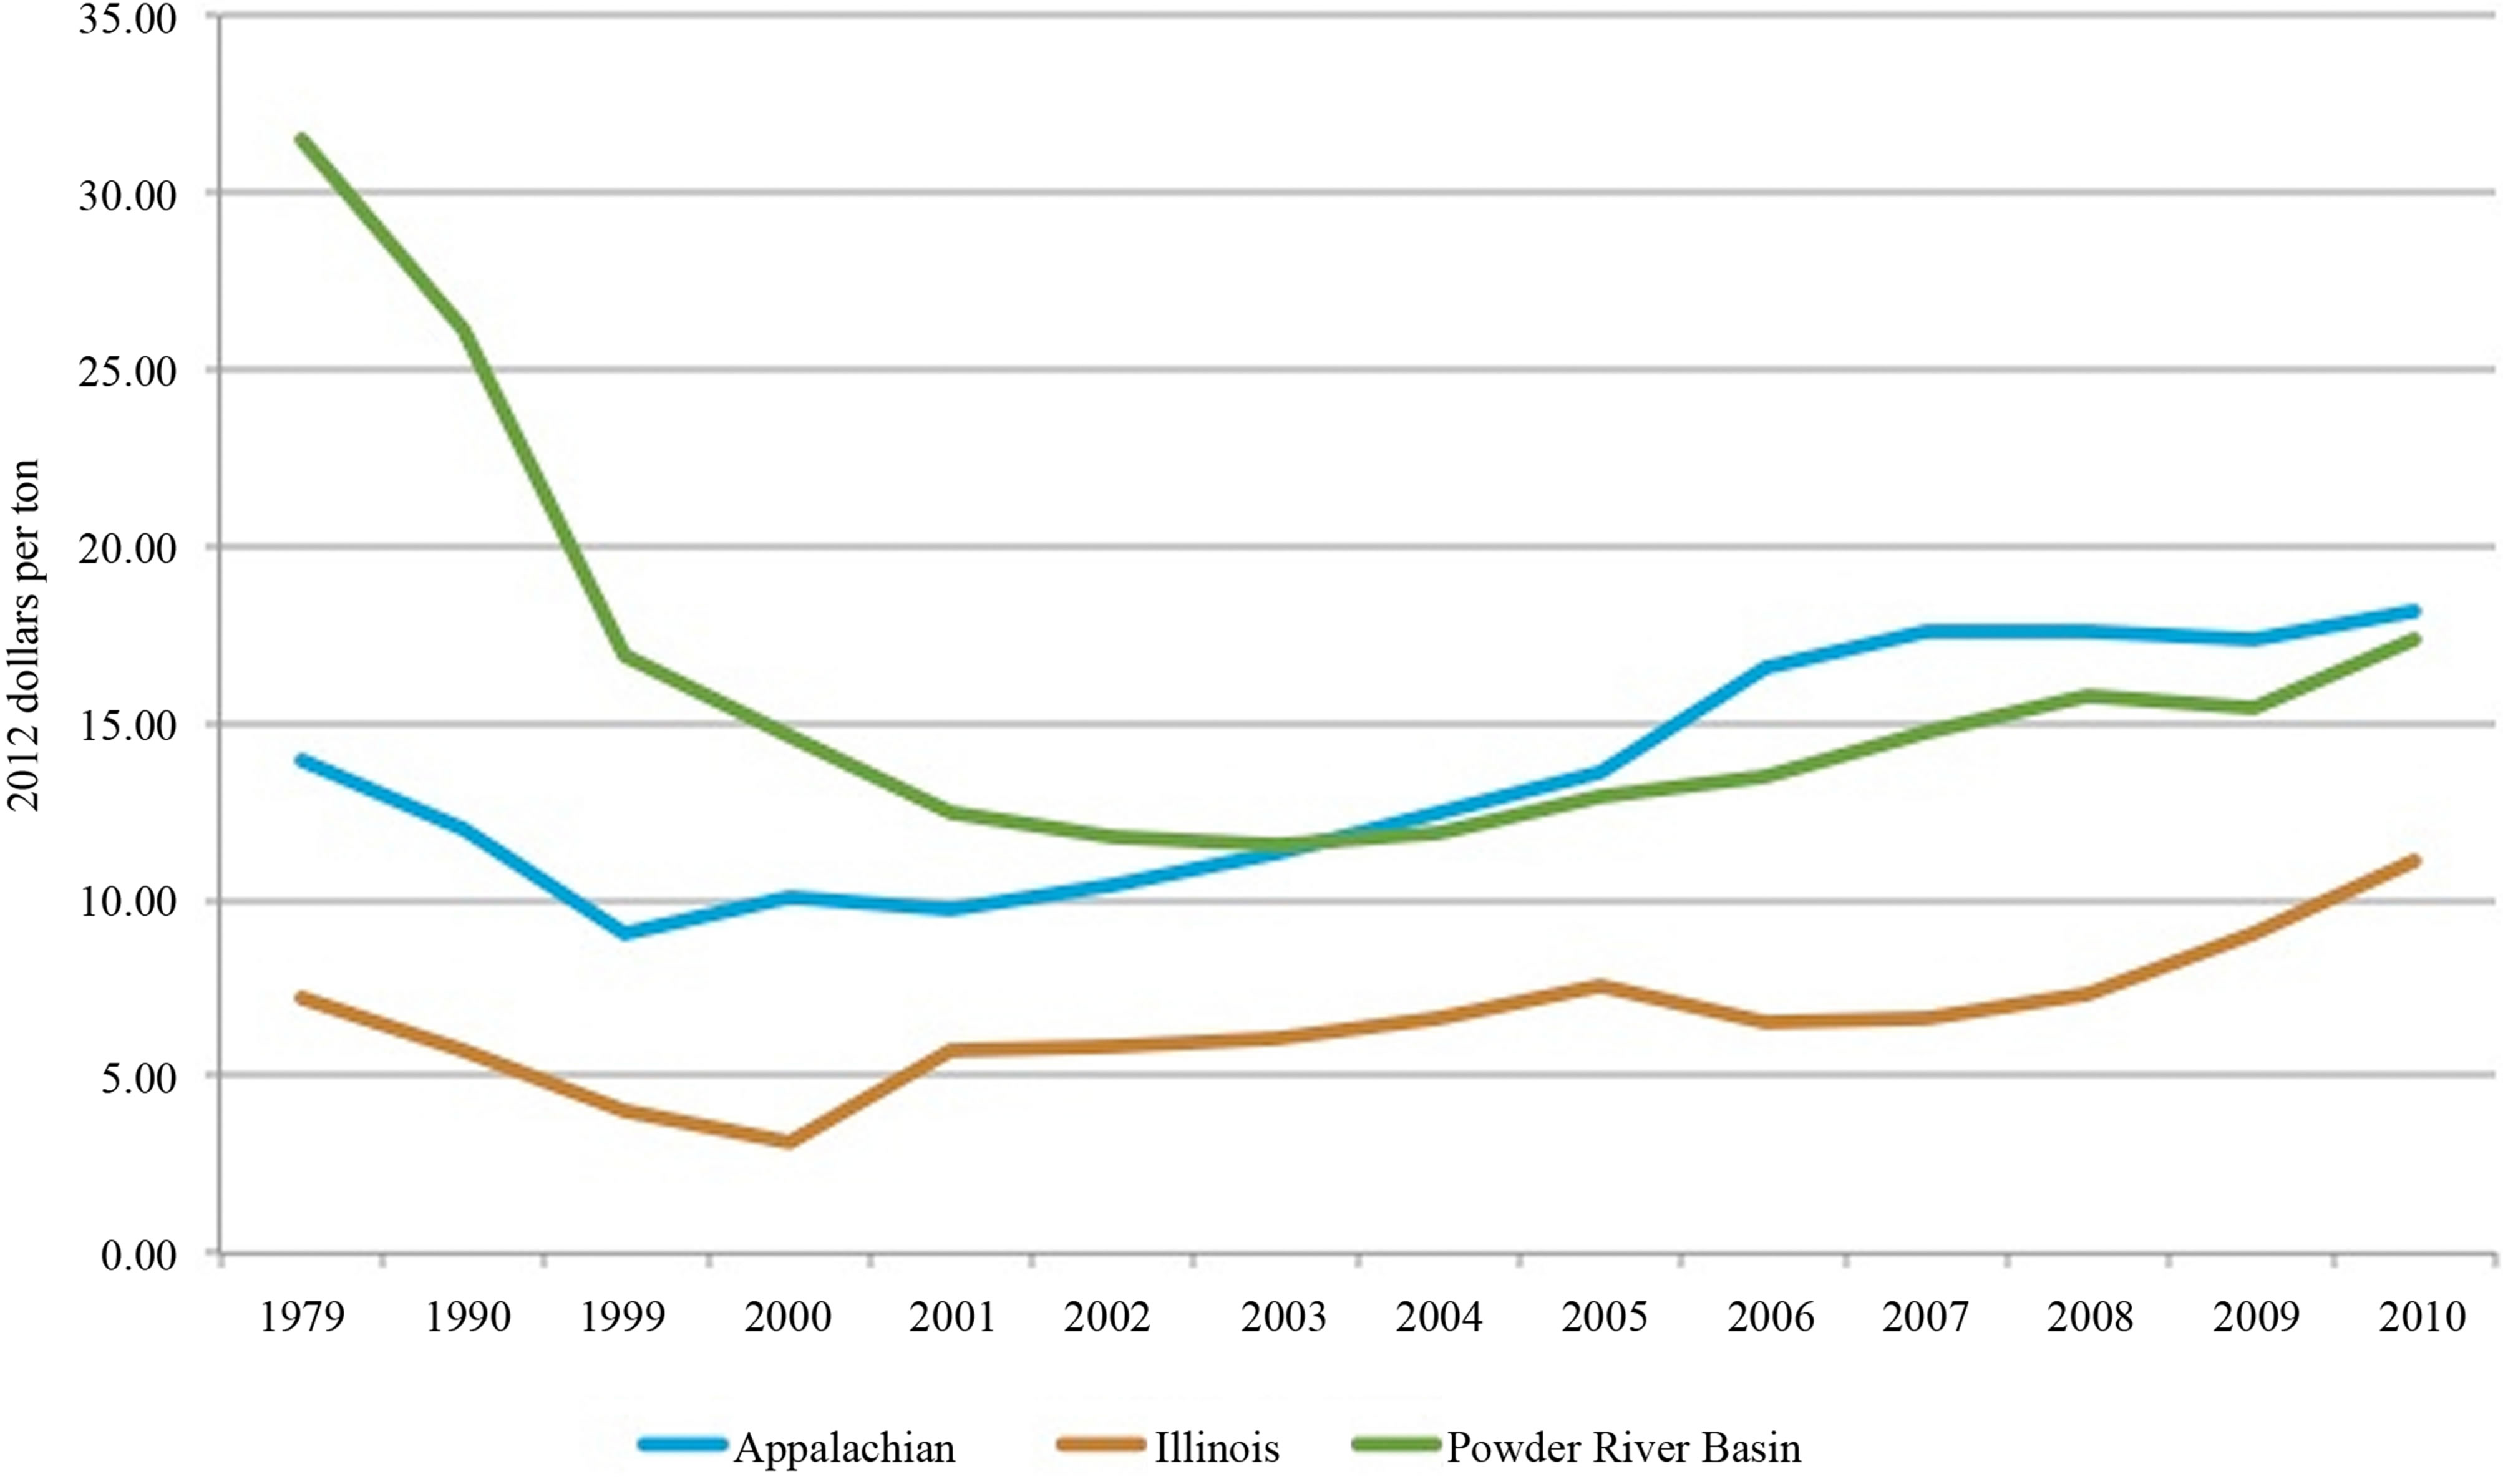
Figure 4. Coal Transportation Rates by Region, 1979-2010 [23].
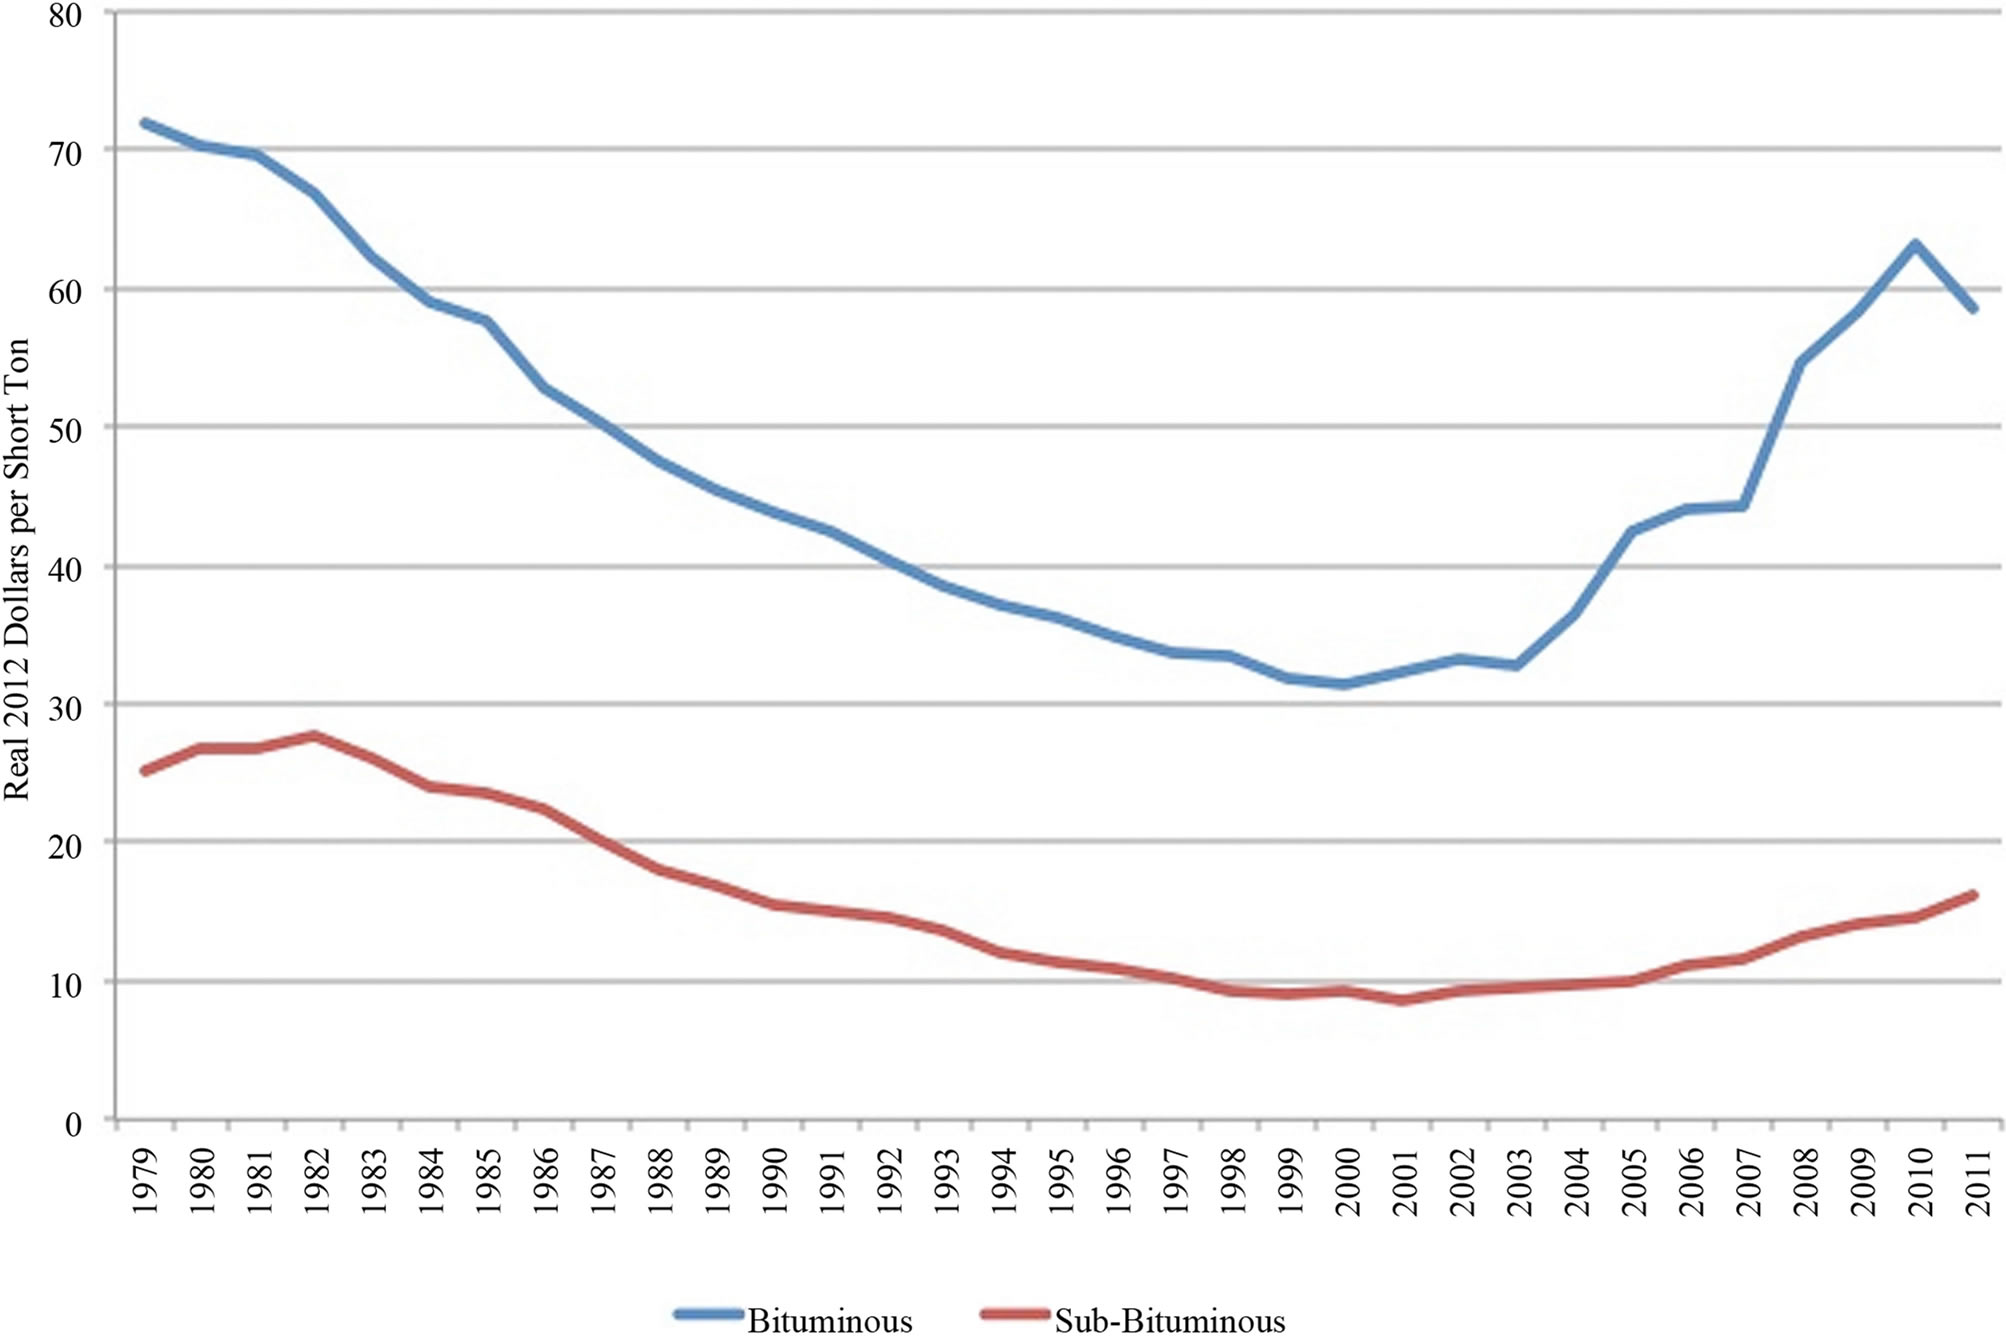
Figure 5. Real Prices for Coal by Grade, 1979-2011 [24].
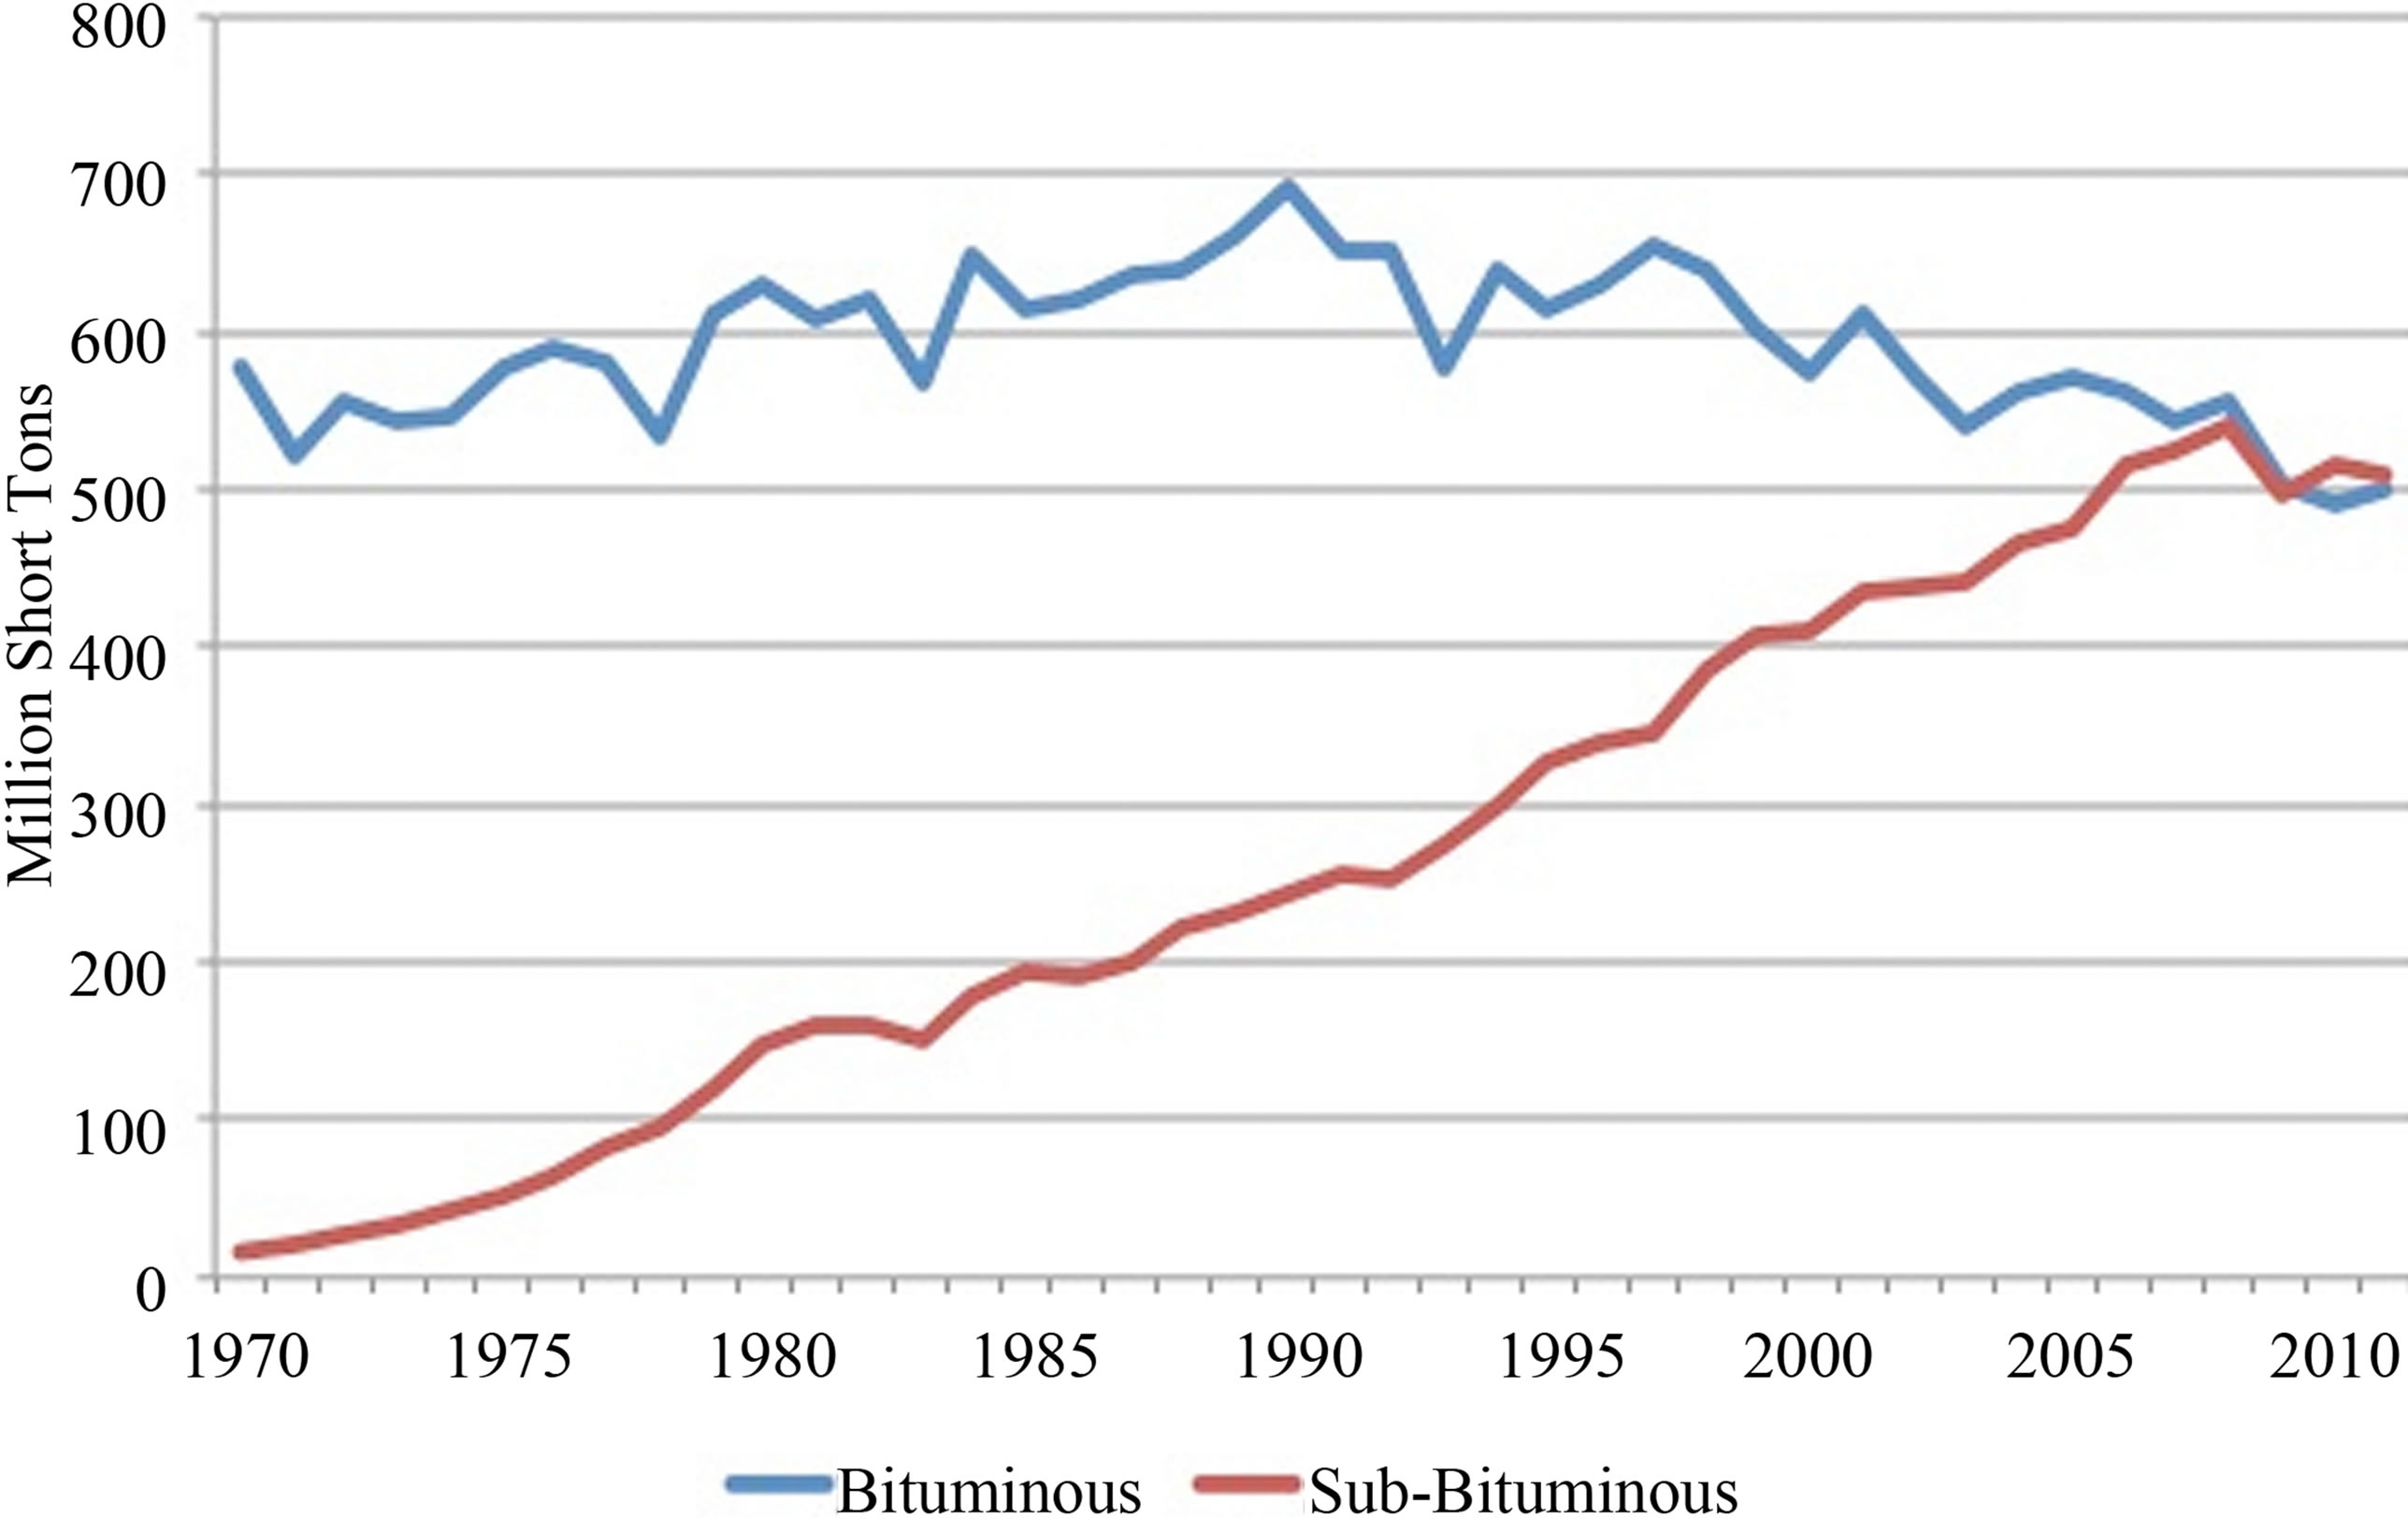
Figure 6. Coal Shipments by Grade, 1969-2011 [25].
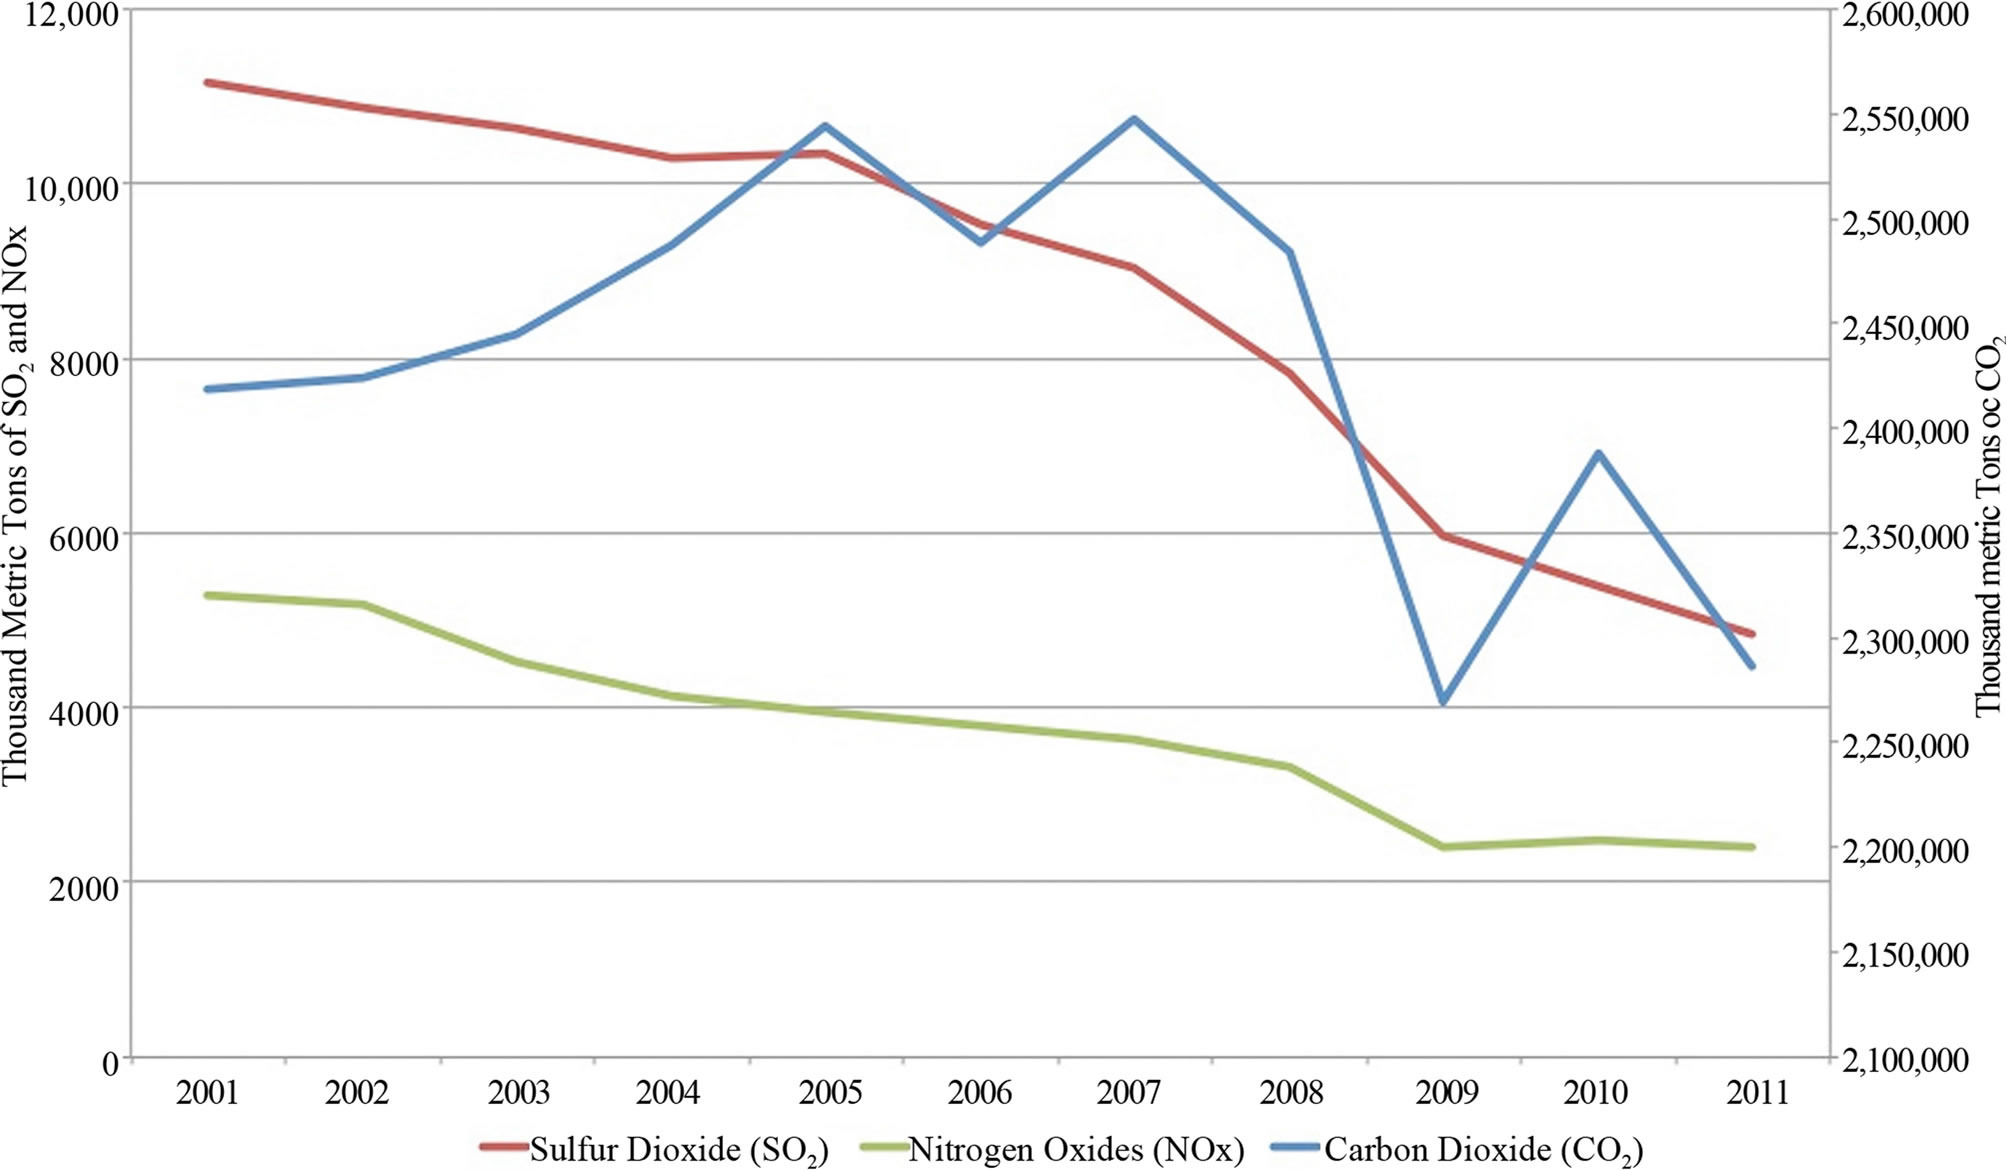
Figure 7. Sulfur Dioxide and Nitrogen Oxide Emissions from Power Plants, 1995-2010 [26].
fuels also declined, which reflects in part switching to PRB coal and natural gas [21].
6. PRB Coal and Electricity Prices
The low cost and high quality of PRB coal have been the primary drivers for its increasing use and market share. This expanded consumption of PRB coal has broad geographical scope. Most of the growth in PRB coal consumption has been in the Midwestern, Southern and Western United States. As Figure 8 below indicates, about 18% of coal consumed in the East, which includes New England, Mid-Atlantic, and North Central states, came from the PRB in 1992 but by 2008 that percentage increased to 60% of that market.
During 2011, 33 states used PRB coal, which is down from 38 states in 2008. The largest market for PRB coal is Texas, which consumed over 62 million tons during 2011. The next largest market is Illinois at 61 million tons. Missouri is third at 44 million tons. Of the 20 states
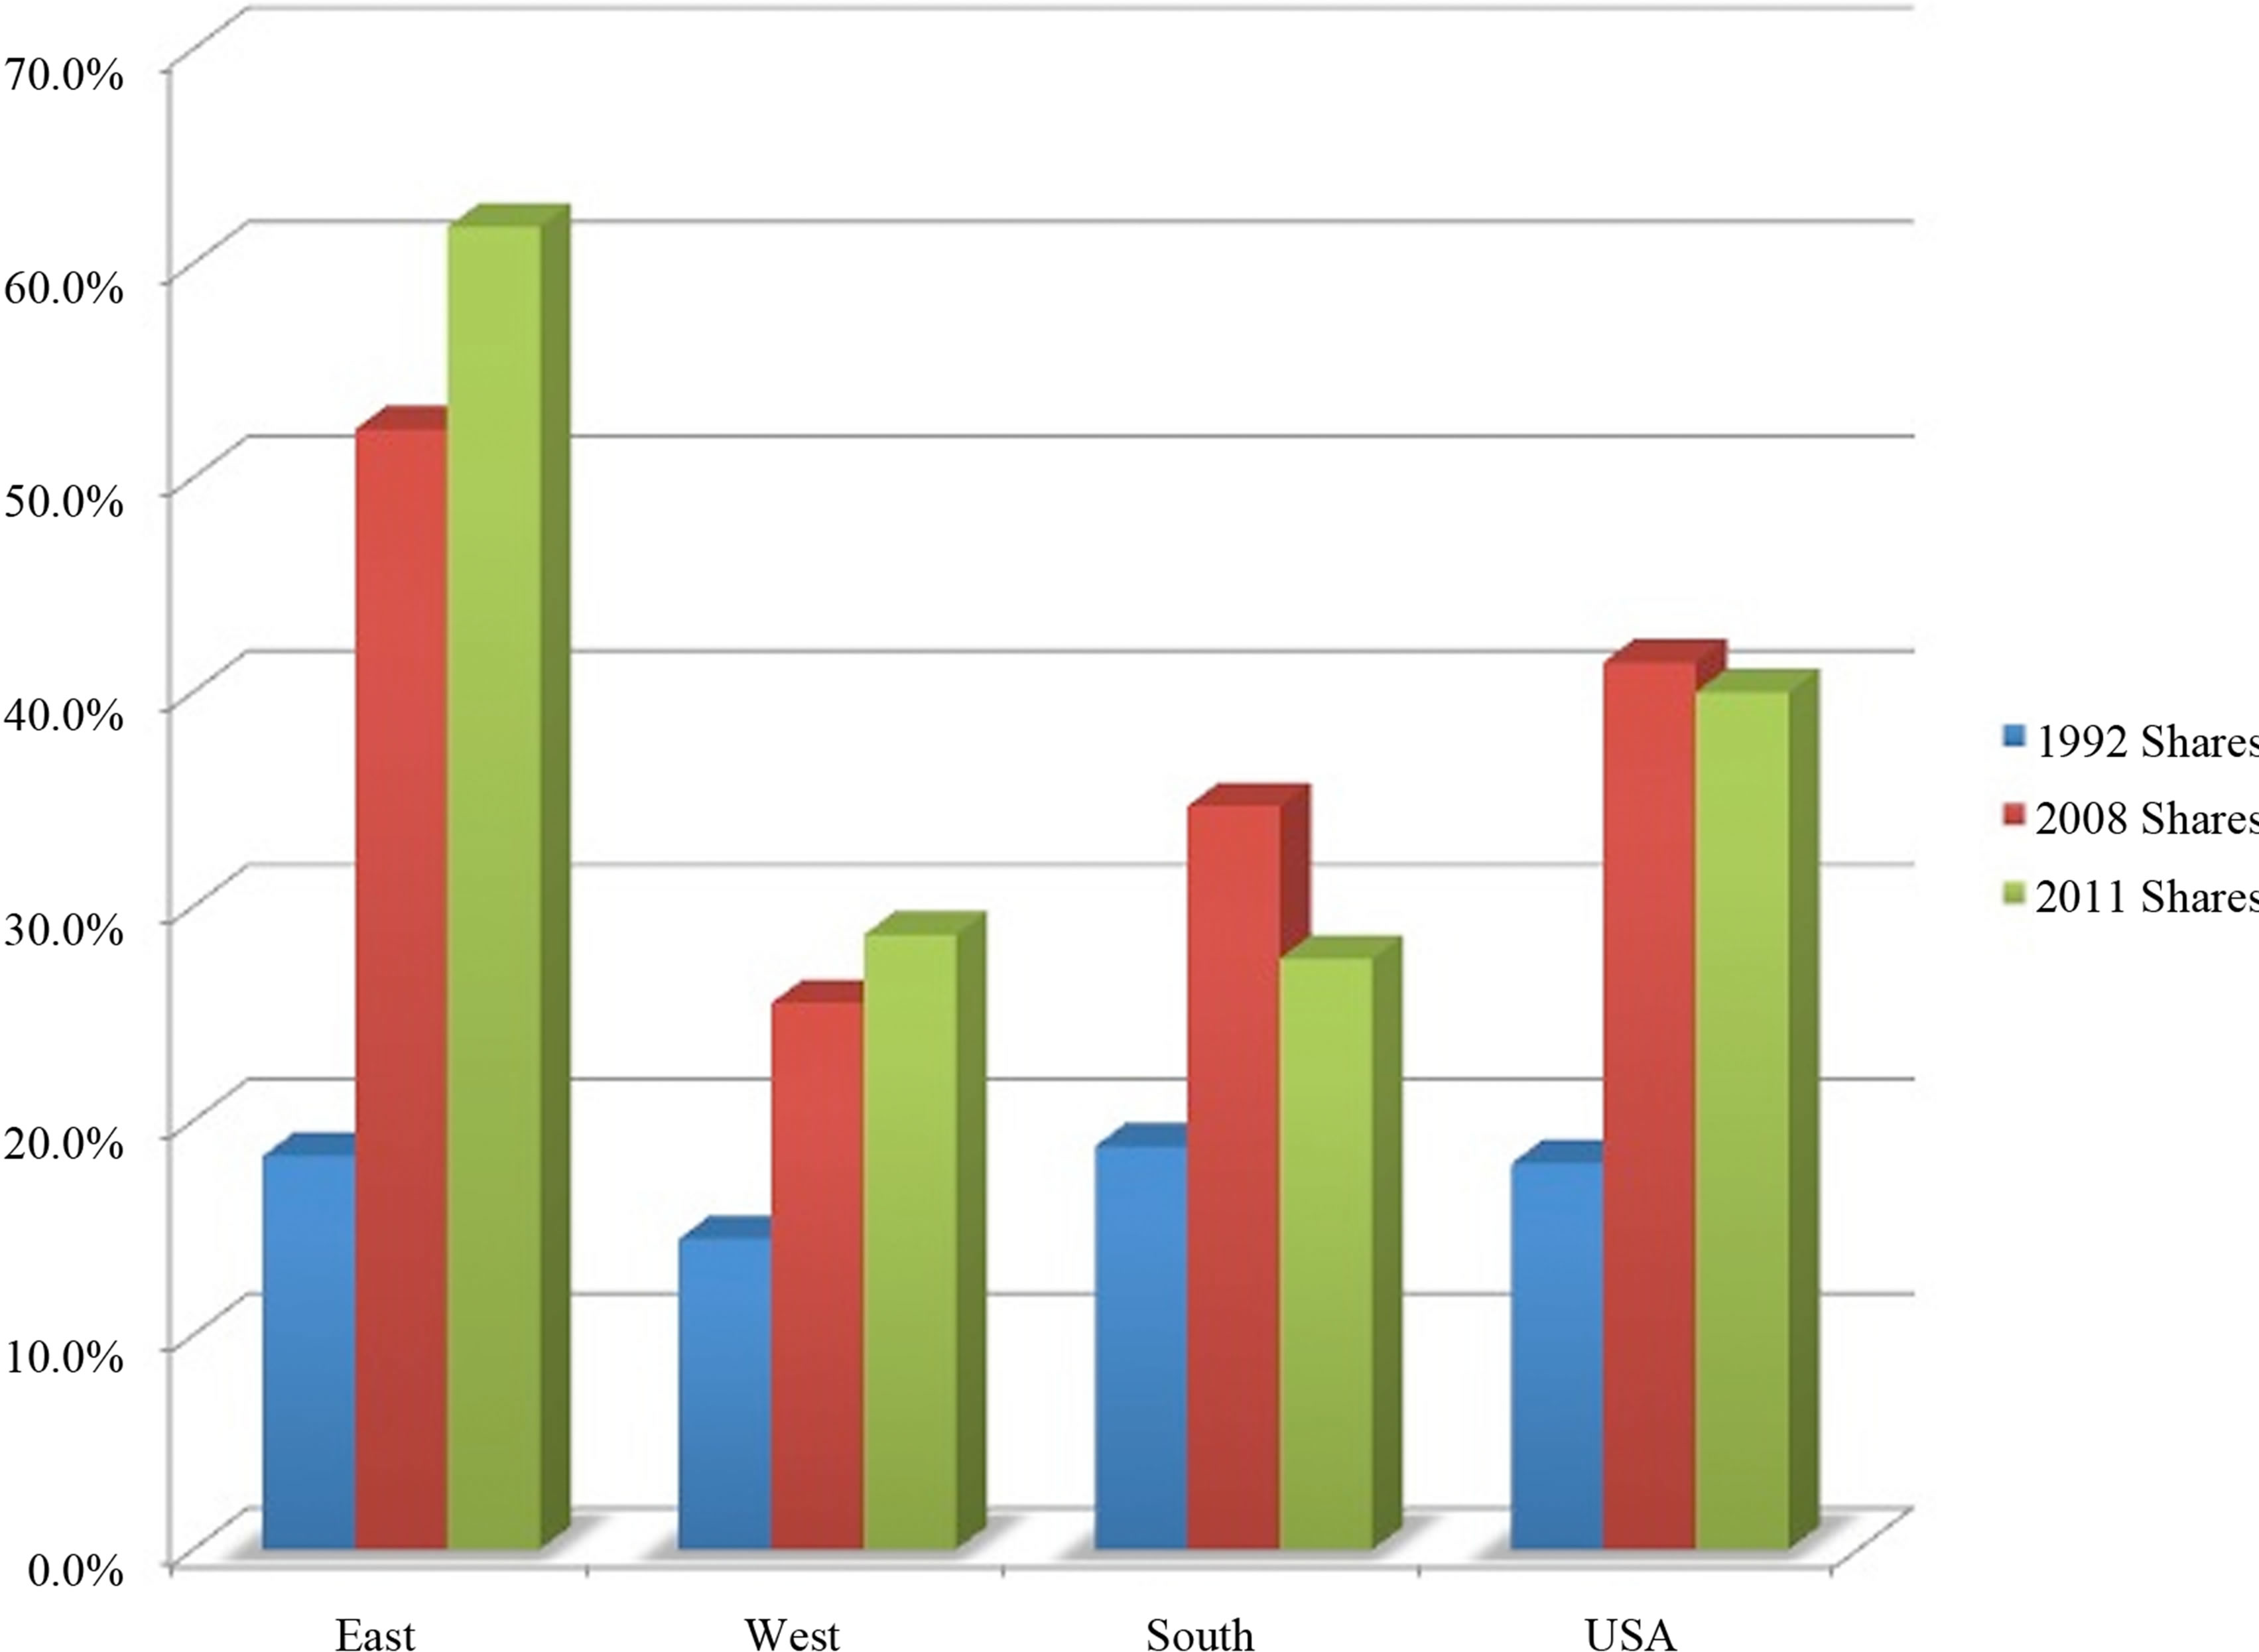
Figure 8. Growth in market share of PRB coal, 1992, 2008, and 2011 [27,28].
that consume more than 5 million tons of PRB coal, all but two have retail electricity prices below the national average of 9.9 cents per kilowatt-hour. These 20 states on average have retail electricity rates that are 12.4% below the national average (see Figure 9).
Of the 15 states that use no PRB coal, 10 have retail electricity rates above the national average (see Figure 10). The exceptions include Idaho, which uses large amounts of hydroelectric power, and New Mexico, Virginia, and Utah, which use local coal, and South Carolina, which has significant nuclear energy assets. Average retail electricity rates are 34% above the national average for states that do not use PRB coal and 62% above the national average for this group without Idaho, New Mexico, South Carolina, North Carolina, Montana, and Virginia. These findings suggest that regions that do not use PRB coal are likely to have higher than average electricity rates.
The expanded use of PRB coal over time is also an important factor explaining electricity price trends. After reaching a peak of 11 cents per kilowatt-hour in 1983, real electricity prices declined steadily during the 1980s and 1990s, reaching a low of 7.6 cents per kilowatt-hour in 1999. During the same period, the share of all electricity generated from Wyoming coal, which is primarily from the PRB, rose from 8 to 15 percent. The increased market share of PRB coal directly contributed to lower real electricity prices during the 1980s and 1990s (see Figure 11). Hence, the PRB coal industry is a good example of how dramatic improvements in productivity of a basic industry like coal production translates into downstream benefits, such as reductions in the real electricity prices. Following the supply chain, these lower real electricity prices improve the competitiveness of electricityusing sectors. After 1999, while the share of PRB generated electricity continued to rise until 2008, real electricity prices increased, primarily due to rising natural gas prices. Since 2008, the share of PRB coal has declined yet real electricity prices fell, in this case, due to an abundance of low cost shale gas that drove market prices for natural gas well below their peak in 2008.
Once again PRB coal plays a pivotal role. As we have seen above, the consumption of high quality, low-cost PRB coal contributes to lower prices of electricity observed in the industrial heartland of the United States. Figure 12 vividly illustrates that most industrial consumption of electricity occurs in the central and southern regions of the United States where industrial electricity rates are lowest. The West Coast and northeastern sections of the United States have the highest industrial electricity rates and substantially lower industrial electricity consumption. Historically, electricity intensive industries, such as metals and equipment manufacturers, gravitate to areas with relatively low electricity rates.
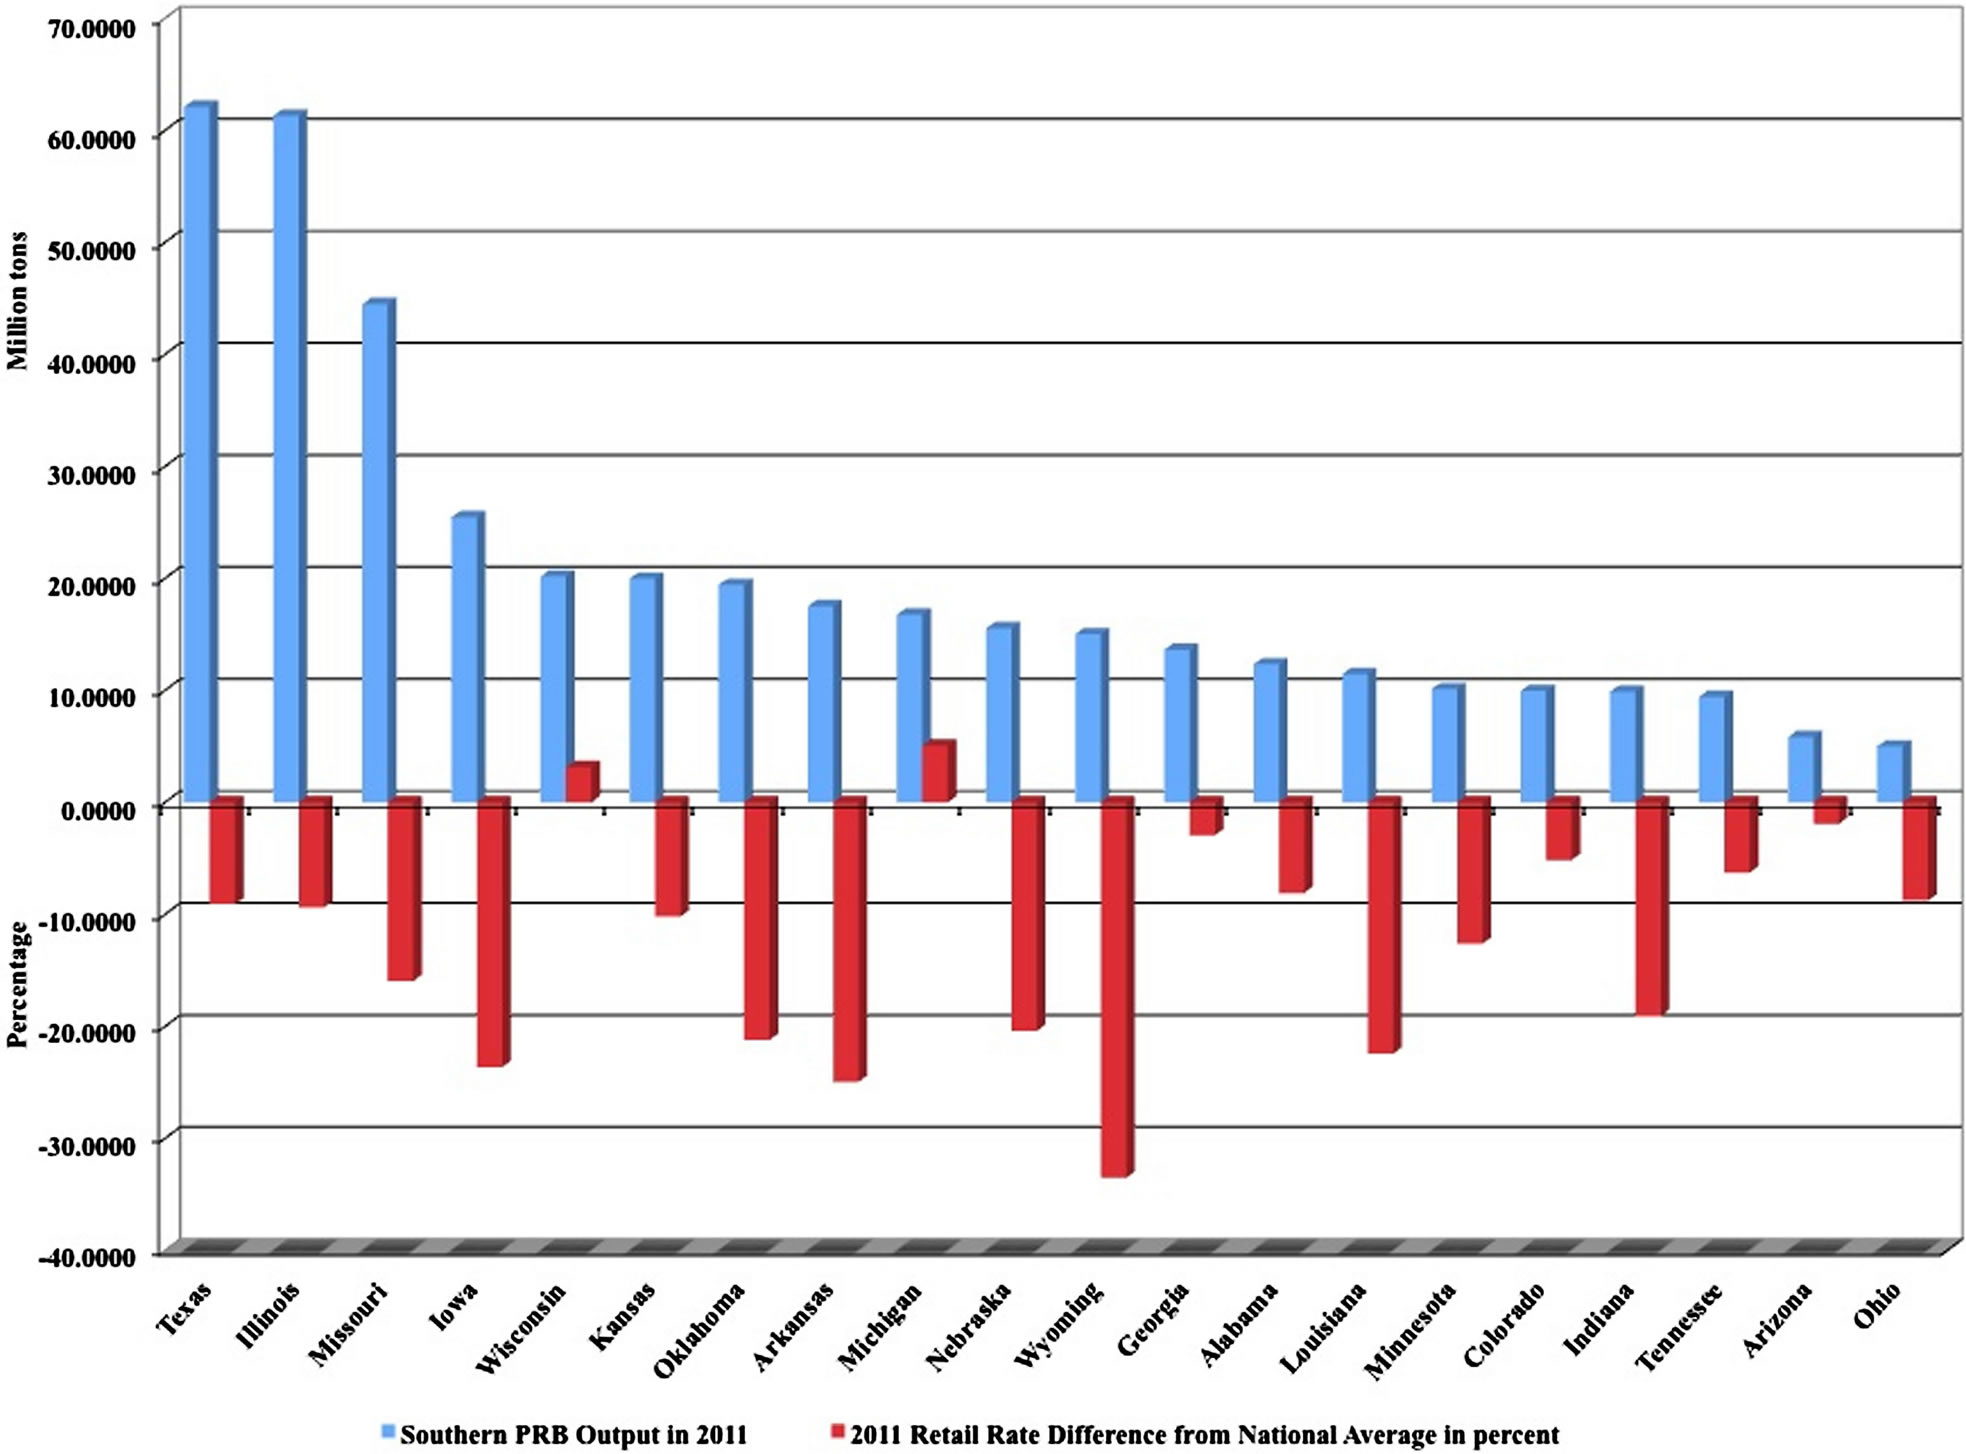
Figure 9. PRB Coal Users and Electricity Rate Differences from National Average in 2011 [28,29].
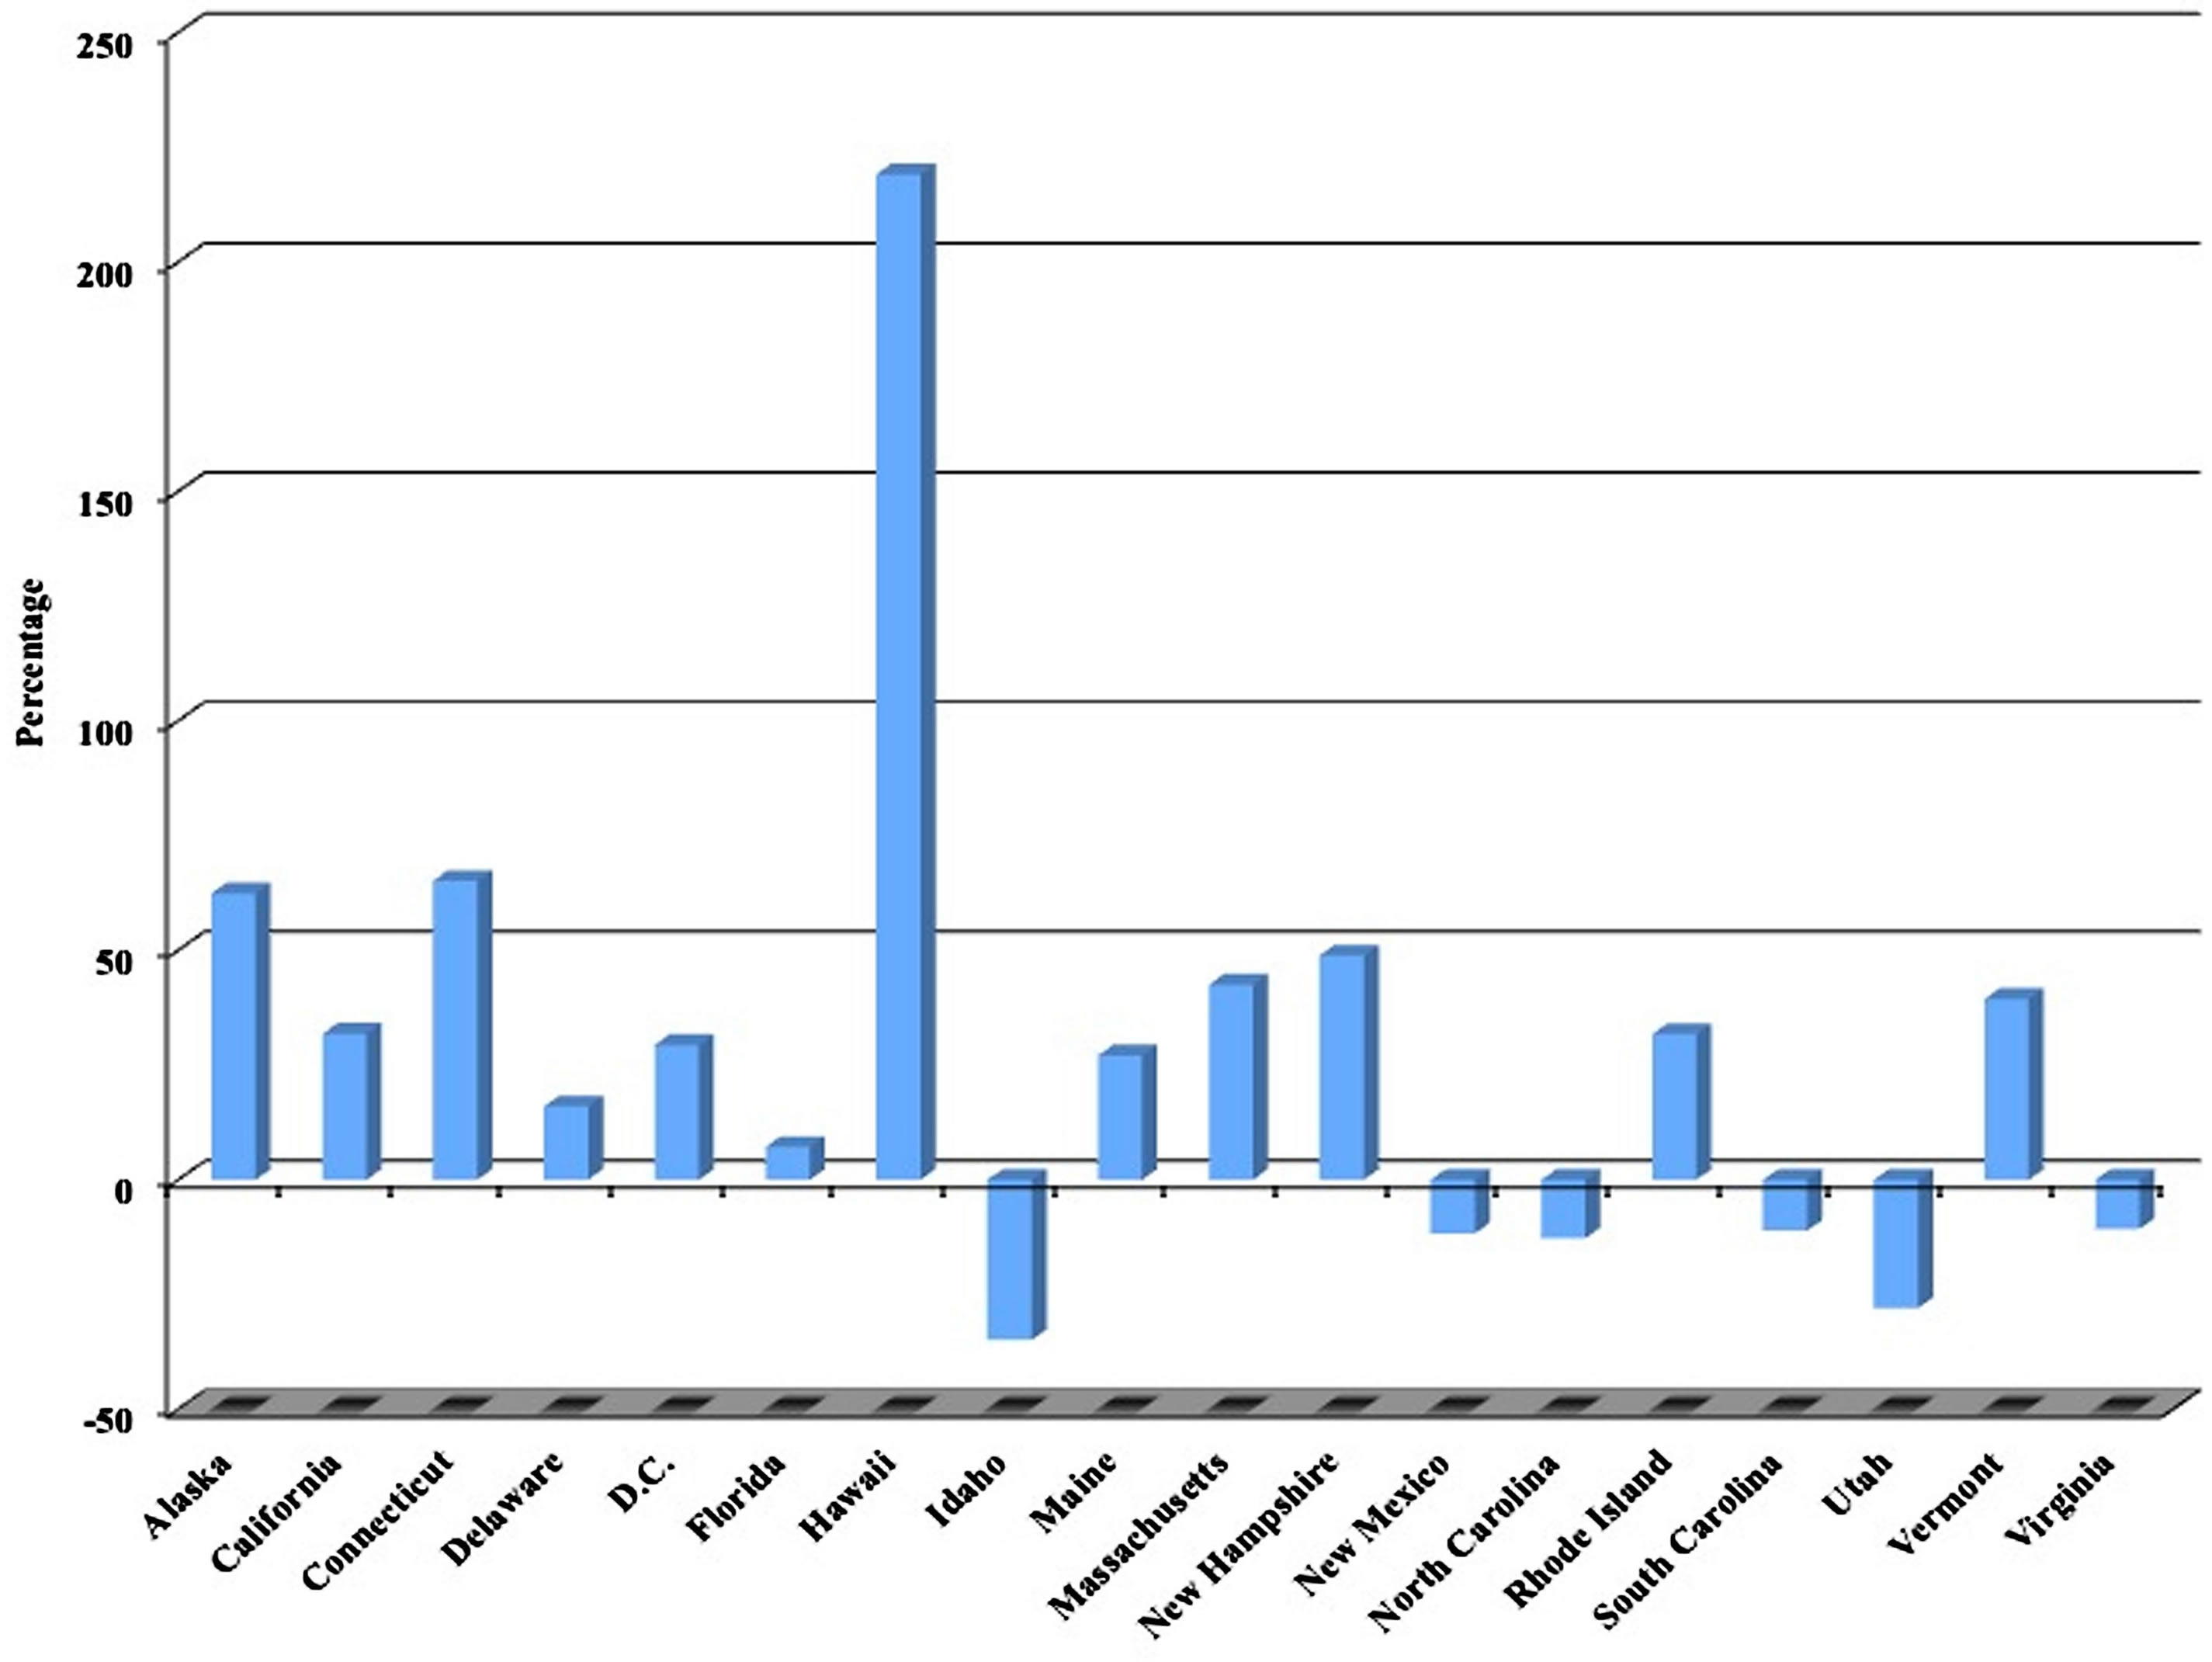
Figure 10. Retail Electricity Rate Differences for non-PRB Coal Users in 2011 [28,29].
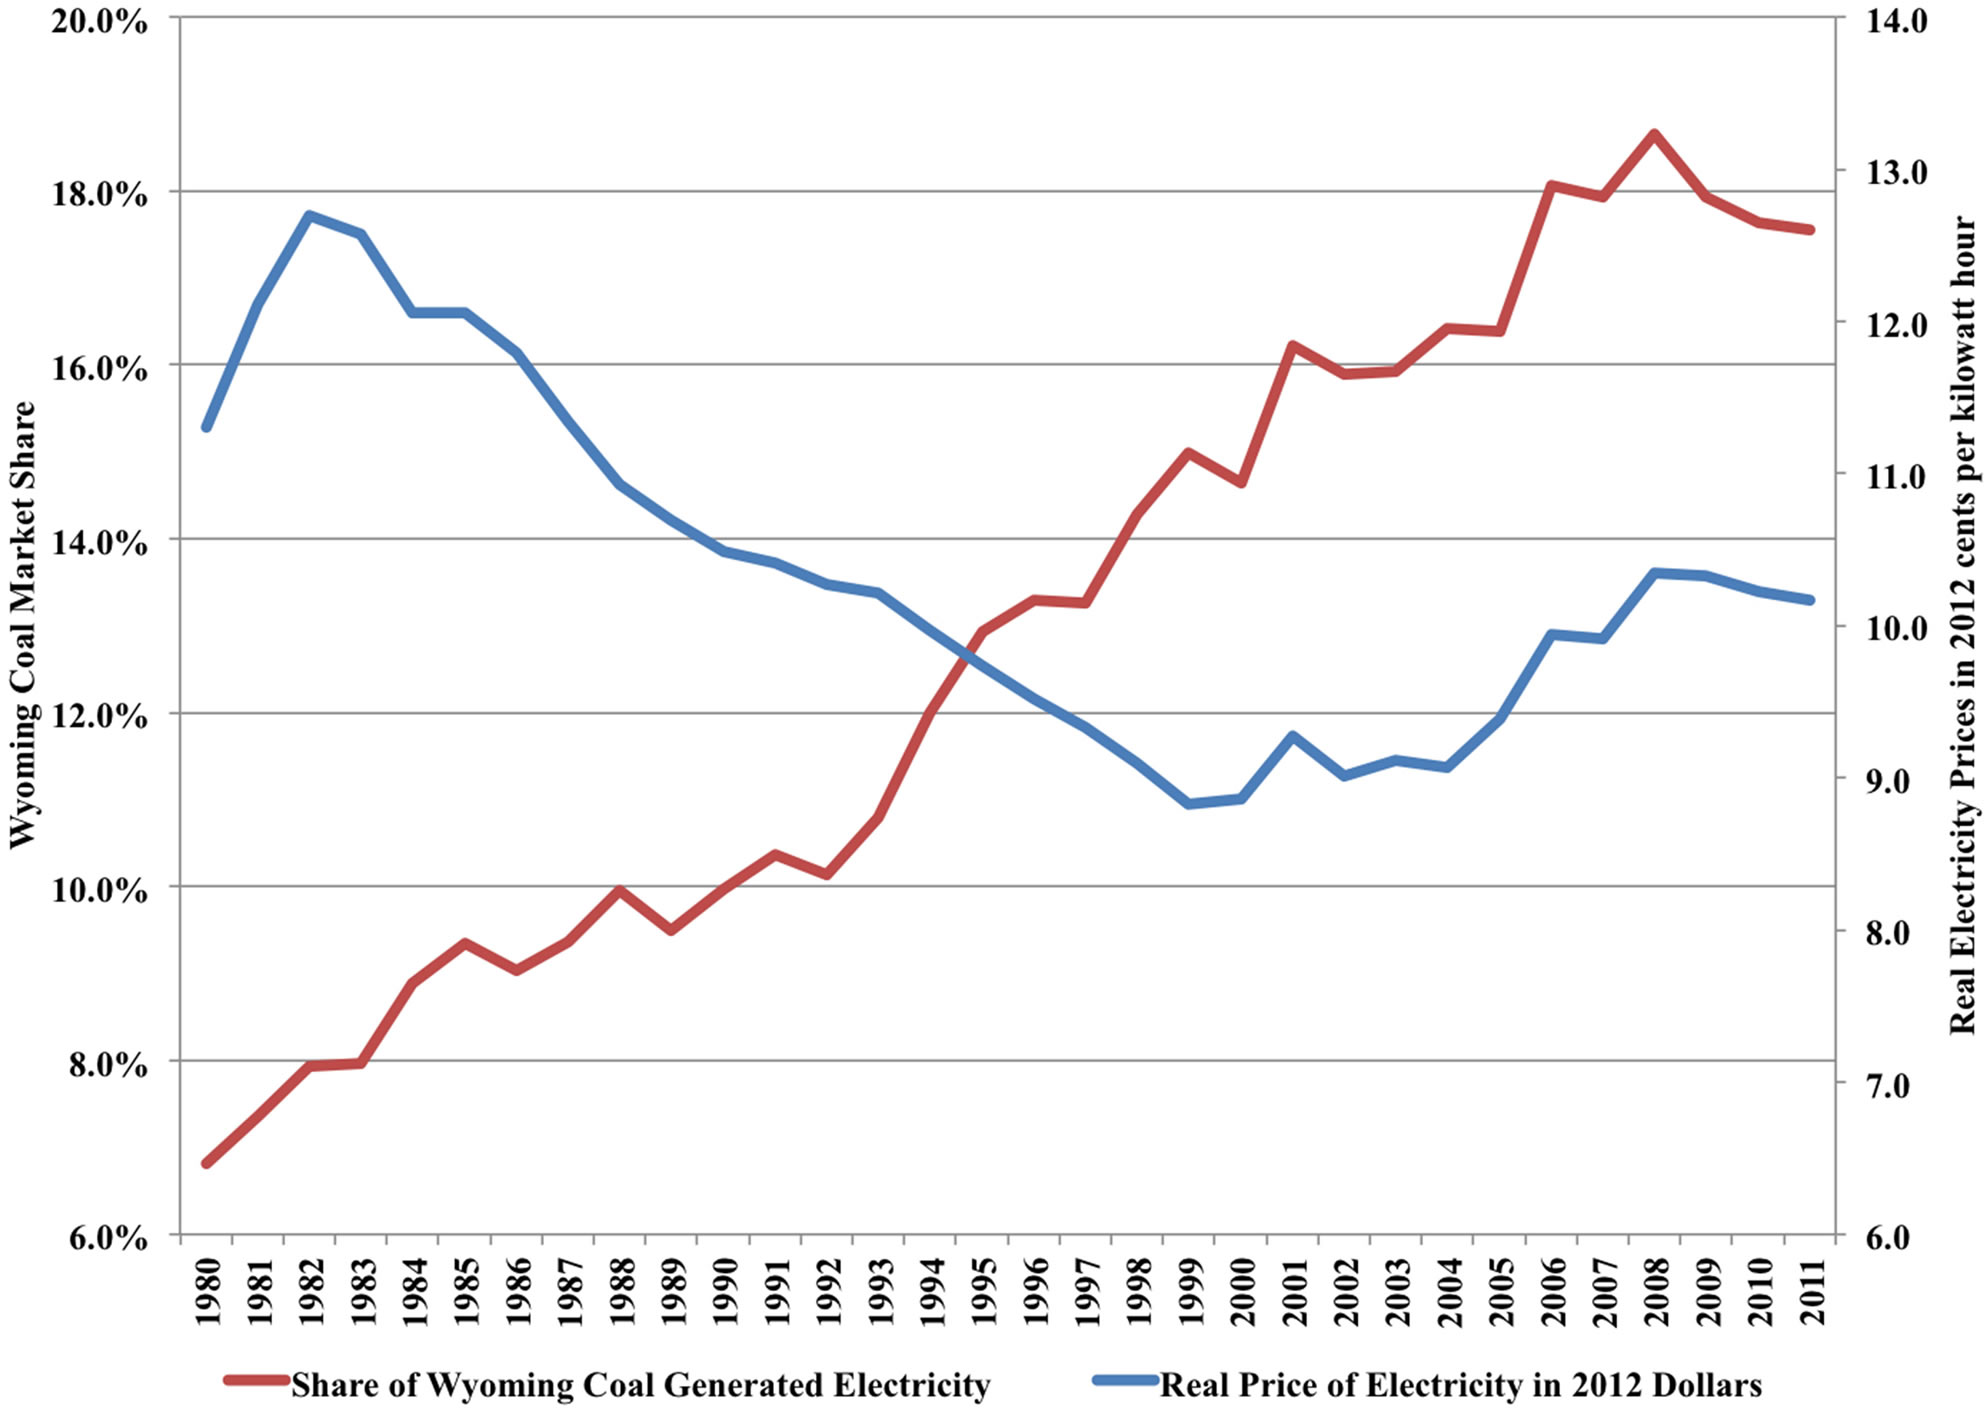
Figure 11. Share of Wyoming Coal Generated Electricity and Real Prices, 1980-2011 [28,29].

Figure 12. Industrial electricity consumption and rates by region in the U.S. in 2011 [30,31].
As the pace of PRB market penetration slowed and the use of natural gas in power generation increased, real electricity prices in the U.S. stopped falling and began rising significantly. Prices for natural gas paid by electricity producers increased from $3 per thousand cubic feet in the year 2000 to almost $10 per thousand cubic feet in 2008 (see Figure 13). From 1998 to 2008, the average annual increase in real natural gas prices was 12%. Real electricity prices during this period increased 1%. This increase in real electricity prices would have been larger without the cost cushioning impact of PRB coal. From 2009 through July of 2013, the average annual rate of decline in real natural gas prices was 10.8%. As a result, real electricity prices declined 1.3% during this period. So clearly, since the mid-1990s natural gas prices affect electricity prices.
As Figure 14 illustrates, petroleum prices are far more volatile than coal prices. The chart below reports the mean and standard deviations (denoted as S.D. in Figure 14) in prices paid by electricity producers for coal, petroleum, and natural gas. Based upon the standard deviation, natural gas prices are nearly seven-times more volatile than coal prices. As we increase our reliance on natural gas in power generation, the cushioning effect that low-cost PRB coal has on average fuel costs diminishes and average electricity rates become more sensitive to changes in natural gas prices. For regions like the Northeast and Pacific coast, this transition will further increase average electricity rates, which are already well above the national average. But for the industrial heartland, increasing the use of natural gas in electricity generation could dramatically increase electricity rates.
Many analysts have argued that the U.S. economy is entering an era of abundant natural gas. Indeed, recent price trends tend to support that view. A look at the long-term relationships between coal, petroleum, and natural gas prices illustrates the highly unusual spread that has opened between prices for natural gas, petroleum, and coal (see Figure 14). Prior to 2008, natural gas prices tended to track oil prices. Since then, natural gas prices have dropped while oil prices have remained high, opening a large differential between these two prices. Similarly, for most of the period between 1973 and 2008, coal was traded at a substantial discount relative to natural gas. Coal prices reached parity with natural gas prices briefly during the spring of 2012.
This historical record also suggests that there is considerable risk surrounding the proposition that the currently wide spread between prices for natural gas, coal, and petroleum could persist for many years into the future. Indeed, a plot of the price spreads between natural gas, coal, and oil plotted in Figure 15 illustrates that since the spring of 2012, the natural gas to coal price spread is reverting to its long-run mean of 2.21 (see Figure 15). The price spread between natural gas and oil is also increasing but remains well below the historical average. In the section below a more detailed analysis of the risks and costs associated with an over-reliance upon natural gas in power generation is discussed.
7. Value of PRB Coal to the U.S. Economy
The value of any economic activity is based upon the opportunity costs of providing alternative goods or services. There are many electric power technologies that could be considered as potential replacements for coalfired power generation. While there may be growing public support for nuclear power, long lead times for permitting and construction incur significant capital costs. Wind power may not be a viable option because it may be incapable of replacing base load capacity given its intermittent production profile. Thermal solar and photovoltaic power systems have even higher cost and have the same intermittency problems that wind power faces. Hence, the next best alternative to PRB coal is natural gas.
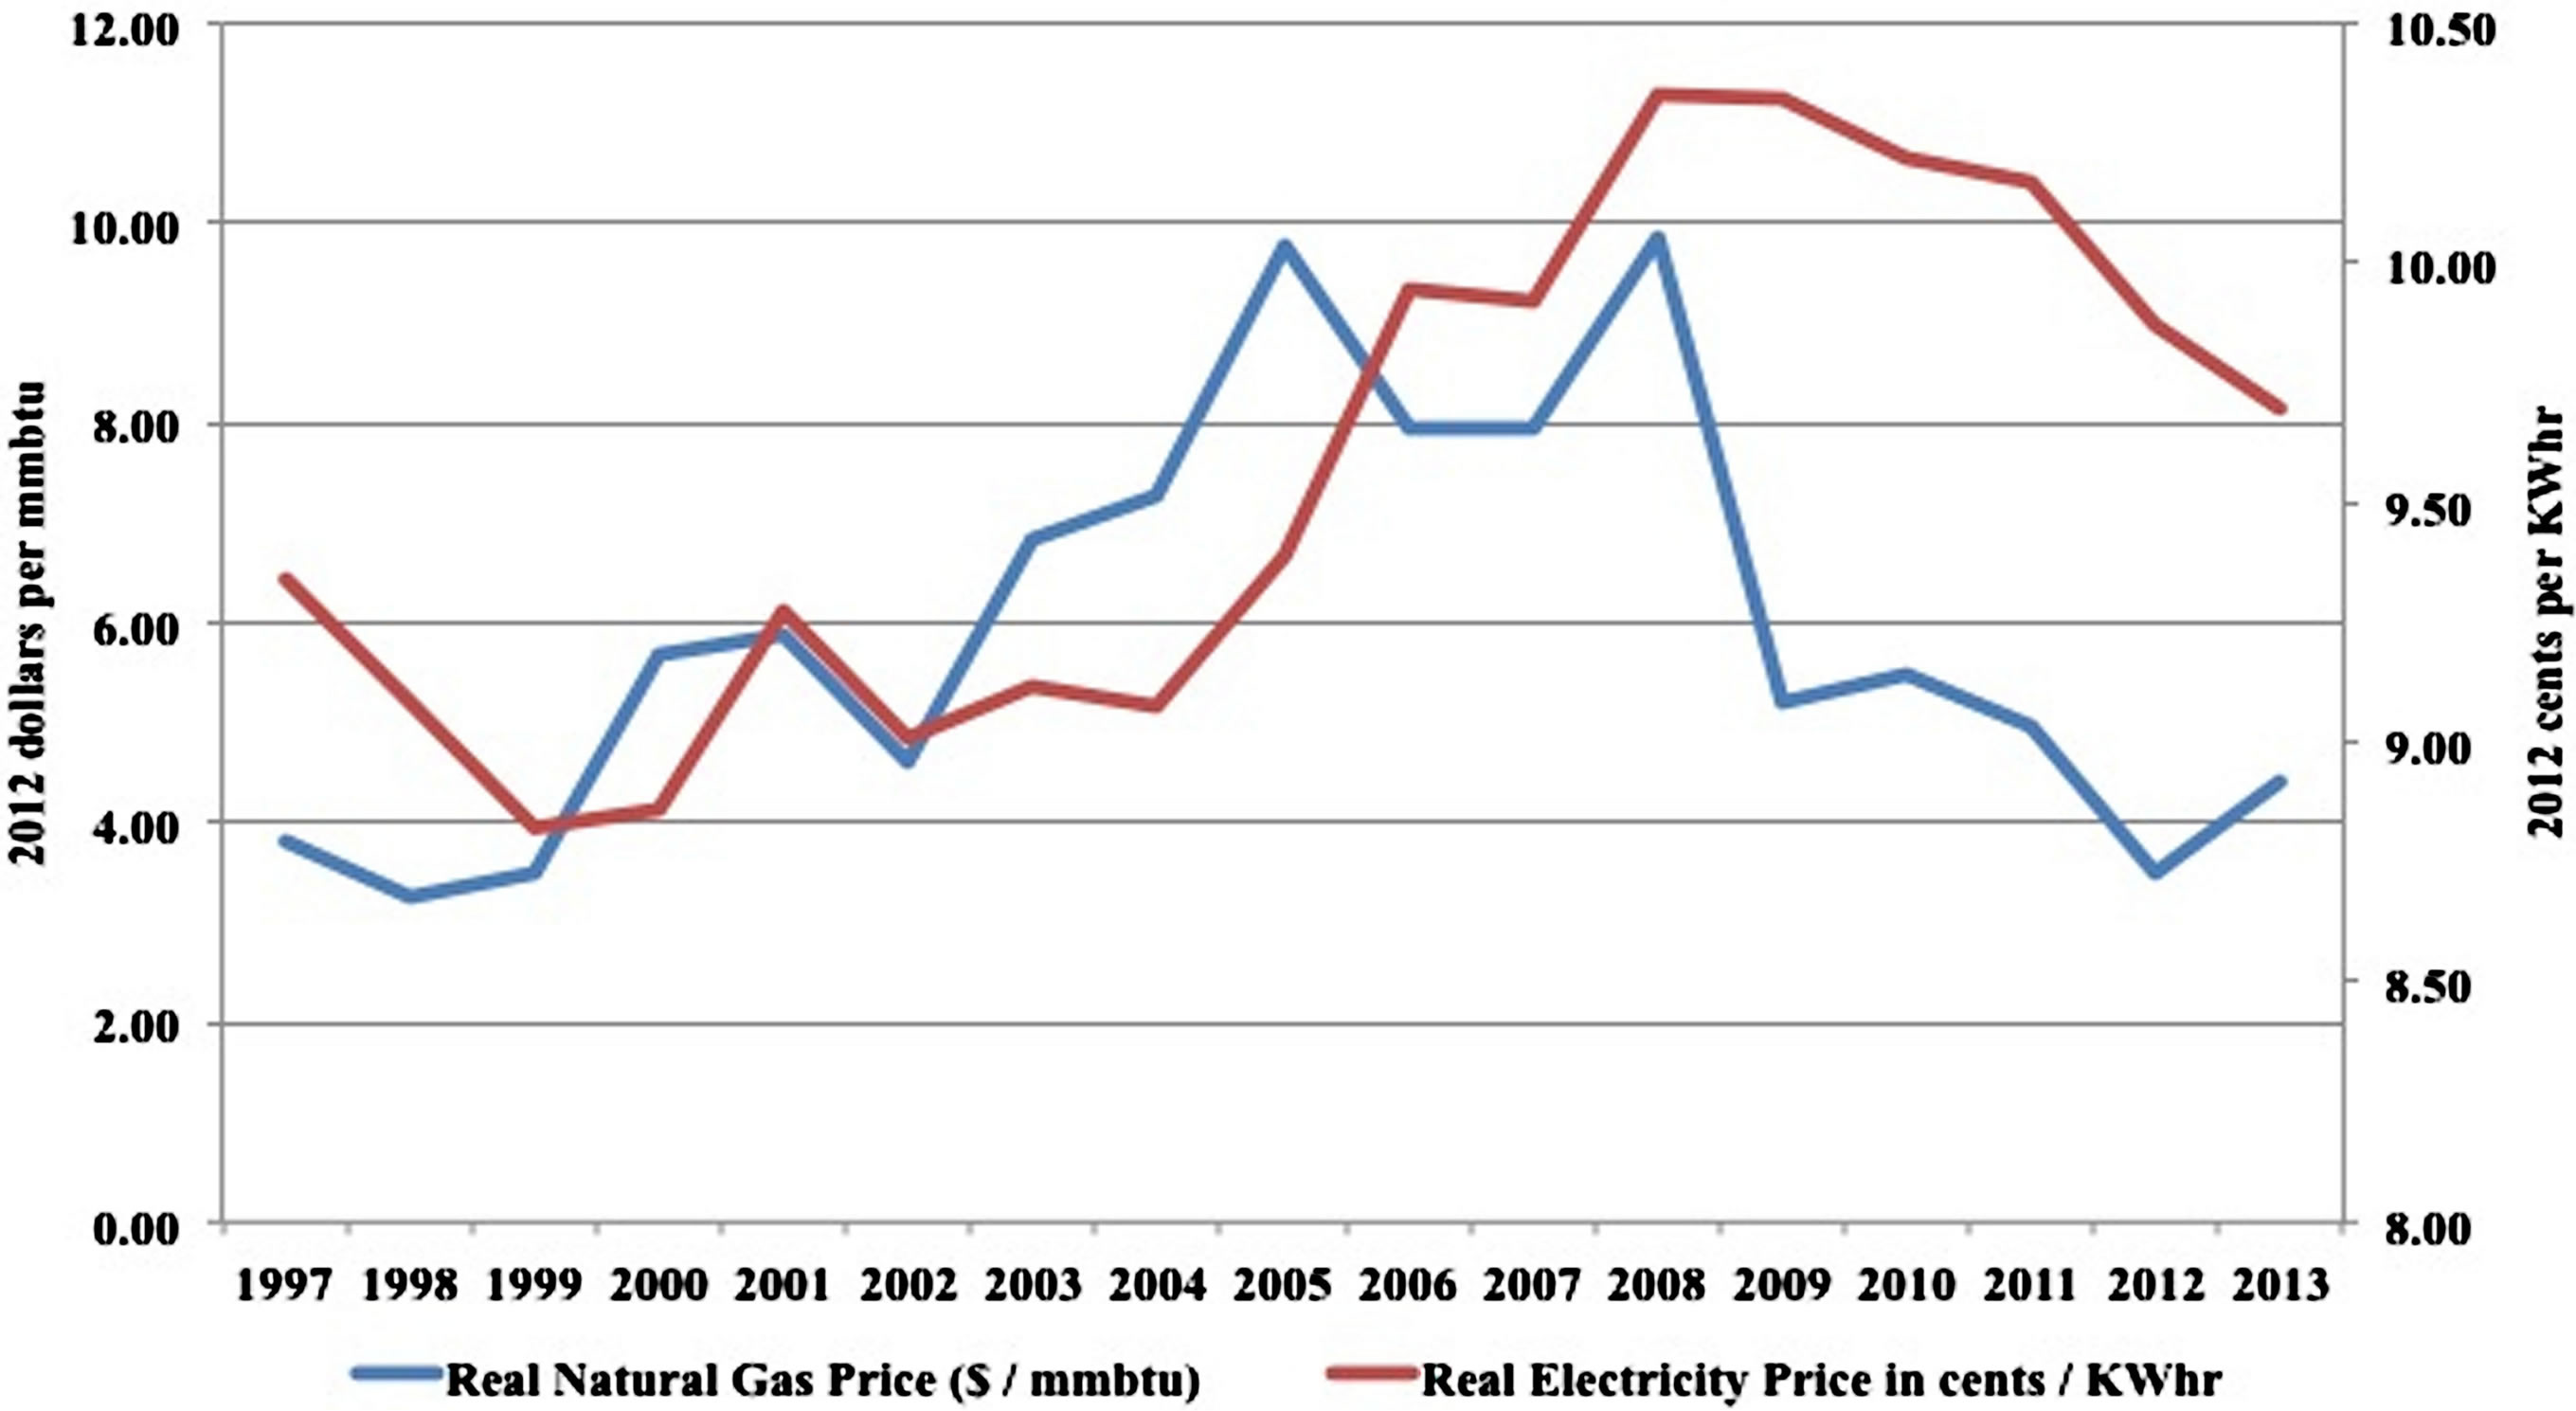
Figure 13. Real Prices for Electricity and Natural Gas, 1997-2013 [32,33].

Figure 14. Prices Paid for Fossil Fuels by Electric Utilities, 1973-2013 [34,35].
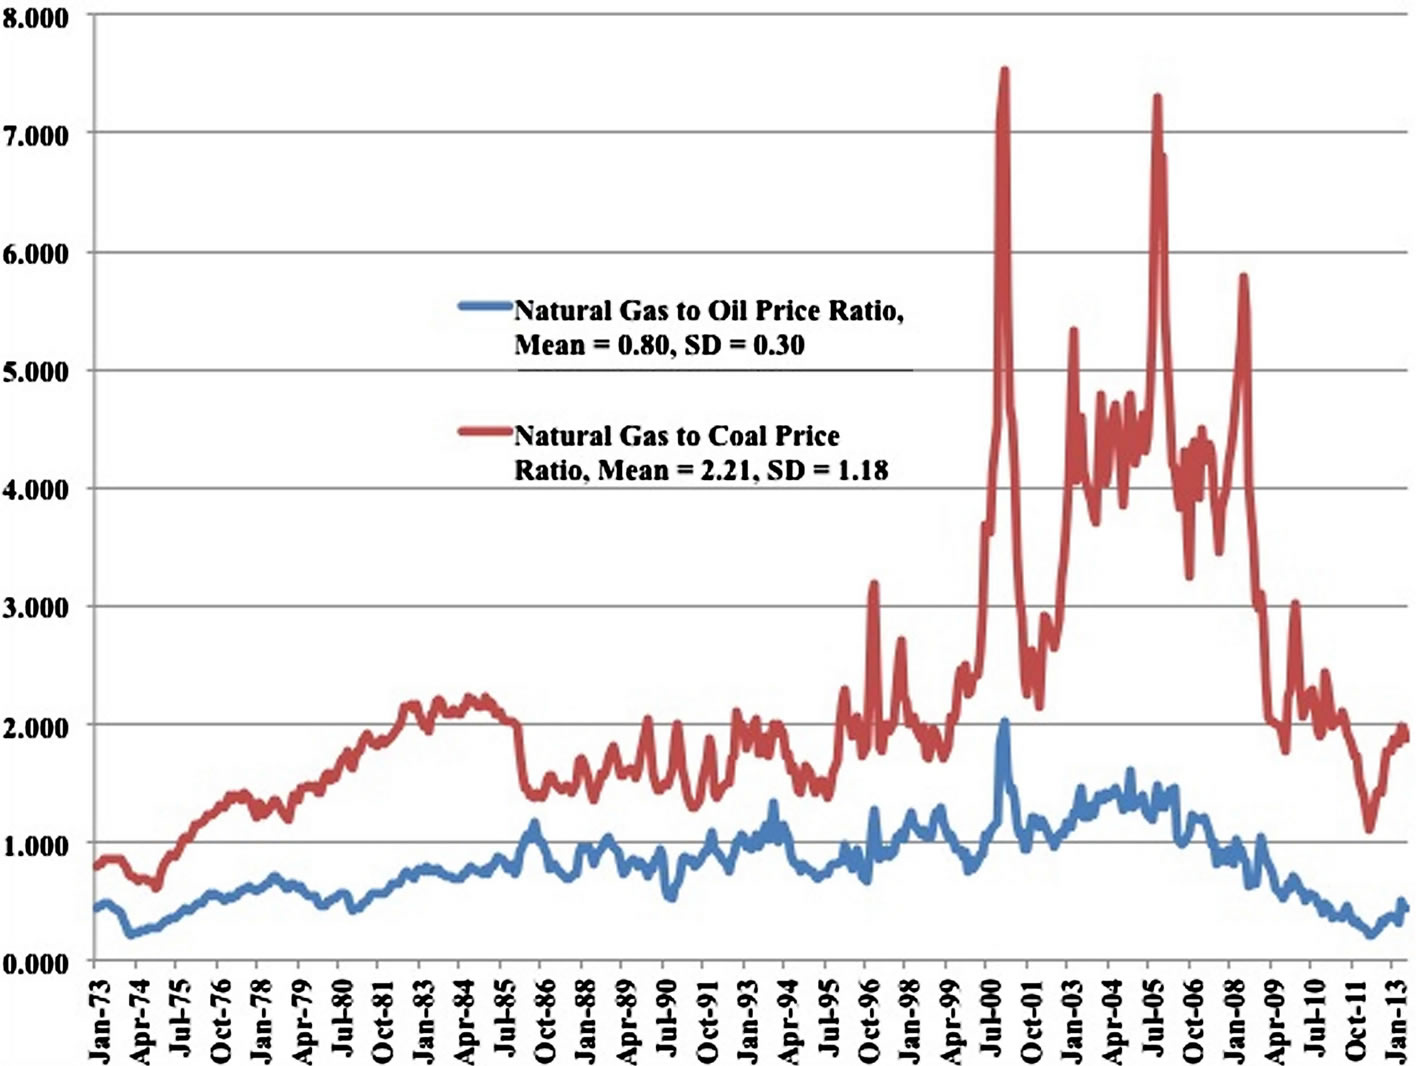
Figure 15. Price Spreads for Fossil Fuels Consumed by Electric Utilities, 1973-2013 [34,35].
Until the spike in wind power capacity additions since 2008, most new electric-generating capacity since the mid 1990s has been fired with natural gas. Electric power generation is now the single largest end-use of natural gas in the United States. Therefore, to estimate the value of PRB coal to the U.S. economy, this study estimates the impact on average retail electricity rates from phasing-out PRB coal in power generation and replacing it with natural gas.
How much natural gas would be required to replace PRB coal? During 2011, PRB coal was used to generate 676,471 million kilowatt hours of electricity, which is 18% of total electricity consumption in the U.S. The base year for this analysis is 2011 because wellhead prices for natural gas at $3.95 were closer to the historical mean than the $2.66 low reached during 2012. Given the thermal efficiencies of existing natural gas capacity, replacing PRB coal-based generation would require slightly more than 5.5 trillion cubic feet of natural gas per year. This expansion of natural gas use would require a 26.2% increase in U.S. natural gas supplies from 2011 production levels.
Such a dramatic expansion of natural gas use would bid up prices. The extent of the price increase depends upon the responsiveness of natural gas supply to price, or the price elasticity of supply. To determine this elasticity, this study computed the percentage changes in price and production between the Energy Information Administration’s reference case forecast [36] with the high and low demand scenarios. Such a comparison allows a controlled experiment in which exogenous factors affecting supply are held fixed while demand is varied, similar to the case under study here in which the demand for natural gas would increase to replace PRB coal. The results indicate that the median supply elasticity is 0.345. In other words, for every ten percent increase in natural gas prices, producers expand production almost 3.5 percent.
To achieve a 26% increase in natural gas production to replace PRB coal, therefore, wellhead natural gas prices would have to increase 76% (26.2%/0.345), increasing wellhead natural gas prices from an average of $3.95 per thousand cubic feet (mcf) during 2011 to over $6.7 per mcf. Assuming the costs of transporting and distributing natural gas are constant, this wellhead price increase would increase natural gas prices paid by residential, commercial, industrial, and electricity producers by 27%, 33%, 59%, and 61% respectively.
These estimates may be conservative because natural gas prices peaked at over $12 per mcf in nominal terms several times over the past three years without a major expansion in demand. Moreover, the upward pressure on natural gas prices could be even greater if it occurred after additional consumption of natural gas emerged from the industrial sector. Many chemical producers are beginning to increase their use of natural gas to produce ethylene and other chemical products. Similarly, several large transportation companies are converting their vehicles to use compressed and liquefied natural gas (LNG). There are also several large LNG export terminal under construction that will become operational over the next few years.
These higher natural gas prices would increase electricity rates. Electricity producers and consumers would have to pay for new capacity and for the higher costs of running new and existing capacity at higher natural gas prices. The central part of the United States with most of our nation’s manufacturing capacity would be most affected by replacing PRB coal with natural gas. Average retail electricity rates would increase 64% in the west north central states, 29% in the west south central states, 21% in the east north central states, and 14% in the east south central states (Figure 16).
Even though other regions do not directly consume PRB coal, higher natural gas prices would force up electricity rates in these areas. For example, average retail electricity rates would increase on average 7% in New England, the Mid-Atlantic, South Atlantic, and Pacific regions. Nationwide, eliminating PRB coal use would drive up average retail electricity rates by more than 17%.
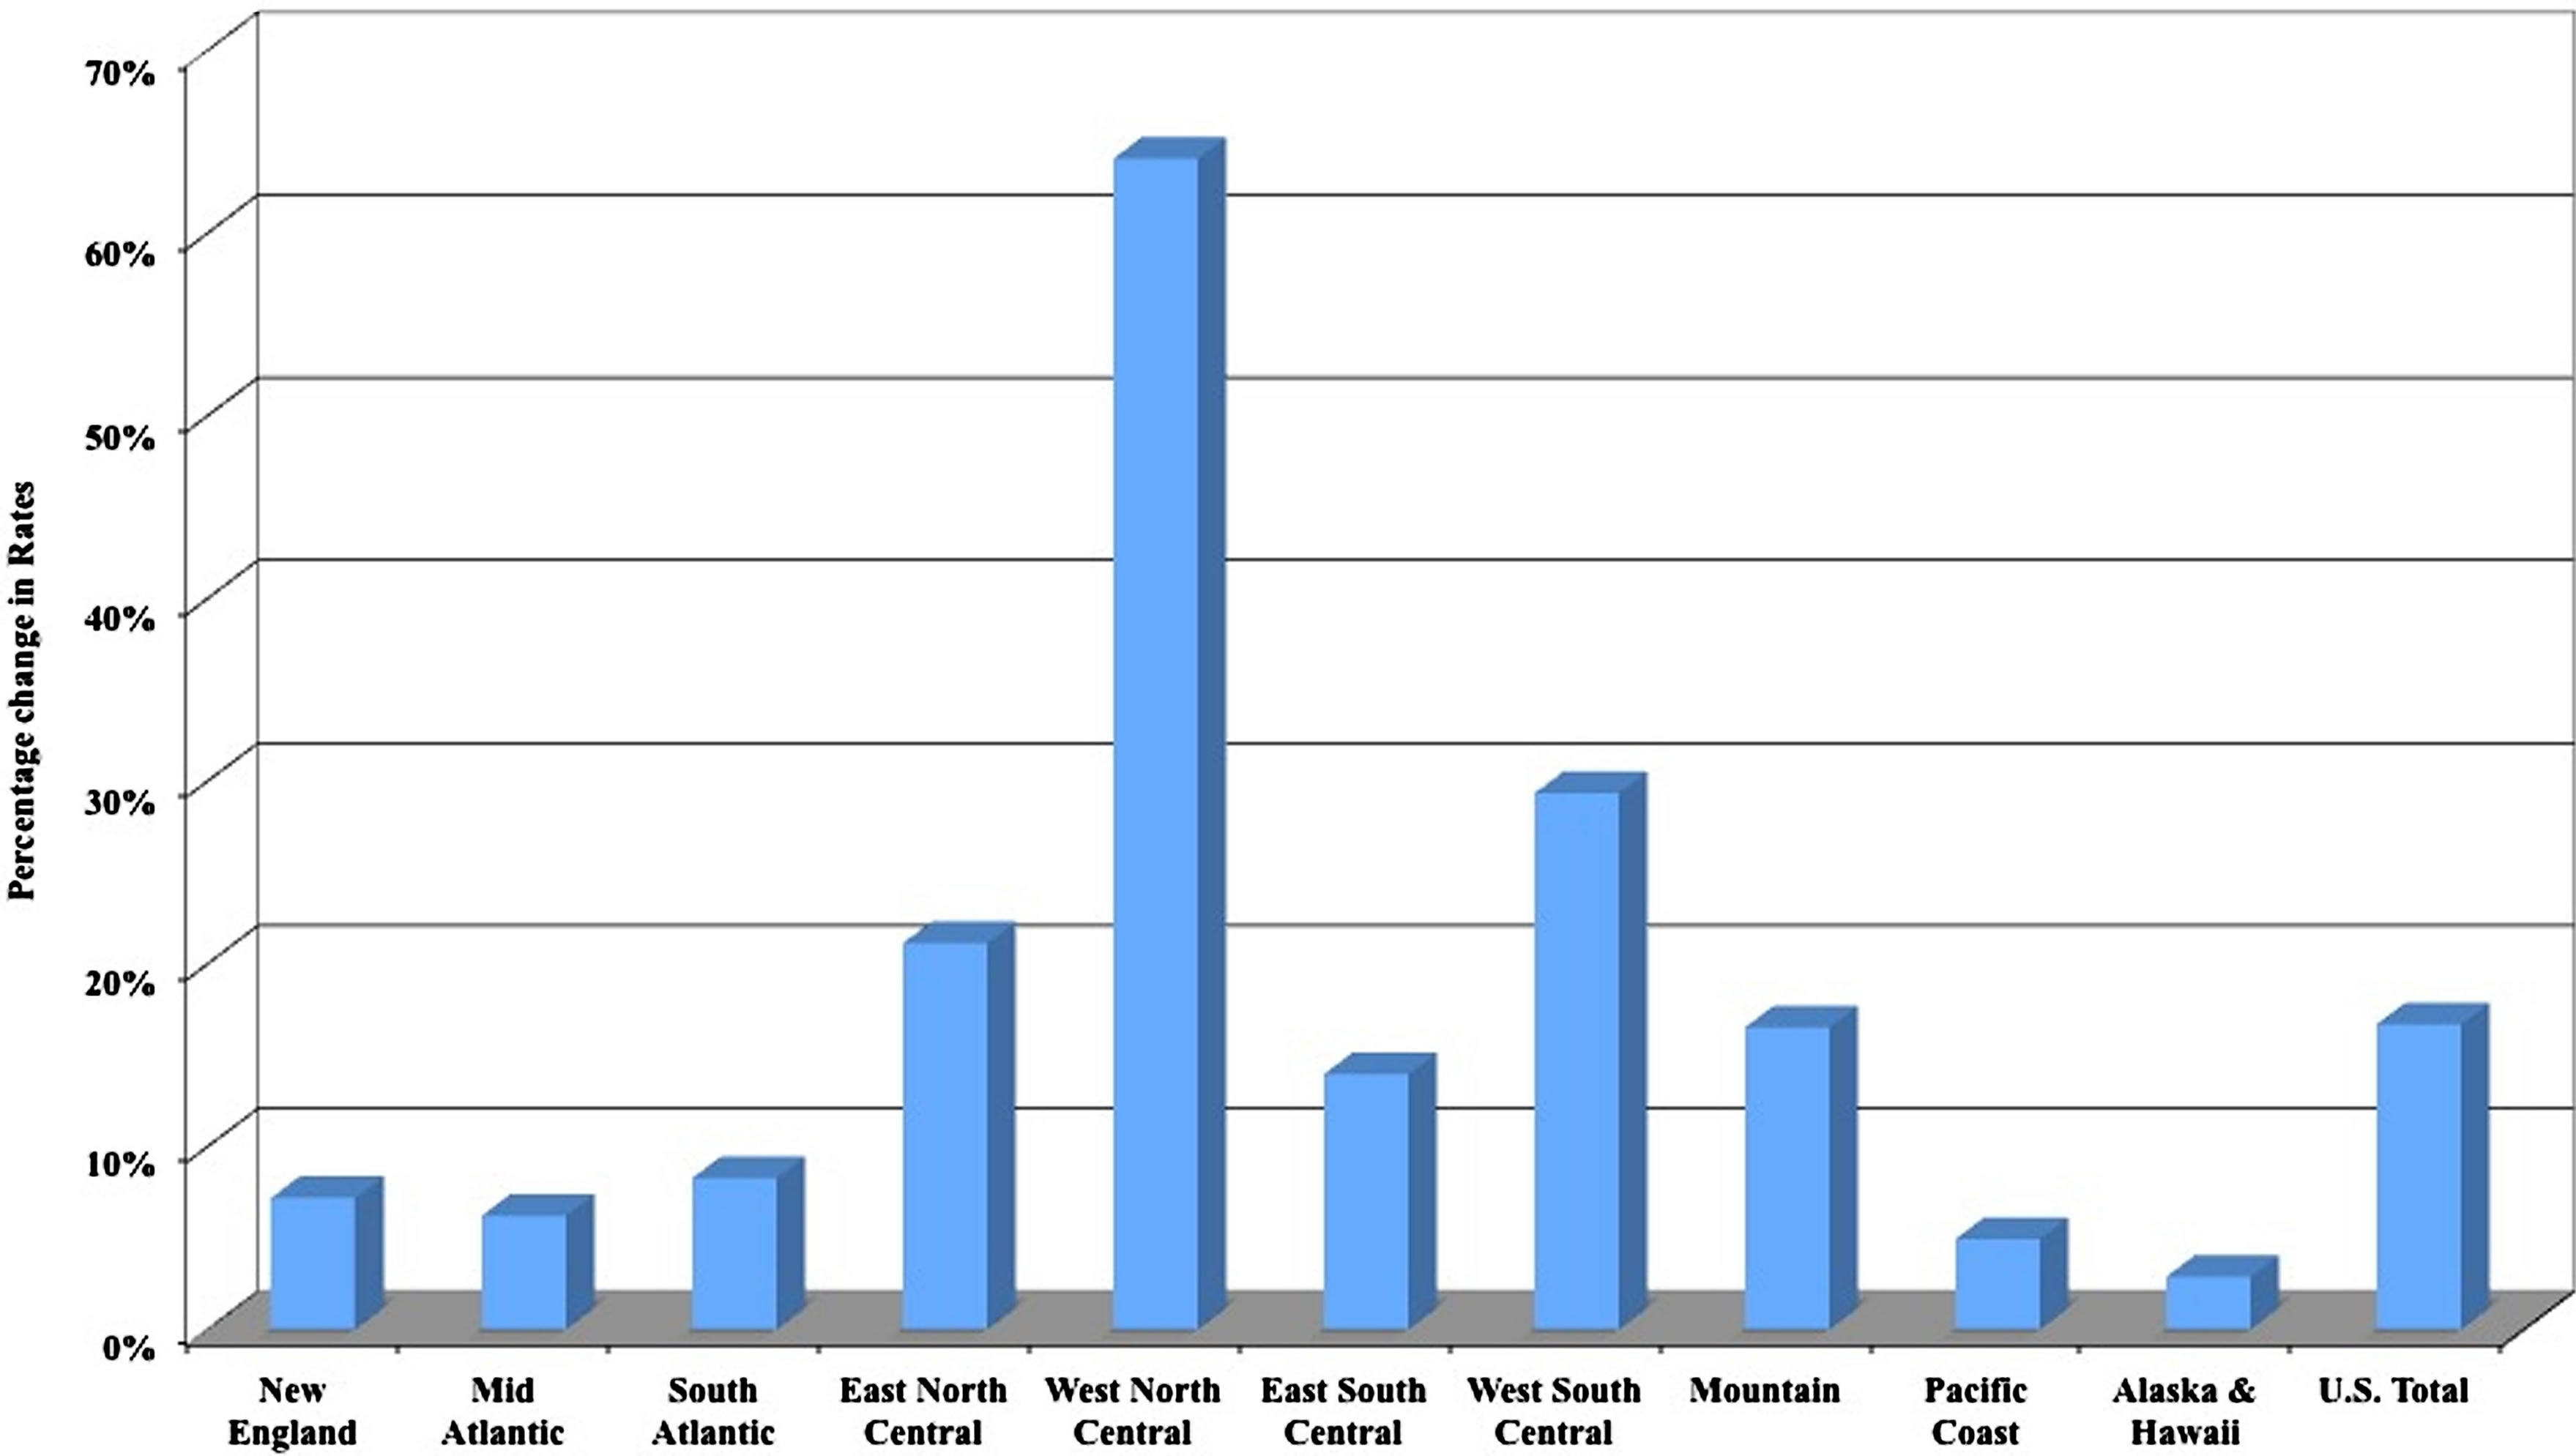
Figure 16. Changes in 2011 Electricity Rates from Replacing PRB Coal with Natural Gas.
These opportunity cost calculations reveal that PRB coal plays an important role in keeping our nation’s electricity costs under control, especially for the large industrial users in the central part of the United States. Without PRB coal, the very low electricity rates that keep large industrial users competitive in world export markets would be replaced by substantially higher rates (see Figure 17).
The decomposition of average retail electricity rate changes by region appears in Table 2. The second column of Table 2 reports the actual average retail electricity rate by region during 2011, which can be considered as the base case using PRB coal. The third column presents estimates of the rate increase due to replacing PRB coal with natural gas at these higher prices. The size of the increase reflects the relative importance of PRB coal in the electricity generation mix. For example, the rate increases for the West North Central region, which includes Iowa, Illinois, Kansas, Missouri, Nebraska, and Wyoming, are substantial because PRB coal-based generation constitutes such a large share of their portfolio of electric power generation assets.
Given higher natural gas prices, the costs of operating existing gas-fired capacity across the nation also would increase. The incremental effect of these cost increases on electricity rates appear in the fourth column of Table 2. For example, rates increase one cent per kilowatt-hour in New England even though that region does not consume PRB coal. The combined impact of these two components on average retail electricity rates and their percentage increases appear in the last two columns of Table 2. In a world without PRB coal, average retail electricity rates for many states would be higher than what they are today (see Table 2).
These electricity rate increases imply that consumers in the U.S. would pay $62 billion more each year for electricity. In addition, consumers of natural gas would pay $45 billion more per year because natural gas prices would be higher without PRB coal. So in total, by using PRB coal, the U.S. economy avoids $107 billion per year in higher energy costs. In addition to these costs are the avoided macroeconomic impacts, such as reductions in industrial output and employment that would result from large industrial users relocating to other nations with relatively lower electricity rates.
Replacing PRB coal with nuclear power, solar thermal, or wind power would pose a daunting challenge and would raise electricity rates considerably more. The value of PRB to society includes the avoided costs from replacing this energy and the avoided adverse economic impacts from higher electricity rates and natural gas prices. As the natural gas example illustrates, the additional costs from producing more than 5.5 TCF of natural gas and associated impacts on electricity rates are significant. Replacing PRB coal with other energy resources implies some rather implausible resource requirements such as:
• 91 one-thousand megawatt capacity nuclear power plants operating at 85% capacity, or
• 169 hydroelectric plants the size of Hoover dam producing 4 billion kwhr per year, or
• 368,815,104 cords of wood, or
• 193,057 wind turbines each at 2 MW operating with a 20% capacity factor.
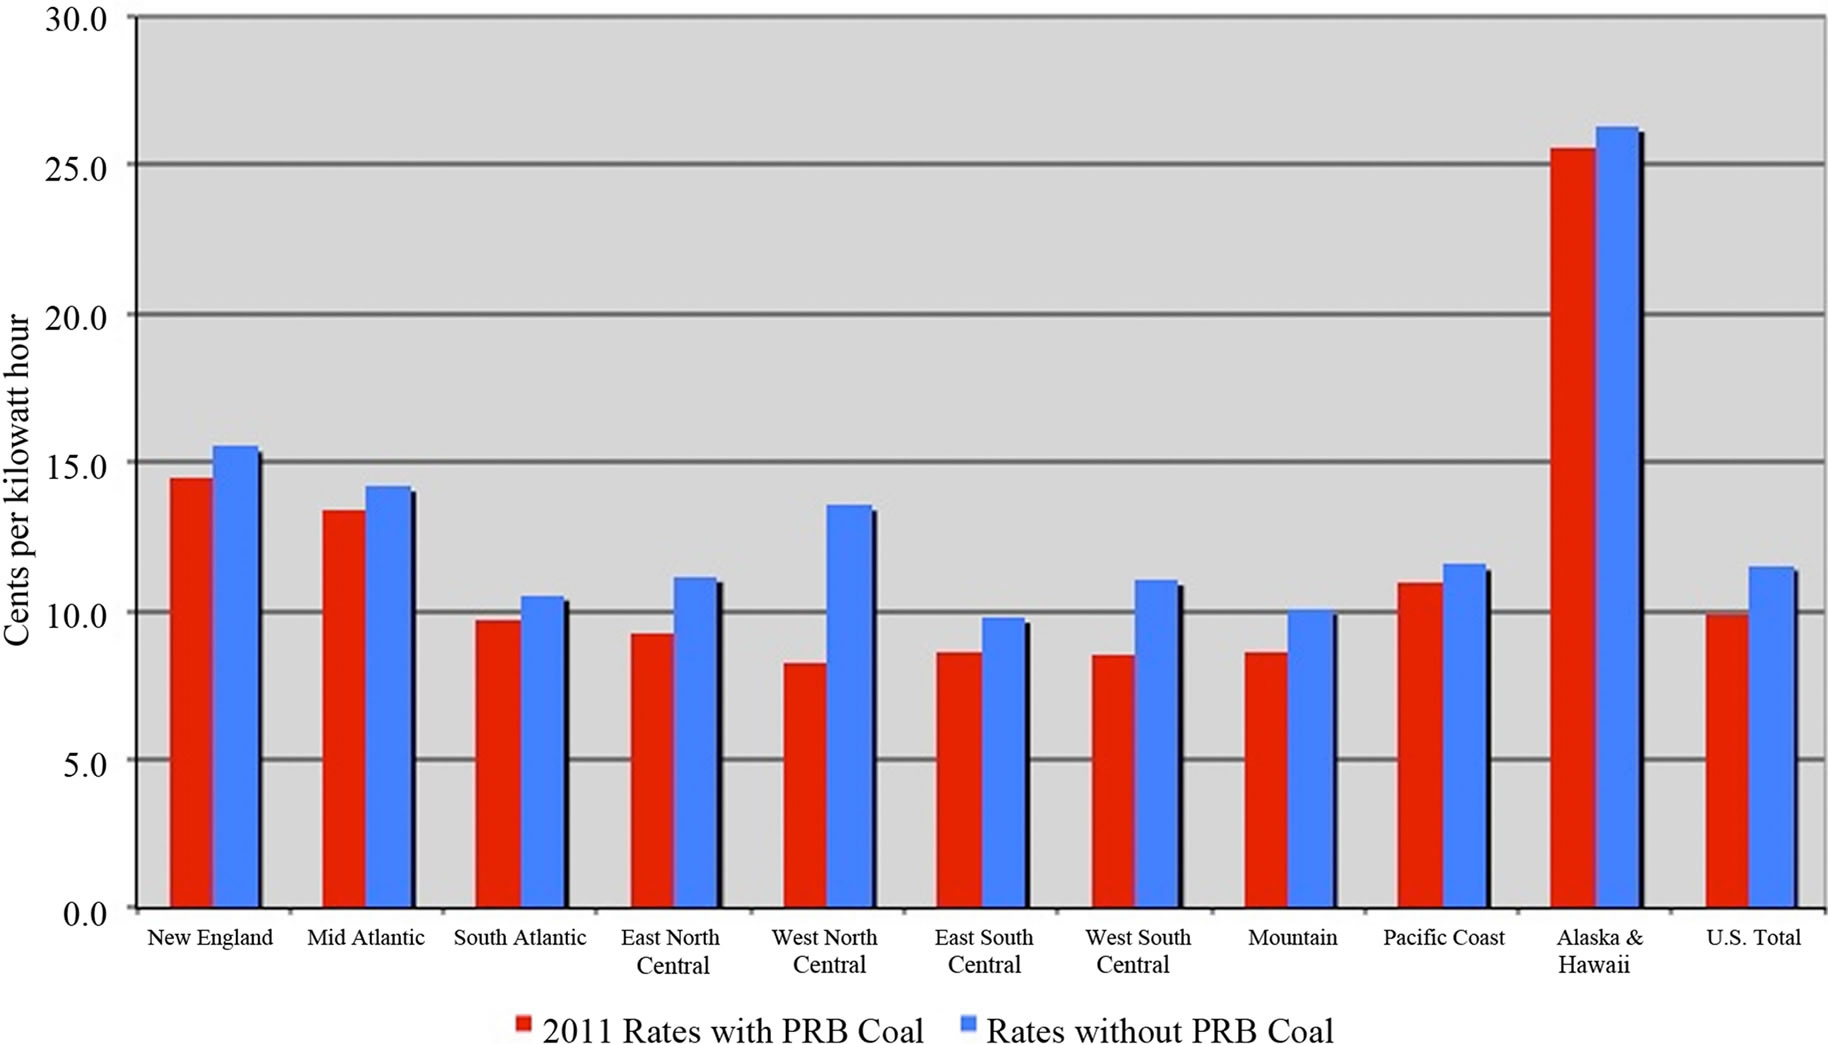
Figure 17. Electricity Rates by Regions with and without PRB Coal.
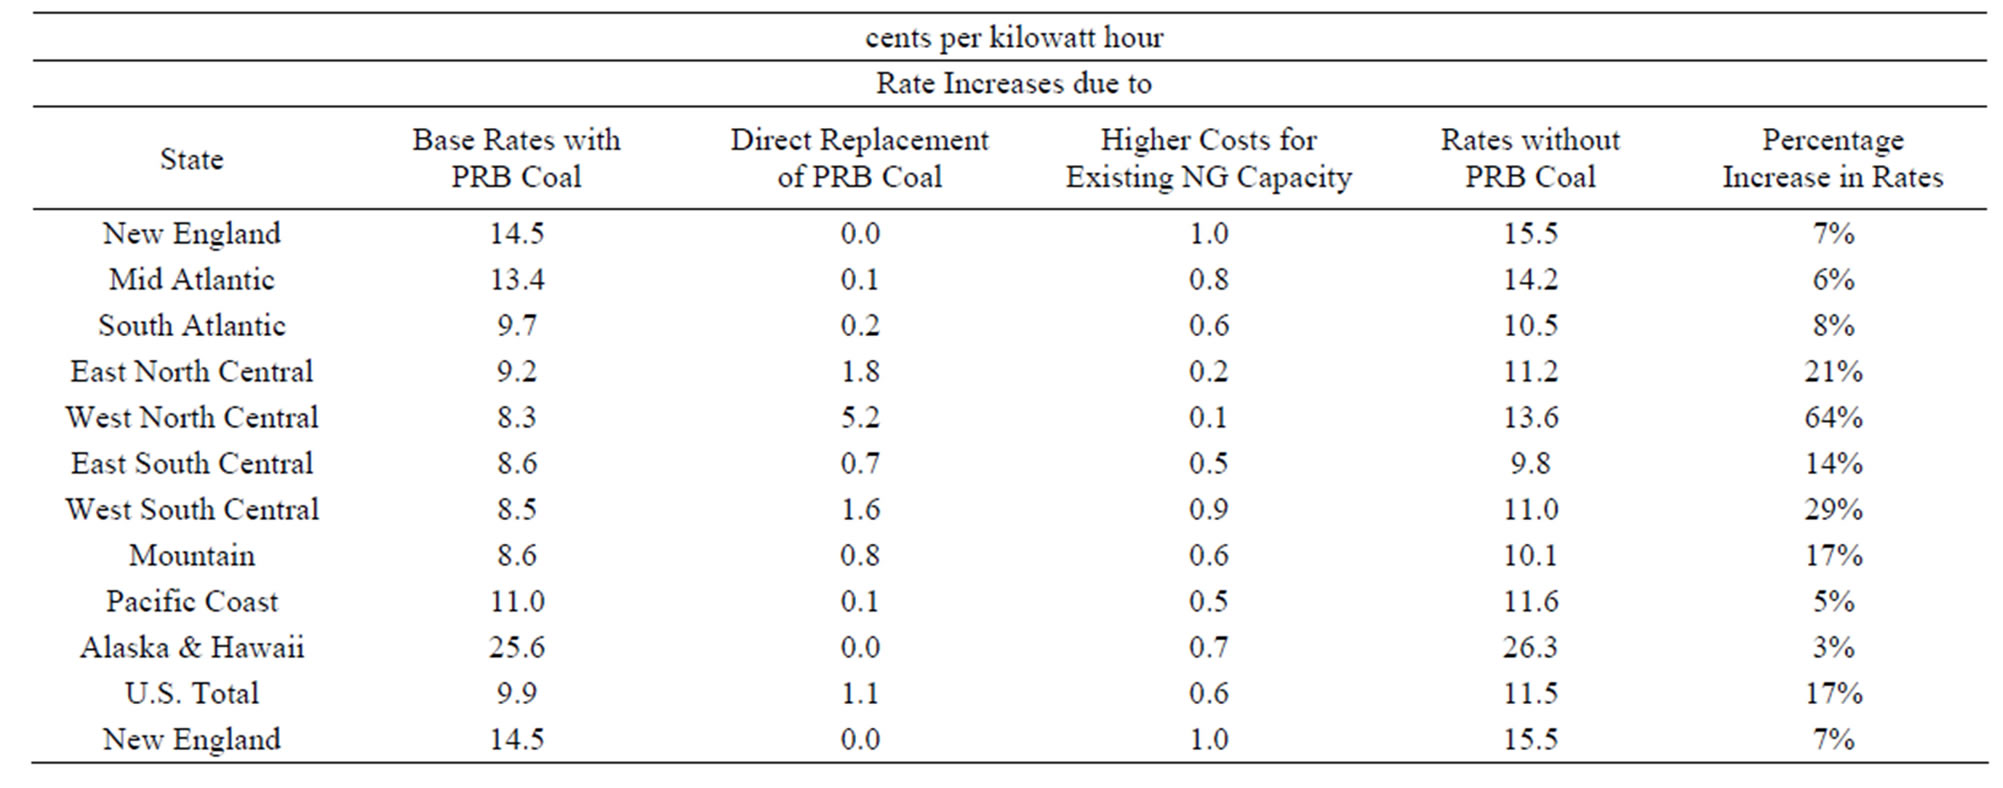
Table 2. Average Retail Electricity Rates with and without PRB Coal.
The hydroelectric option is not feasible because capacity is already maximized. Harvesting over 350 million cords of wood per year is not sustainable because such a rate would deplete the entire stock of standing forests in the U.S. in slightly over three years. Wind generation faces technical challenges because some form of backup generation would be required. This leaves nuclear power as the only technically feasible alternative to natural gas in replacing PRB coal. The cost of dramatically expanding nuclear electricity capacity, however, is likely to be quite significant due to insufficient engineering construction infrastructure and very long lead times for licensing and construction.
8. The Net Benefits of PRB Coal
This study documents the rise of PRB coal and estimates its value to the U.S. economy. Rather than focusing on value added in coal mining, the study assessing value in terms of opportunity costs. In other words, the value of PRB coal is equal to cost of supplying energy from the next best alternative and, in this case, that is natural gas. Using average wellhead natural gas prices during 2011, this study estimates that the value of PRB coal to the U.S. economy is $107 billion per year. These benefits rise substantially with the price of natural gas and even more so if the next best alternative to PRB coal is nuclear or renewable energy.
These benefits, however, should be considered in light of the social costs arising from the environmental impacts from coal pollution. Muller et al. [37] report that the gross environmental damages from U.S. coal-fired electric power generation amount to $53.4 billion in 2000 dollars, which is $68.3 billion in 2011 dollars, under their base case analysis. These costs include impacts arising from criteria and greenhouse gas emissions. Given that PRB coal is used to generate 40% of coal-fired electric power generation in the U.S., the gross environmental damages from utilizing PRB coal are $27.4 billion. Thus, under the base case assumptions, the economic benefits of PRB coal in terms of moderating overall energy costs in the U.S. economy exceed the social costs arising from the environmental impacts by nearly a factor of four.
Under the high and low estimates for gross environmental damages developed by Muller et al. [37], this benefit-cost ratio would range from 1.5 and 11 (see column three in Table 3). Under the low natural gas prices experienced during 2012, the benefit-cost ratio with high environmental damage estimates is 1.2 (see column 2, Table 3). Hence, even under rather stringent assumptions for environmental damage costs and low natural gas prices, the net social benefit-cost ratio for PRB coal remains above unity. This finding suggests that under a rather wide range of economic conditions and environmental impacts, the social benefits of using PRB coal are significantly greater than the social costs in terms of environmental damage costs.
9. The Challenges and Opportunities
The expected net benefits of using PRB coal that consider both economic and environmental impacts, average slightly over $79 billion, ranging from $16 to $133 billion depending upon natural gas prices and the valuation of environmental impacts. Clearly, utilizing PRB coal makes economic sense even after factoring in the environmental impacts.
Significant challenges lie ahead. First and foremost are proposed regulations on criteria air pollutants and greenhouse gas emissions. The broad reach of these regulations is creating a great deal of uncertainty and a reluctance of electric power producers to operate coal power plants much less invest in new ones. For example, there is a three-year compliance deadline under Utility Maxi
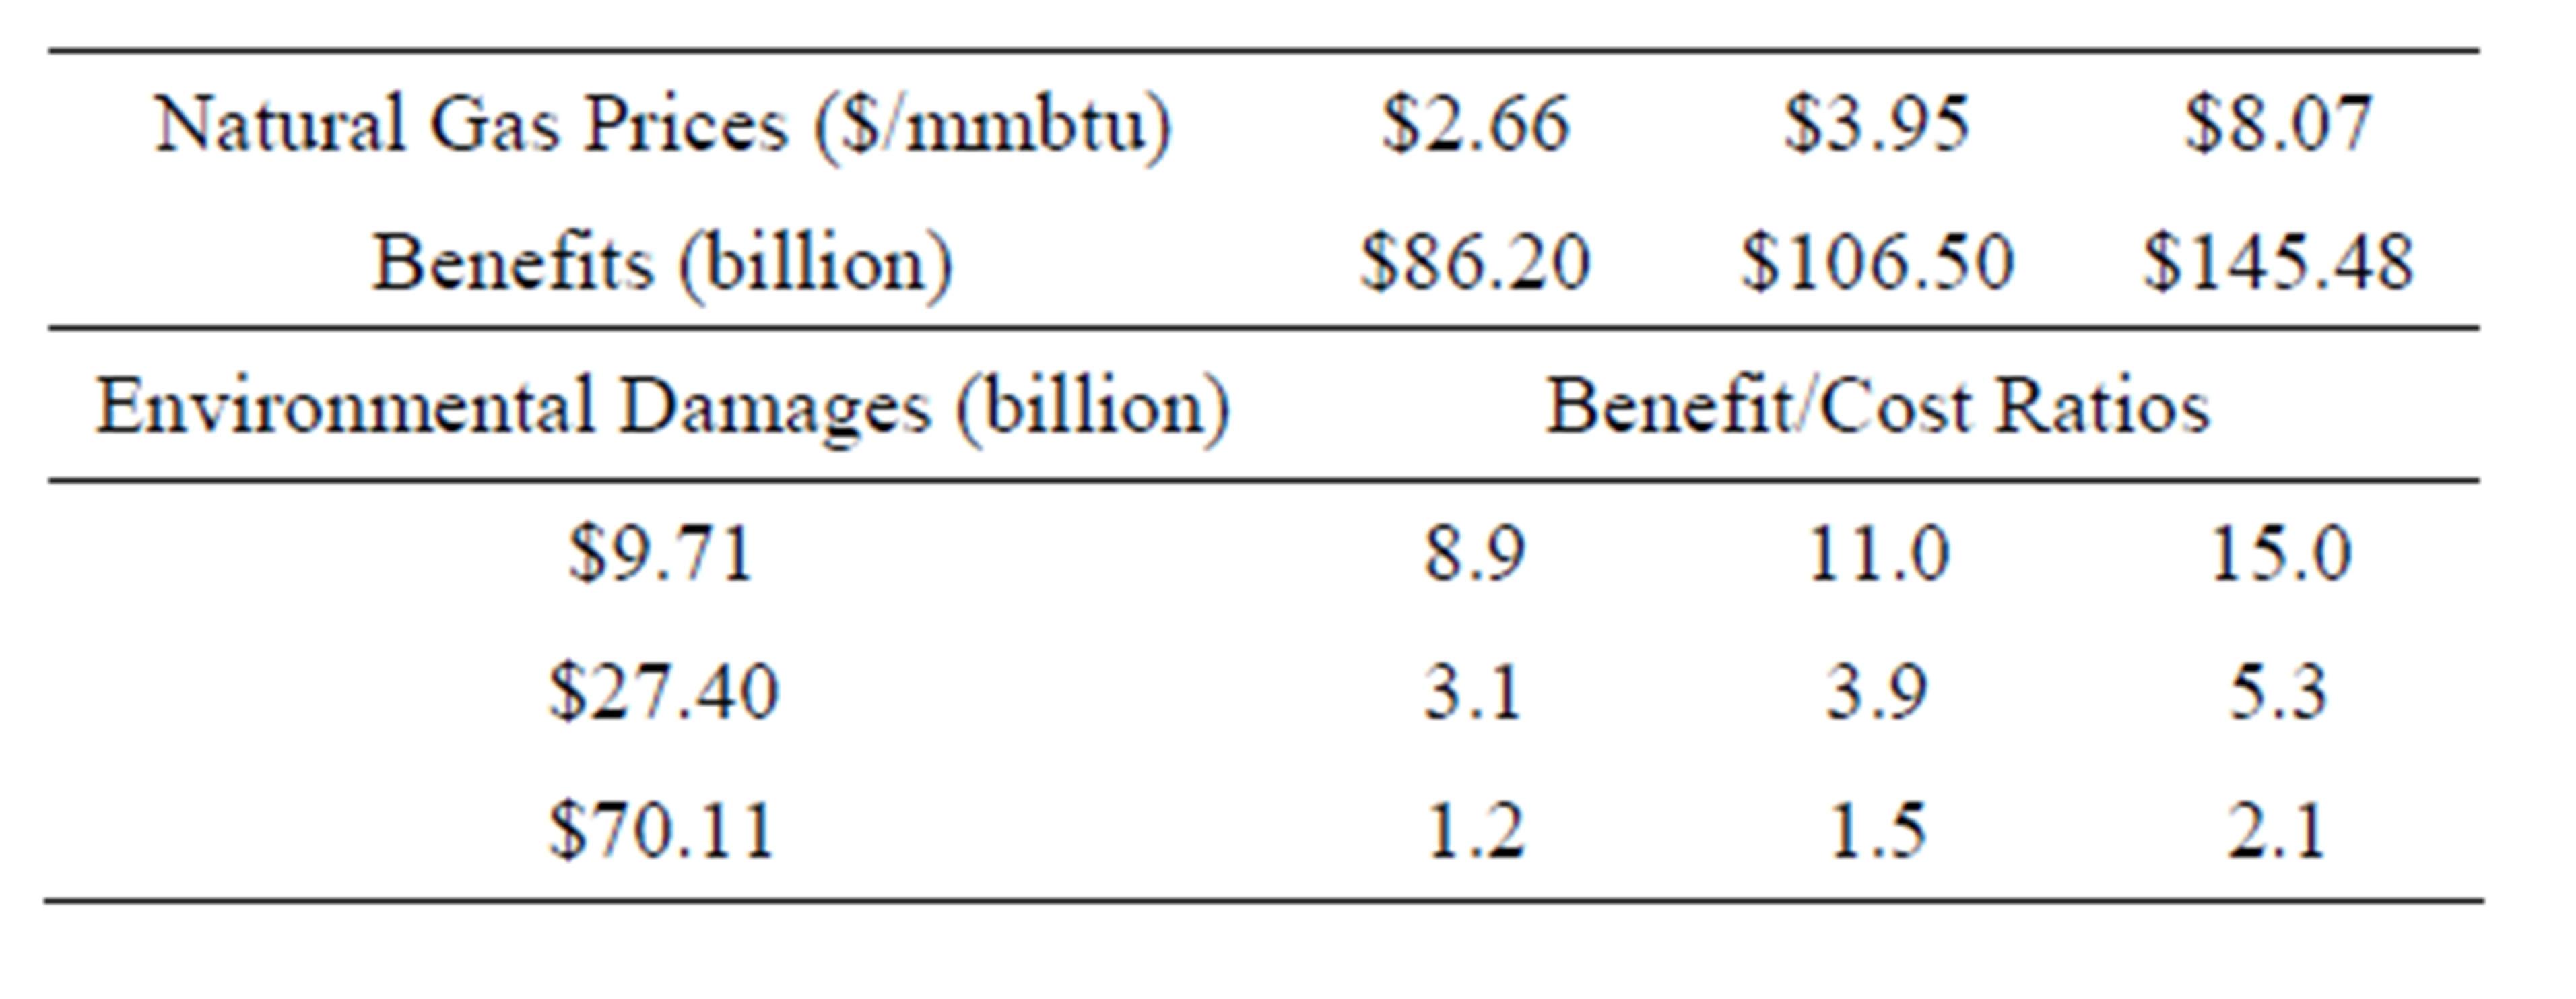
Table 3. Social Benefit-Cost Ratios for PRB Coal.
mum Achievable Control Technology (UMACT) regulations so investments made to comply with these standards could be stranded by new source performance standards for greenhouse gas emissions. As a result, announced and expected coal-fired power plant retirements are from 50 to 75 gigawatts (GW) [38]. Pham and Ikenson [39] find that the combined cost of implementing these regulations are not commensurate with their economic and health benefits.
While technologies exist for capturing carbon dioxide (CO2) from electric power plants, they are not yet deployed in the United States. In contrast, the technology for transporting and injecting CO2 is commercialized in certain markets. Dedicated pipelines exist for transporting carbon dioxide and injecting carbon dioxide into oil reservoirs for enhanced oil recovery. Hence, the technology exists for capturing, transporting, and storing CO2 but large-scale fully integrated systems with electric power plants are not yet deployed given the lack of economic incentives.
While the proposed EPA rules for greenhouse gas emissions may be overturned on legal grounds, the threat of future regulatory standards would most likely seriously stall any plans to invest in new coal-fired capacity. Indeed, one could argue that the coal industry could be better off under a market-based system of CO2 permits that could provide more certainty. The neutralizing of the SO2 permit trading system by more stringent regulatory standards, however, casts a pall over the expected longevity of any market-based trading system for carbon dioxide [40]. Given this uncertainty, why would firms invest in coal-based technologies to reduce greenhouse gas emissions? The abandonment of market-based solutions and the adoption of rigid regulatory standards impose significant efficiency losses on the electric power system and the U.S. economy.
Another challenge is that natural gas use in power generation will continue to expand [41]. While significant shale gas discoveries may allow such expansion, natural gas prices are prone to spike. Natural gas prices over the long run move with oil prices but do exhibit significant departures from heat equivalent parity with oil due to natural gas supply and demand imbalances.
Given the size of the international coal market and the highly competitive costs of PRB coal production, Wyoming and Montana have the potential to export significantly greater amounts of PRB coal. One of the key bottlenecks in making higher coal exports a reality involves getting approval of coal port expansions in the Pacific Northwest and the Gulf Coast region in Texas and Louisiana. Canada is another route PRB coal could take to foreign markets. According to Schaefer [42] there is more than 150 million tons of coal export capacity proposed in Oregon and Washington. Even if half of this capacity is built and with additional export capacity in the Gulf Coast region and even Canada, the loss of domestic coal sales could conceivably be more than offset with expanded exports of PRB coal.
While the reserves of coal and natural gas worldwide are ample, there is growing concern that world supplies of light sweet crude oil likely will reach a peak sometime before 2050. This is of particular concern as the Chinese and other Asian economies enjoy rising levels of affluence and with this a growing desire for mobility and liquid transportation fuels.
Despite the renaissance of the American oil industry, finding a cost effective and environmentally acceptable substitute for liquid petroleum fuels will be a key challenge for the world economy in the decades ahead and a significant opportunity for PRB coal producers, either through direct manufacturing of liquid fuels from coal or indirectly through the production of electricity for electric vehicles.
10. Conclusions
PRB coal has contributed to lower electricity prices nationwide and in particular in the Midwest, South, and Western U.S. These lower electricity prices have spurred productivity growth by encouraging the continued electrification of our economy. High productivity levels have been important in maintaining U.S. industrial competitiveness and in retaining manufacturing in America. The energy and material efficiency of U.S. manufacturing is the highest in the world and is a key source of strength as U.S. companies compete in world markets. PRB coal plays an important role in maintaining this industrial leadership and the export capability of the U.S. economy.
Powder River Basin coal plays a key role in providing affordable and reliable energy for the American economy. The opportunity cost of not using PRB coal would involve substantially greater use of natural gas that would bid up natural gas prices. This study estimates that these opportunity costs are $107 billion. Hence, the value of PRB coal to the U.S. economy is that energy costs are $107 billion lower than they would be without PRB coal. The environmental damage costs associated with PRB coal use amount to $27 billion. Hence, the net social benefit of using PRB coal is $80 billion. Under low natural gas and high environmental damage cost estimates, the net social benefits of PRB coal are $16 billion. If natural gas prices double from current levels and lower environmental damage cost estimates apply, the net social benefits rise to over $140 billion. So under a range of assumptions and scenarios, the net social benefits of using PRB coal remain positive.
Given the sheer size of this energy reserve, the Powder River Basin will likely continue to provide energy for future generations both here in the United States and particularly abroad, as these low-cost, relatively clean coal energy resources are exported to developing countries.
The demonstrated success of PRB producers in providing high volumes of low-cost coal and the ingenuity of coal users to adapt to the changing environmental standards and market conditions are sound reasons to remain cautiously optimistic about future prospects for PRB coal as long as policy makers keep in mind that using these resources generates net social benefits under current technology.
REFERENCES
- R. Ayers and B. Warr, “The Economic Growth Engine: How Energy and Work Drive Material Prosperity,” Edward Elgar Publishing, Cheltenham, 2009.
- British Petroleum, “Statistical Review of World Energy,” 2013. http://www.bp.com/en/global/corporate/about-bp/statistical-review-of-world-energy-2013.html.
- S. Gerking and S. Hamilton, “What Explains the Increased Utilization of Powder River Basin Coal in Electric Power Generation?” American Journal of Agricultural Economics, Vol. 90, No. 4, 2008, pp. 933-950. http://dx.doi.org/10.1111/j.1467-8276.2008.01147.x
- M. Busse, and N. Keohane, “Market Effects of Environmental Regulation: Coal, Railroads, and the 1990 Clean Air Act,” Rand Journal of Economics, 2007, Vol. 38, No. 3, pp. 1159-1179. http://dx.doi.org/10.1111/j.0741-6261.2007.00130.x
- D. Barnes and W. Floor, “Rural Energy in Developing Countries: A Challenge for Economic Development,” Annual Review of Energy and Environment, Vol. 21, No. 2, 1996, pp. 497-530. http://dx.doi.org/10.1146/annurev.energy.21.1.497
- T. Gutowski, S. Sahni, J. Allwood, M. Ashby and E. Worrell, “The Energy Required to Produce Materials: Constraints on Energy-Intensity Improvements, Parameters of Demand,” Philosophical Transactions of the Royal Society, Vol. 371, No. 1986, 2013, pp. 1-14.
- T. Considine, “Economic and Technological Determinants of the Material Intensity of Use,” Land Economics, Vol. 67, No. 1, 1991, pp. 99-115. http://dx.doi.org/10.2307/3146489
- J. Van Den Bergh and M. Janssen, “Economics on Industrial Ecology: Materials, Structural Change, and Spatial Scales,” Massachusetts Institute of Technology, Cambridge, 2004.
- Office of Technology Assessment, “Energy in Developing Countries,” Report OTA-E-486, 1991.
- Office of Technology Assessment, “Fueling Development: Energy Technologies for Developing Countries,” Report OTA-E-516, 1992.
- World Bank, “World Development Report 1994: Infrastructure for Development,” 1994. https://openknowledge.worldbank.org/handle/10986/5977
- U.S. Energy Information Administration, “U.S. EnergyRelated Carbon Dioxide Emissions,” 2012. http://www.eia.gov/environment/emissions/carbon/pdf/2012_co2analysis.pdf
- S. H. Schurr, “Energy Use, Technological Change, and Productive Efficiency: An Economic-Historical Interpretation,” Annual Review of Energy, Vol. 9, No. 2, 1984, pp. 409-425. http://dx.doi.org/10.1146/annurev.eg.09.110184.002205
- D. W. Jorgenson, “Energy Prices and Productivity Growth,” Scandinavian Journal of Economics, Vol. 83, No. 2, 1981, pp. 165-179. http://dx.doi.org/10.2307/3439894
- D. W. Jorgenson, “The Role of Energy in Productivity Growth,” The Energy Journal, 1984, Vol. 5, No. 3, pp. 11-26. http://dx.doi.org/10.5547/ISSN0195-6574-EJ-Vol5-No3-2
- J. Luppens, D. Scott, J. Haacke, L. Osmonson, T. Rohrbacher and M. Ellis, “Assessment of Coal Geology, Resources, and Reserves in the Gillette Coalfield Powder River Basin Wyoming,”2012 http://pubs.usgs.gov/of/2008/1202/
- J. Boyd and Company, “Powder River Basin Coal Resource and Cost Study,” 2011. http://www.xcelenergy.com/staticfiles/xe/Regulatory/Regulatory%20PDFs/PSCo-ERP-2011/8-Roberts-Exhibit-No-MWR-1.pdf
- S. Limerick, “Coalbed Methane in the United States: A GIS Study,” 2013. http://www.searchanddiscovery.com/documents/2004/limerick/images/06b.jpg
- U.S. Energy Information Administration, “Coal Production by State, County, and Mine Type,” 2013. http://www.eia.gov/coal/data.cfm#production
- C. Carlson, D. Burtraw, M. Cropper and K. Palmer, “Sulfur Dioxide Control by Electric Utilities: What are the Gains from Trade?” Journal of Political Economy, Vol. 108, No. 3, 2000, pp. 1292-1326. http://dx.doi.org/10.1086/317681
- T. Considine and D. Larson, “The Environment as a Factor of Production,” Journal of Environmental Economics and Management, Vol. 52, No. 3, 2006, pp. 645-662. http://dx.doi.org/10.1016/j.jeem.2006.07.001
- U.S. Energy Information Administration, “Coal Mining Productivity & Employees by State and Mine Type,” 2013. http://www.eia.gov/coal/data.cfm#production
- U.S. Energy Information Administration, “Rail Coal Transportation Rates to the Electric Power Sector,” 2013. http://www.eia.gov/coal/transportationrates/
- U.S. Energy Information Administration, “Table 7.9 Coal Prices, Selected Years, 1949-2011,” Annual Energy Review, 2013. http://www.eia.gov/totalenergy/data/annual/pdf/sec7_21.pdf
- U.S. Energy Information Administration, “Table 7.2 Coal Production, 1949-2011,” Annual Energy Review, 2013. http://www.eia.gov/totalenergy/data/annual/showtext.cfm?t=ptb0702
- U.S. Energy Information Administration, “Table 9.1 Emissions from Energy Consumption at Conventional Power Plants and Combined Heat-and-Power Plants, 2011 through 2011.” http://www.eia.gov/electricity/annual/html/epa_09_01.html
- U.S. Energy Information Administration, “Table 26. U.S. Coal Consumption by End Use Sector, by Census Division and State,” 2013. http://www.eia.gov/coal/annual/pdf/table26.pdf
- U.S. Energy Information Administration, “Form EIA-923 Detailed Data,” 2013. http://www.eia.gov/electricity/data/eia923/index.html
- U.S. Energy Information Administration, “Table 5.6.B. Average Retail Price of Electricity to Ultimate Customers by End-Use Sector by State, http://www.eia.gov/electricity/monthly/epm_table_grapher.cfm?t=epmt_5_6_a
- U.S. Energy Information Administration, “Table 2.8 Retail Sales of Electricity to Ultimate Customers by EndUse Sector, by State, 2011 and 2010,” Electric Power Annual, 2013. http://www.eia.gov/electricity/annual/html/epa_02_08.html.
- U.S. Energy Information Administration, “Table 2.10 Average Retail Price for Electricity to Ultimate Customers by End-Use Sector, by State, 2011 and 2010,” Electric Power Annual, 2013, http://www.eia.gov/electricity/annual/html/epa_02_10.html.
- U.S. Energy Information Administration, “Natural gas Prices,” 2013, http://www.eia.gov/dnav/ng/ng_pri_sum_dcu_nus_m.htm
- U.S. Energy Information Administration, “Table 2.10 Average Retail Price for Electricity to Ultimate Customers by End-Use Sector, by State, 2011 and 2010,” Electric Power Annual, 2013. http://www.eia.gov/electricity/annual/html/epa_02_10.html.
- U.S. Energy Information Administration, “Table 9.10. Cost of Fossil-Fuel Receipts at Electric Generating Plants,” Monthly Energy Review, 2013. http://www.eia.gov/totalenergy/data/monthly/pdf/sec9_13.pdf
- U.S. Bureau of Labor Statistics, “Producer Prices Less Food and Energy,” 2013. http://www.bls.gov/ppi/
- Energy Information Administration, Annual Energy Outlook 2013, Reference Case.
- N. Muller, R. Mendelsohn and W. Nordhaus, “Environmental Accounting for Pollution in the United States Economy,” American Economic Review, Vol. 101, No. 3, 2011, pp. 1649-1675. http://dx.doi.org/10.1257/aer.101.5.1649
- U.S. Energy Information Administration, “Annual Energy Outlook,” 2012. http://www.eia.gov/oiaf/aeo/tablebrowser/##release=AEO2012&subject=6-AEO2012&table=62-AEO2012®ion=3-0&cases=heur12-d022212a,leur12-d022212a,lm2012-d022412a,hm2012-d022412a,ref2012-d020112c
- N. Pham and D. Ikenson, “A Critical Review of the Benefits and Costs of EPA Regulations on the U.S. Economy,” National Economic Research Associates, 2012, 38 p.
- P. Glaser, “Four More Years: What to Expect from EPA on Coal Issues in the Second Term,” Troutman and Sanders, School of Energy Resources, Coal Industry Round Table, Gillette, 2012. http://wyocast.uwyo.edu/WyoCast/Play/1eaf7bca0f4742529ad3db3dda6fd2c11d
- L. Pratson, D. Haerer and D. Patino-Escheverri, “Fuel Prices, Emission Standards, and Generation Costs for Coal vs Natural Gas Power Plants,” Environmental Science and Technology, Vol. 47, No. 9, 2013, pp. 4926- 4933. http://dx.doi.org/10.1021/es4001642
- G. Schaefer, “U.S. Coal Export Potential,” Arch Coal, School of Energy Resources University of Wyoming, Coal Industry Round Table, Gillette, 2012. http://wyocast.uwyo.edu/WyoCast/Play/b60f299031bb44eab49ce22778a229b61d