Natural Resources
Vol.3 No.3(2012), Article ID:23249,11 pages DOI:10.4236/nr.2012.33017
The Fate of Aflatoxin in Corn Fermentation
![]()
1Department of Biochemistry, Molecular Biology, Entomology and Plant Pathology, Mississippi State University, Oktibbeha County, USA; 2Department of Plant and Soil Sciences, Mississippi State University, Oktibbeha County, USA; 3Department of Animal and Dairy Science, Mississippi State University, Oktibbeha County, USA; 4Corn Host Plant Resistance Research Unit, United States Department of Agriculture, Agricultural Research Service, Washington DC, USA.
Email: abrown@bch.msstate.edu
Received July 12th, 2012; revised August 14th, 2012; accepted August 23rd, 2012
Keywords: LC-MS/MS; Ethanol; Immunoassay; Distillers Grains; Binders
ABSTRACT
A lab-scale ethanol fermentation was investigated to determine where aflatoxin concentrated during each phase of production. Four corn samples with high levels of aflatoxin (ranging from 7750 - 17,208 parts per billion) and their replicates were compared with a replicated negative control. Fractions were taken from the fermented mash, distilled ethanol, stillage, and dried corn solids (DCS). These fractions were analyzed using two different immunoassay methods and liquid chromatography tandem mass spectrometry (LC-MS/MS). Results indicated no aflatoxin was found in the distilled ethanol. Some aflatoxin (13%) was detected in the stillage, but most of the toxin was recovered in the DCSs ranging from 31% to 58%. A second series of experiments were conducted to investigate the effect of binders on dried distillers grains (DDGs). A brewers dried yeast anti-caking binder that contains glucomannon (MTB-100®), was mixed with contaminated DDGs. Addition of the binder showed a significant reduction in aflatoxin levels in comparison to a positive control. Aflatoxin binding at 2% binder w/w reached 72.5% and showed a minimal binding percentage increase of 80% at 6% binder w/w. Testing was also conducted to determine if environmental variables such as pH and temperature had any effect on the binding capabilities. Temperature near 0˚C resulted in binding at 19.7% at a pH range of 6 to 8. Additionally, at a temperature of 40˚C resulted in binding of 36%, 47%, and 45% at pHs 6, 7, and 8, respectively. These findings suggest that the addition of sorbents may be an effective way of salvaging contaminated DDGs.
1. Introduction
Aflatoxin is a potent mycotoxin naturally produced as a secondary metabolite by several fungal Aspergilli species, primarily A. flavus and A. parasiticus [1]. Aflatoxin contaminates a variety of food and crop commodities such as corn, peanuts, spices, tree nuts, figs, honey, fruit juices, wine, and cotton [2-9]. It is estimated that 25% of the world’s crops are affected by mycotoxins, according to the evaluation of the Food and Agriculture Organization [10]. Aflatoxin B1 is labeled as the most potent naturally produced carcinogen with its primary mammalian target being the liver [11,12]. The four main aflatoxins frequently encountered are B1, B2, G1 and G2. They are designated by the corresponding color they fluoresce (blue or green) under UV light, and the numbers assigned to them are given based on the relative distance traveled on a thin layer chromatography (TLC) plate [1,13]. A. parasiticus produces aflatoxin B1, B2, G1 and G2 while A. flavus produces aflatoxins B1 and B2 [14,15]. Aflatoxin B1 is the most toxic of the four toxins [16,17]. Upon ingestion, aflatoxin B1 may also be metabolized into aflatoxin M1, which is expressed in milk of lactating animals, and thereby contaminating dairy products [18,19]. A. flavus and A. parasiticus are saprobic fungi ubiquitous in nature, commonly found living off of decaying debris in the soil and on crops [20,21]. Because of aflatoxin’s carcinogenic nature, it is regulated in feed and food in more than 100 countries [22]. The US Food and Drug Administration has set action levels for aflatoxin at 20 parts per billion (ppb) for all foods intended for human consumption, except for milk which is set at 0.5 ppb [23]. The feed limit for finishing beef cattle is 300 ppb and for dairy cattle the feed limit is 20 ppb.
The United States is the world’s largest grower of corn (Zea mays), which is impacted by aflatoxin contamination annually. In addition to its usage in food and feed products, corn is the main substrate used in ethanol production [24]. The composition of dent corn is 72% starch and 9.5% protein [25]. The high starch composition in corn can easily be broken down into the simple sugars necessary to make ethanol. When corn is fermented, two key co-products are formed: coarse unfermented distillers grains or dried corn solids (DCS), and the liquid or stillage which is composed of yeast, fine grain particles, and soluble nutrients. When these products are combined and dried they are referred to as dried distillers grains and solubles (DDGS) [26]. These co-products are sold to livestock producer for animal feed [27,28].
A simplistic outline of ethanol production [29-31] using corn starts by grinding entire corn kernels into coarse flour, known as meal, which is then mixed with water to form “slurry”. Alpha-amylase is added to break down the starch from corn into short chain dextrin sugars, and the slurry is heated for liquefaction. After liquefaction, the slurry is referred to as “corn mash”. A second enzyme, glucoamylase, is then added to break down the dextrins to form glucose in a process known as saccharification. Finally, yeast is added to the mash and is transferred to fermenters where the yeast converts the simple sugars into ethanol and carbon dioxide. In commercial application, carbon dioxide is usually captured and sold for use in carbonating soft drinks and for use in manufacturing dry ice. After fermentation, ethanol is distilled from the fermented mash with the remaining “stillage” containing solids from the grain, yeast and water. The distilled ethanol can then be prepared and sold as fuel. The stillage can be centrifuged, separating the water from the solubles, which can be sent back to the slurry tanks to help recycle water input. Schingoethe [28] reports that 100 kg of corn produces approximately 40.2 L of ethanol, 32.3 kg of DDGS, and 32.3 kg of carbon dioxide.
The economic success of ethanol plants relies in part by the marketability of its DDGS [26]. It is therefore crucial to know how aflatoxin is affected by the fermentation process for the sustainability of ethanol plants, the health of animals fed DDGS and for the health and safety of humans who may consume food processed from these animals. Several studies have already investigated mycotoxin contaminated meal through ethanol fermentation processes [32-35]. All previous studies agreed that no mycotoxins were detected in the distilled alcohol. However, it is of interest to note that several studies were at variance with one another terms of the fate of aflatoxin during fermentation. Two studies reported that aflatoxin is degraded during fermentation [33,36]; one [36] was based on traditional brewing and the other [33] simulated industrial fermentation procedures. Two additional studies based on industrial fermentation procedures reported that aflatoxin did not degrade during the fermentation [34,35].
Many studies have investigated into the detoxification of aflatoxin using heat, gamma radiation, nixtamalization, and ammoniation [35,37-41] and have shown varying amounts of success in reducing aflatoxin in feeds and foods. Another alternative that is gaining attention is the option of incorporating binders/sorbents (sequestering agents) in the contaminated feed meal that would bind aflatoxin, thereby making the meal non-toxic and safe for animal consumption [21]. Combining binders with the DDGS could be an easy and cost effective strategy, requiring minimal modifications to the ethanol plant facilities. Currently, the US Food and Drug Administration (FDA) allows the use of binders as anticaking agents in animal feed not exceeding 2 percent, but does not approve the use of binders for removing aflatoxin as it is concerned with the uniformity and degree of mycotoxin binding [42-45]. Some recent studies have assessed a variety of binders for detoxification of aflatoxin and how they affect the physiology of animals that consume them [44-49]. These studies have shown a variety of sorbents and binders can lower aflatoxin in a diverse collection of animals when fed aflatoxin contaminated feed that contained these adsorbents. These studies primarily focused on the aflatoxin binding properties of hydrated sodium calcium aluminosilicates (HSCAS), activated carbons, and esterified glucomannans with many showing promising binding of aflatoxin exceeding 95% bound at low concentration of adsorbent. This study was undertaken to determine the fate of aflatoxin during ethanol fermentation of corn and to explore a strategy using binders to help salvage contaminated DDGs for market.
2. Materials and Methods
2.1. Corn Sample Information
Store bought corn meal (yellow 100% whole grain) was used as a negative control (no aflatoxin was detected using the Veratox® method described below). To ensure that aflatoxin levels could be detected among the aliquots taken during ethanol fermentation of corn, four samples of highly aflatoxin-contaminated ground corn were obtained from the United States Department of Agriculture, Agricultural Research Service (USDA ARS), Corn Host Resistance Unit, Mississippi State, MS. The corn was planted in a randomized complete block design with four reps with approximately 20 plants per row. The corn was infected by side needle injections with A. flavus (NRRL 3357) inoculum 14 days after mid-silk (mid-silk is when 50% of the plants on a row have visible silks). Inoculum injected was a 3.4 mL suspension containing 3 × 10⁸ A. flavus conidia. The ears were harvested by hand approximately 60 days after inoculation and dried at 38˚C for 5 to 7 days and then machine shelled. Samples were ground using a Romer mill (Romer Laboratories Inc., Union, MO, USA). The mean aflatoxin level across all reps was 10,800 ppb.
2.2. Preparation and Fermentation of Corn
Four corn samples and their replicates were subjected to a lab-scale ethanol fermentation process. All samples were treated the same. Both subsamples of corn underwent the fermentation process concurrently. One hundred grams of ground corn sample were combined in a 2 L flask with water until a final volume of 1 L was reached. The pH was then measured using litmus paper. All samples were within the pH range of 5.5 - 6.0. The corn meal slurry was brought to a rapid boil on a hot plate while mixing with a stir bar and then allowed to cool to between 45˚C - 74˚C. Next, 0.1 g of α-amylase (Mile Hi Distilling; Lakewood, CO) was added. This converts starch to maltose and oligosaccharides by randomly hydrolyzing α-1,4-glycosidic bonds. Ten mL of 4000 mg/L Ca2+ solution (1 M CaNO3 and distilled water) was added to the slurry, stabilizing and activating the enzyme. The mixture was allowed to incubate for 45 minutes to allow the enzymes to liquefy the mash. Afterwards, the pH was adjusted to 4.0 before adding 0.1 g of glucoamylase (Mile Hi Distilling; Lakewood, CO). This converts the long chain sugars produced by α-amylase into glucose monomers by cleaving α-1,4-glycosidic and α-1,6-glycosidic bonds from the non-reducing ends. The efficiency of the enzymatic conversion of starch to sugar was measured in the mash using a Brix refractometer.
The digested mash was then allowed to cool and settle for 30 minutes. The supernatant from the mash was then removed from the solids (coarse grains). Supernatant was used to wash the solids to retrieve any bound sugars from the supernatant. The coarse grain portion was then set aside and allowed to completely dry forming dried corn solids (DCS). The supernatant was cooled to 37˚C using an ice bath before stirring in approximately 0.3 g of yeast, Saccharomyces cerevisiae (ATTC, Manassas, VA). The mash was incubated at 29˚C for four days in a loosely sealed container.
2.3. Distillation of Ethanol
The fermented mash was distilled for ethanol on a microscale still consisting of a Bunsen burner, fractionating column, thermometer, Graham condenser and graduated cylinder for collection of ethanol. Distilled ethanol fractions were collected between 78˚C - 85˚C. To ensure that no contamination of aflatoxin occurred between samples, a rinse solution of 50:50 ethanol: water was distilled through the fractionating column and Graham condenser three times, collected and analyzed via LC-MS/MS.
2.4. Preparation, Extraction and Analysis of Samples
2.4.1. Corn
The total aflatoxin in the four corn samples obtained for this experiment was determined by two immunoassays: AflaTest® and Veratox®, as well as by LC-MS/MS. The samples were extracted and analyzed as indicated and outlined below.
2.4.2. DCSs
The total aflatoxin in the DCSs fractions collected from the experiment were analyzed by AflaTest®, Veratox®, and LC-MS/MS. For the two immunoassays, the samples were extracted and analyzed as indicated by the test kit instructions. For LC-MS/MS analysis, the extraction of aflatoxin from DCSs followed the Veratox® extraction procedure using 5 g of grounded sample in 25 mL of 70:30 methanol: water. The filtrate was then diluted to fall within the standard curve. An additional clean-up step was needed before LC-MS/MS analysis (outlined below).
2.4.3. Fermented Mash
The total aflatoxin in the fermented fractions collected from the experiment were analyzed by LC-MS/MS. Aliquots taken from the fractions collected were cleaned-up using a 0.45 µm nylon filter before injection with no dilution step necessary. Fermented mash fractions were not a suitable matrix for the two-immunoassay analysis as indicated by the test kit instructions.
2.4.4. Distilled Ethanol
The total aflatoxin in the distilled ethanol fractions collected from the experiment were analyzed by LCMS/MS. Aliquots taken from the fractions collected were cleaned-up using a 0.45 µm nylon filter before injection with no dilution step necessary. Distilled ethanol fractions were not a suitable matrix for the two-immunoassay analysis as indicated by the test kit instructions.
2.4.5. Stillage
The total aflatoxin in the distilled ethanol fractions collected from the experiment were analyzed by LCMS/MS. Aliquots taken from the fractions collected were cleaned-up using a 0.45 µm nylon filter before injection with no dilution step necessary. As per the instructions, stillage fractions were not a suitable matrix for the immunoassays.
2.5. Immunoassays Methods
2.5.1. AflaTest® Assay
AflaTest®, manufactured by VICAM, is an immunoaffinity column (IAC) method using monoclonal antibodybased affinity chromatography and is approved by AOAC International and the Federal Grain Inspection Service (FGIS). This method was followed as directed by the instruction manual. Aflatoxin is extracted by mixing 50 grams of ground sample with 100 mL of a 70:30 methanol/water mixture and then filtered. The filtered extract is then diluted and filtered again before passing the filtrate over AflaTest® affinity column. The column is then washed with water and the aflatoxins are eluted with methanol into a cuvette. Developer is then added to the eluate before reading the sample with a calibrated Series-4EX Fluorometer (VICAM, Watertown, MA) to determine aflatoxin concentration. AflaTest® detection limits range from 1 - 300 ppb for grains.
2.5.2. Veratox® Assay
Veratox®, manufactured by Neogen, is a direct competetive ELISA using polyclonal antibodies and is approved by Grain Inspection, Packers and Stockyards Administration (GIPSA) and FGIS. Aflatoxin is extracted by vortexing 5 g of sample that has been ground to a fine particle size with 50 mL of a 70:30 methanol/water solution before filtering through a Whatman Filter #1. The filtrate is then diluted if necessary before being sampled and mixed with enzyme-labeled toxin (conjugate). The mixed solution is transferred to antibody-coated wells, where free toxin and conjugate compete for antibody binding sites. The unbound conjugate and other soluble phase substances are then rinsed away and a substrate is added. Color develops as a result of the presence of bound conjugate. Red stopping reagent is added and the color of the resulting solution is observed. Samples were analyzed on Neogen Stat Fax Microwell Strip Reader (Neogen, Lansing, MI). Absorbance (OD650) readings of the samples are compared with OD650 readings of the controls, and the concentration of total aflatoxin in the samples are calculated in ppb. Veratox® has a lower detection limit of 2 ppb with a range of quantitation from 5 - 50 ppb.
2.6. LC-MS/MS Conditions
For sample separation, a Varian ProStar dual solvent delivery module (Palo Alto, CA) coupled to with a Bruker Esquire Mass Spectrometer (Billerica, MA) capable of tandem MS was used for positive identification. Sample volumes of 50 µL were injected at 25˚C with a Varian ProStar autosampler onto a 100 × 2.1 mm i.e. 3 μm Ultra Aqueous C18 (Restek, Bellefonte, PA, USA) column. A gradient elution method (Table 1) was used for the mobile phase consisting of water with 0.1% formic acid plus 1.25 mM of ammonium acetate and methanol. The retention times of aflatoxins B1, B2, G1, and G2 are as follows based on elution: 16 min for G2, 16.6 min. for G1, 17.1 min. for B2, and 17.6 min for B2. A secondary UV scan at a wavelength of 356nm was conducted using a Waters 2587 module (Waters Corporation, Milford, MA). For the MS method, electrospray ionization was used in the positive mode yielding [M+H]+ parent ions 313, 315, 329, 331 m/z of the aflatoxins B1, B2, G1, and G2, respectively. The most intense daughter ions, resulting from collision-induced dissociation were used for identification for B1 (285.1 + 298.1), B2 (297.1 + 287.1 + 259.1), G1 (311.1 + 301.1 + 283.1 + 243.1), and G2 (313.0 + 285.1 + 303.1).
2.7. Standards Used for LC-MS/MS Analysis
The standard curve for LC-MS/MS analysis was made by combining separate stock solutions of aflatoxins: 2.0 µg/mL B1, 0.5 µg/mL B2, 2.0 µg/mL G1, 0.5 µg/mL G2 (SUPELCO; Bellefonte, PA) into a working solution of 800 ng/mL total aflatoxin, each aflatoxin equaling 200 ng/mL. A seven point standard curve plotting 8, 40, 80, 200, 400, 600, 800 ng/mL total aflatoxin (2, 10, 20, 50, 100, 150, 200 ng/mL for each of the four individual aflatoxins) was injected on the LC-MS/MS using the same method as described above with an overall correlation coefficient, R2, ranging from 0.9979 to 0.9990 of all four aflatoxins.
2.8. Preparation and Analysis of DCSs Mixed with Binders
Evaluation for decontamination of aflatoxin in DCSs using binder, MTB-100®, was carried out on DCSs made from contaminated corn sample 3. Triplet positive control samples were analyzed, each sample containing 5g of contaminated DCSs (approximately 14,000 ppb). Duplicate samples containing binder and DCSs made from contaminated corn sample 3 were analyzed, each sample prepared by mixing 1 g of MTB-100® (Alltech; Lexington, KY) with 5 g of contaminated DCSs. All five samples were stored at 4˚C for seven days to ensure binding before having the aflatoxin extracted as outlined in the Veratox® extraction procedure described above. The filtrate of all the samples were then passed through a 0.45 µm nylon filter as a clean-up step before analysis by the LC-MS/MS method described previously. Quantification was accomplished using peak areas. All solvents were HPLC grade (purchased from Sigma Aldrich, St. Louis, MO).
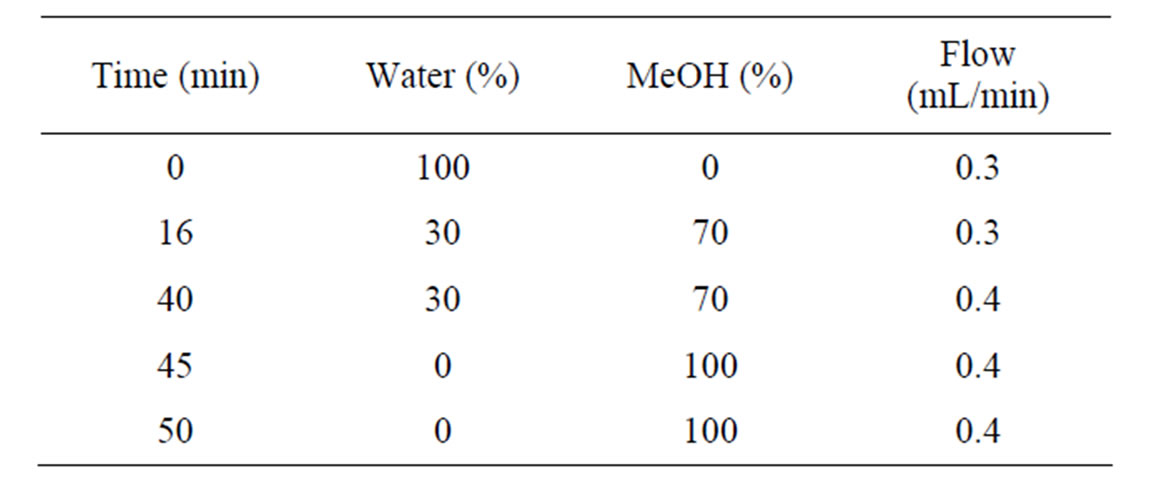
Table 1. Gradient method used for the mobile phase in separation of samples for the LC-MS/MS method.
2.9. Analysis of Dried Distillers Grains with Solubles
Dried Distillers Grains with Solubles (DDGs) were provided by Bunge-Ergon Vicksburg, LLC ethanol facility. Aflatoxin B1 standard was purchased from Sigma Aldrich and used to create a 3.00 μg/mL spiking solution in methanol. DDG samples were spiked with this aflatoxin solution to reach a concentration of 300 ppb. Each sample was then manually mixed for 6 min. Aflatoxin was then extracted using the procedure outlined previously. The pH portion of the study used a similar methodology, with all testing samples consisting of 9.8 g of DDG, 0.2 g of binder. Following the addition of 50mL of MeOH and vortexing, the pH was modified using dilute HCl and/or NaOH. The pH was then adjusted to the range of 10, 9, 8, 7, 6, 5, and 4. The solutions were then left at this pH for an hour, then readjusted to the pH of 7 for analysis. After settling occurred (one hour), the extraction solvent was carefully decanted and tested using the Veratox® kit. Finally, the temperature range portion of the experiment was conducted in a similar manner to the pH experiment. Samples consisted of 9.8 g of DDG and 0.2 g of binder. 50 mL of MeOH was added and promptly vortexed, again the pH was adjusted to 8, 7, or 6 depending on the experiment. The solutions were then placed in an ice water bath (0˚C) or a hot water bath (40˚C).
3. Results
The total aflatoxin in the four aflatoxin-contaminated corn samples obtained for this experiment were measured by the AflaTest® method and are as follows: Sample 1: 7600 ppb, Sample 2: 10,800 ppb, Sample 3: 14,800 ppb, and Sample 4: 11200 ppb. Veratox® gave comparable values of the contaminated corn samples (shown in Table 2). Compilation of the results for the total aflatoxin of four duplicate samples of aflatoxin-contaminated corn plus a duplicate negative control (no aflatoxin detected) is found in Table 2. The corn and DCS samples were analyzed for total aflatoxin by LC-MS/MS, Veratox®, and AflaTest®. The fermented mash, distilled ethanol, and stillage fractions were analyzed for total aflatoxin only via LC-MS/MS because the matrices were unsuitable for the two-immunoassay methods. No aflatoxin was detected in any of the fractions collected from the negative control corn sample. For the aflatoxin-contaminated corn samples, no aflatoxin was detected in the distilled ethanol fractions. Also, no aflatoxin was detected in the rinse fractions, which were distilled through the fractionating column and Graham condenser after each contaminated sample was distilled for ethanol. Ethanol yields averaged 2.1% (v/v). Aflatoxin was detected in all fractions collected from the fermented mash with total aflatoxin levels ranging from approximately 127 - 196 ppb. Also, aflatoxin was detected in all stillage fractions collected with total aflatoxin levels ranging from approximately 133 - 195 ppb. The highest aflatoxin levels were measured in the DCS fractions. The means with standard deviation total aflatoxin levels for the four DCS samples and their replicates are as follows: 9867 ± 3000 ppb, 9756 ± 3000 ppb, 14,208 ± 4000 ppb, 14,149 ± 3000 ppb. The percentage of aflatoxin recovered was 31% - 58% in the DCSs, 13% in the fermented mash and 13% in the stillage.
Testing the effect temperature and pH have on the binding of aflatoxin in DDGs with MTB-100 indicates a dependence upon the two variables. DDGs were analyzed using the Veratox® method with the initial control concentration of aflatoxin being 300 ppb. Binding efficiency as a function of binder concentration plateaued to 80% with the addition of 6% (w/w) binder, at 10% concentration binder resulted in a binding efficiency of 88%. At a 2% (w/w) binder exhibited 72.5% in aflatoxin binding (Figure 1). Binding efficiency as a function of pH found that at 2% w/w binder in room temperature conditions (25˚C) the optimum binding occurs at pH 6 amongst the pH range of 4 - 10 resulting in 81.3% binding reducing the aflatoxin concentration to 56.0 ppb. Aflatoxin binding decreased at the pH range of 7 and 8, 42.2% and 52.9% respectively, compared to the pH of 6 resulting in an aflatoxin concentration of 173.4 ppb and 141.2 ppb (Figure 2). A separate experiment was conducted to determine what effect pH had on the amount of recovered aflatoxin in the absence of binder (results not shown). The results indicate that there is no variation in the amount of aflatoxin recovered as a function of pH from pH range 4 - 8 with a dramatic reduction of aflatoxin recovery at pH 9 and 10. Binding efficiency as a function of temperature showed reduction in aflatoxin binding capability at both hot and cold temperatures.
Cold temperature had a dramatic effect upon the binding efficiency with temperatures near 0˚C resulting in near negligible binding at pH of 6 and a maximum binding percentage of 19.7% at a pH of 8 resulting in a final aflatoxin concentration of 240.9 ppb (Figure 3). Hot temperature had a somewhat muted effect on the binding efficiency of MTB-100® with the pH of 6 having 36% binding resulting in a final concentration of 192 ppb and the pH of 7 and 8 having a percent binding of 47 and 45% binding resulting in a final aflatoxin concentration of 159 ppb and 165 ppb respectively (Figure 4).
Figure 5 shows the chromatogram obtained from LC-MS/MS analysis of aflatoxin-contaminated DCSs (14,000 ppb) collected from DCSs fractions from corn sample 3 in the ethanol fermentation experiment previously described. The chromatogram shows decrease levels of detected aflatoxin in DCSs mixed with binders (2 replicates) when compared to the positive controls (3 replicates) containing only DCSs. The binders reduced aflatoxin levels by 80%.
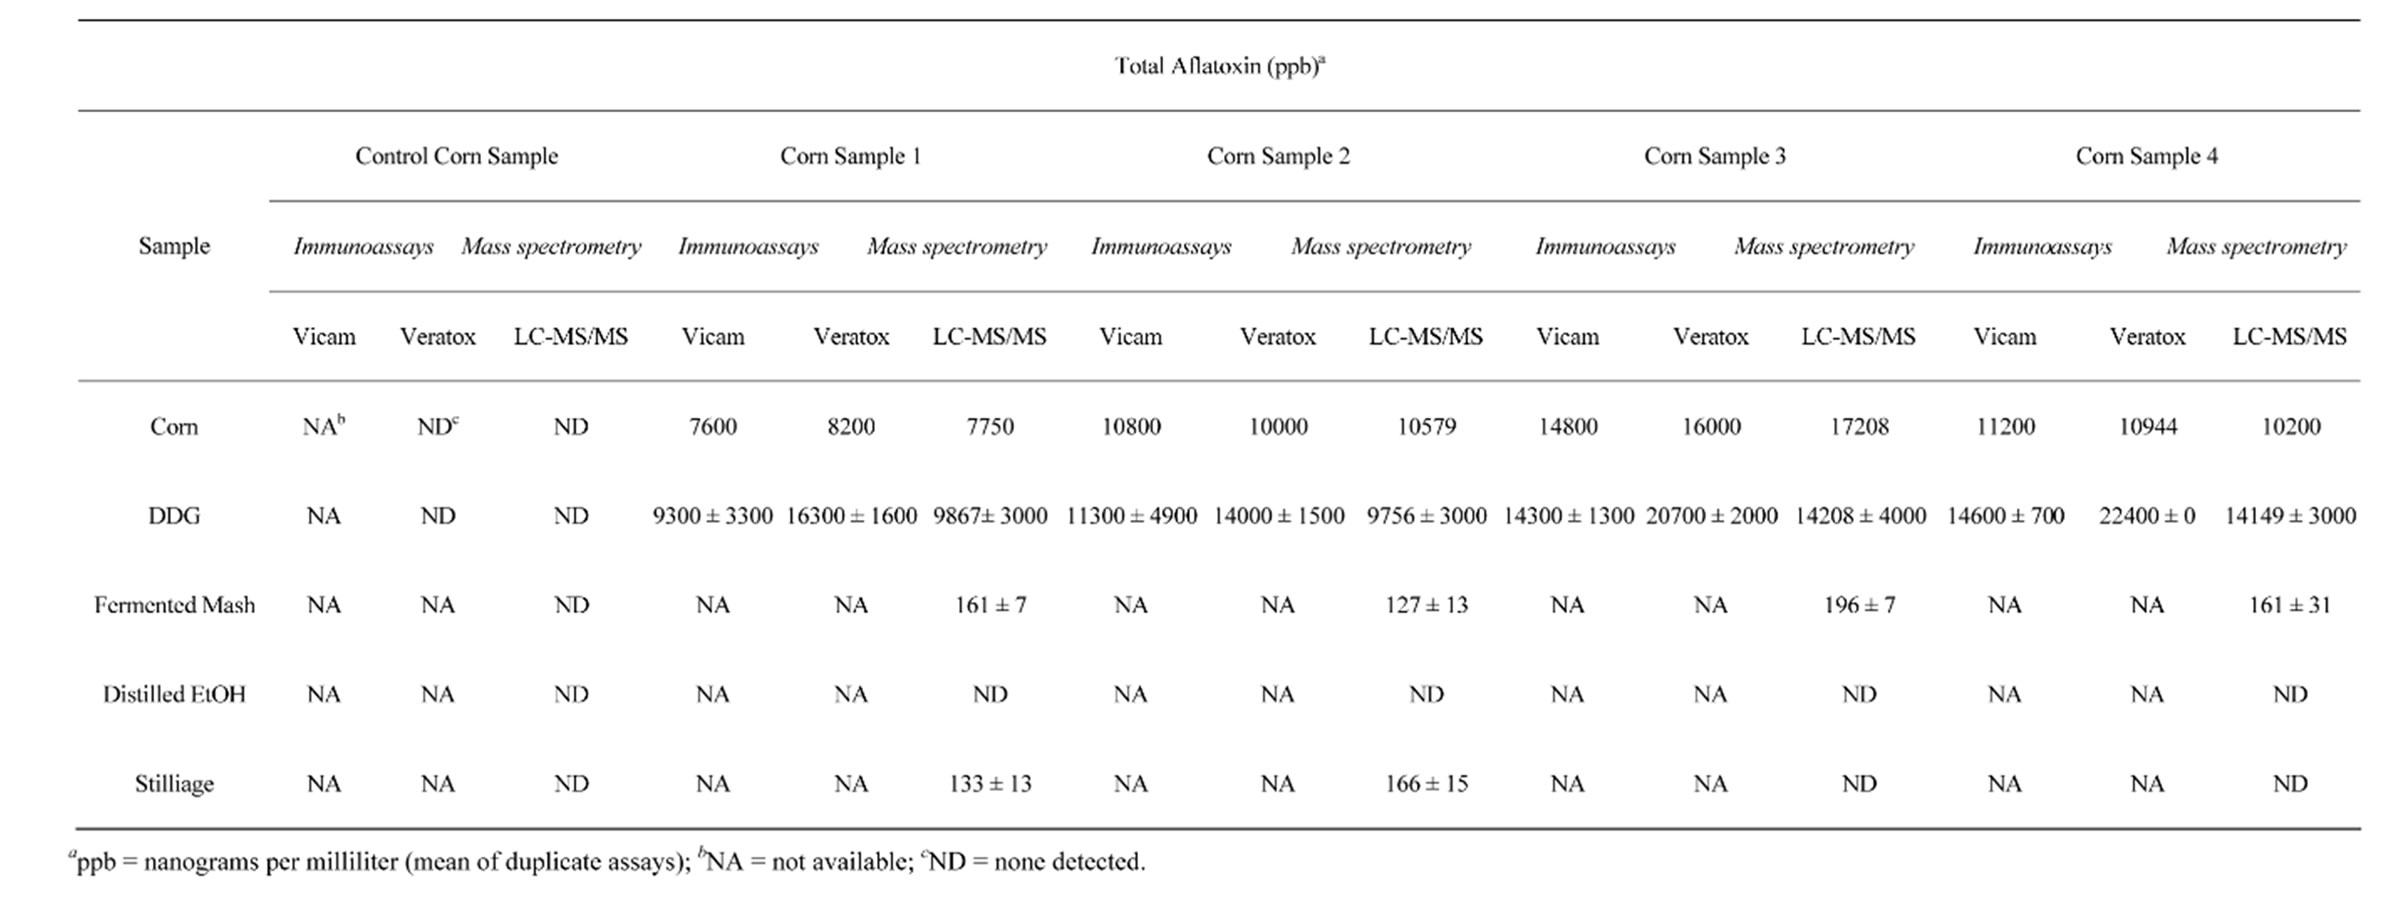
Table 2. Distribution of aflatoxin B1 in products from ethanol fermentations.
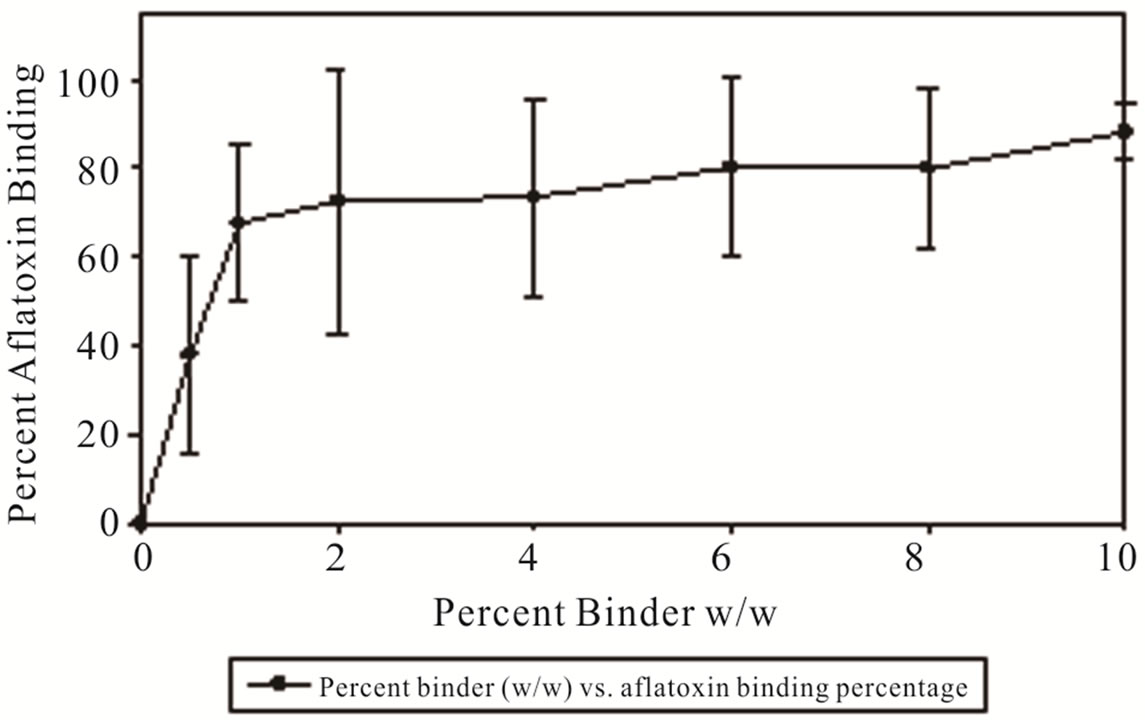
Figure 1. Percentage of aflatoxin bound by MTB-100 in DDGs as a function of pH at 40˚C.
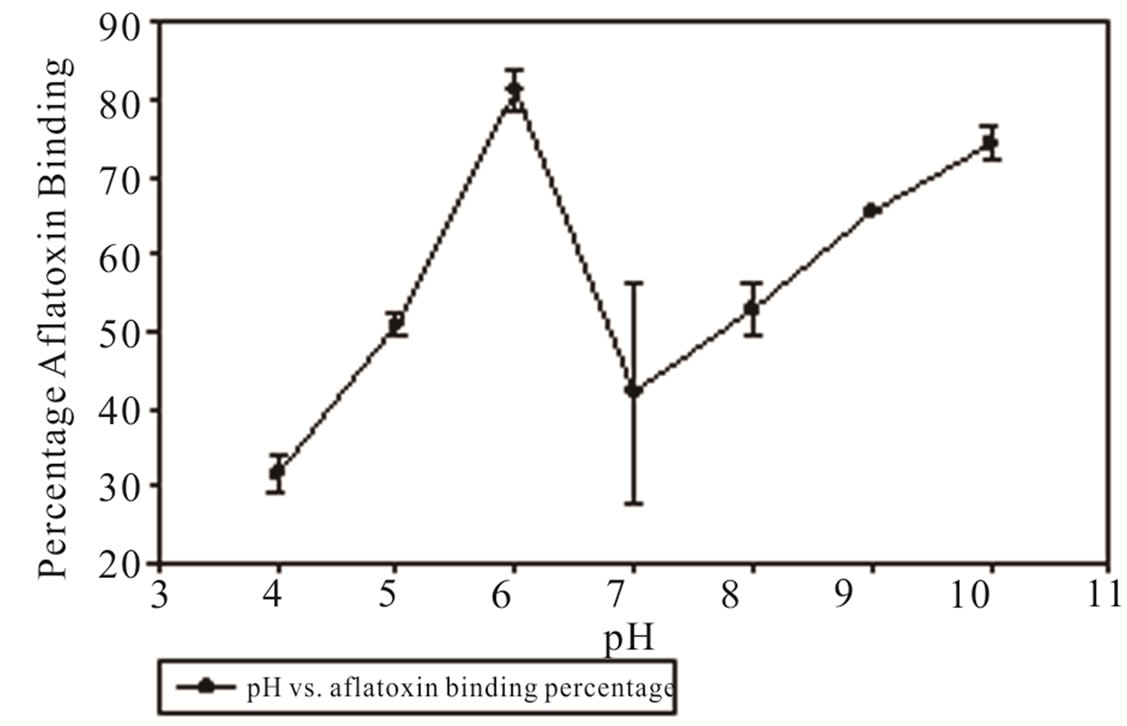
Figure 2. Percentage of aflatoxin bound by MTB-100 in DDGs as a function of pH at room temperature.
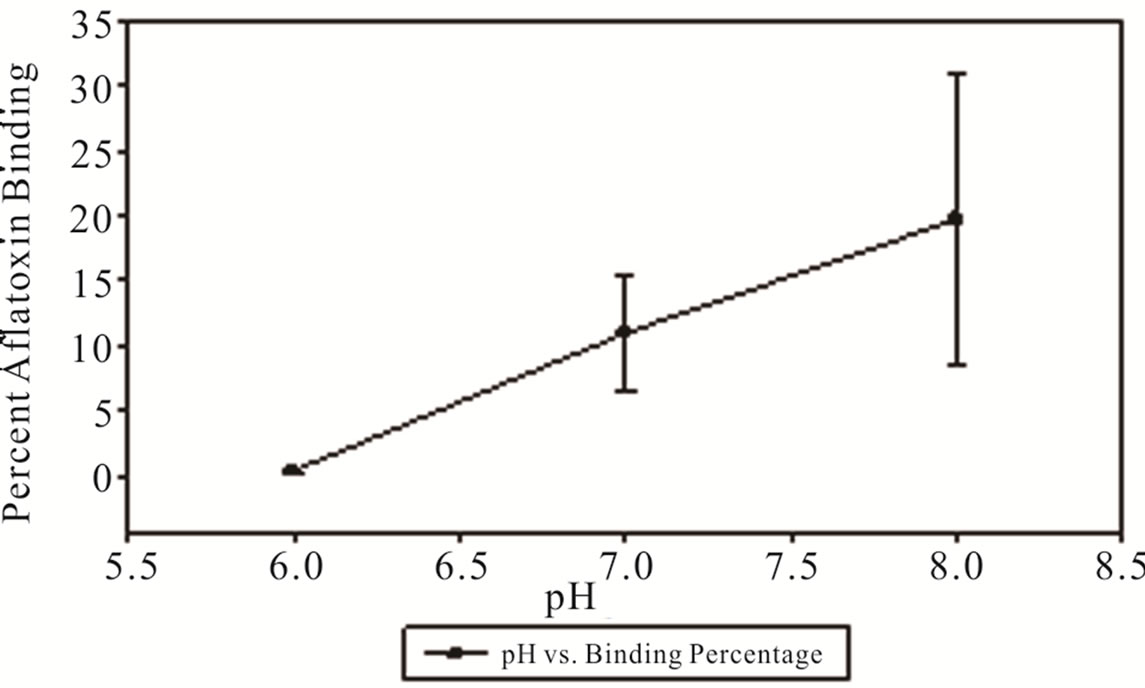
Figure 3. Percentage of aflatoxin bound by MTB-100 in DDGs as a function of pH at 0˚C.
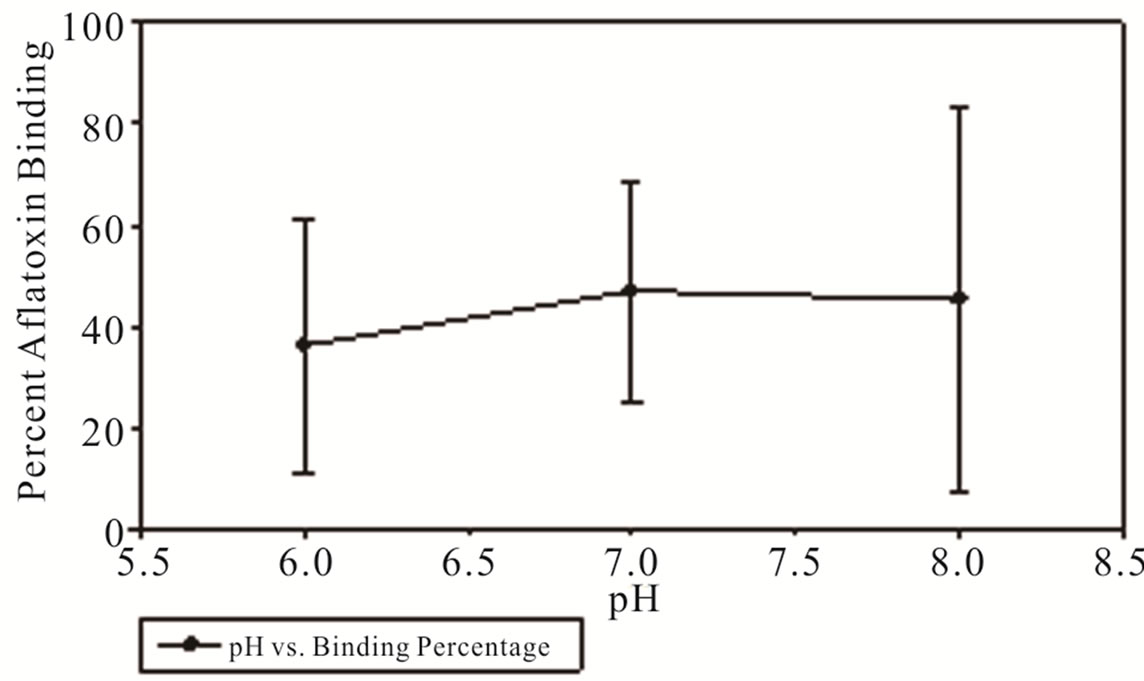
Figure 4. Percentage of aflatoxin bound by MTB-100 in DDGs as a function of pH at 40˚C.
4. Discussion
For analysis of samples results based on the ELISA method were 1.4 to 1.6 times higher than the LC-MS/MS method. The results from the IAC method gave comparable results to LC-MS/MS. Likely cross reactivity with other metabolites is the cause, as ELISA measures the response from each cross-reacting analogue into a single response, therefore increasing the sensitivity of the ELISA when other analogues are present. In comparison, LC-MS/MS only quantitates specific analyte ions of interest. These findings are in agreement with multiple other studies giving reports that higher recovery values were observed in ELISA assays when comparing them with HPLC and LC/MS methods [50-53] but in all cases it was stated that the correlation between the compared methods were good. In one particular study [53] when LC-MS/MS, Radio Immuno Assay (RIA), and ELISA methods were compared for the measurement of urinary estrogens, it was reported that absolute concentrations of estrogen metabolites for RIA and ELISA methods were 1.6 to 2.9 and 1.4 to 11.8 times higher in premenopausal and postmenopausal women, respectively. Their results suggest that LC-MS/MS is a preferable method for comparing absolute or relative amounts of metabolites of interest. In another study [51] when an ELISA test kit was compared to HPLC for detecting ochratoxin A in food commodities, it was observed that the results from the ELISA test kit were 1.7 to 1.8 higher than HPLC. Also, in a study conducted by Samdal et al. [50], blue mussels were analyzed for yessotoxins by ELISA and LC-MS. They observed ELISA responses were 3 - 13 times higher than LC-MS, probably due to antibodies binding to other yessotoxins analogues not included in the LC-MS analysis. However, the correlation between ELISA and LC-MS was good, with R2 values ≥ 0.8, indicating that that the ELISA is a reliable method for estimating the total level of yessotoxins in mussels. The variation between methods makes it difficult to compare results across studies that use different detection methods and emphasizes the need for standardization across assays to ensure maximal quality control.
The negative control corn sample showed no aflatoxin in the ground corn sample, DCSs, fermented mash, distilled ethanol, and stillage. For all aflatoxin-contaminated corn samples, no aflatoxin was detected in the distilled ethanol, which agrees with many reported studies [33-36]. Furthermore, no aflatoxin was detected in the rinse fractions, which were distilled through the fractionating column and Graham condenser after each contaminated sample was distilled for ethanol, to make sure no aflatoxin was carried over between samples. Aflatoxin was detected in the fermented mash, stillage, and DCSs in each of the contaminate samples.
Liquid chromatography coupled to tandem mass spectrometry analysis of the fermented mash (containing no DCSs) collected before distillation of ethanol measured total aflatoxin levels ranging from approximately 130 - 195 ppb, an average of 13% total aflatoxin recovered from the starting material. Since no aflatoxin was detected in the distilled ethanol, similar values obtained from the stillage fractions (containing no DDGs) collected after distillation of ethanol measuring 133-195 ppb total aflatoxin are expected. The greatest concentration of aflatoxin was recovered in the DCSs. From the original starting weight (100 g) of the contaminated corn samples (1 - 4), 37, 34, 47, and 42 g, respectively, were recovered as DCSs and consequently, accounts for 37%, 34%, 47%, and 42% of the weight of the original corn samples. From these DCS samples, 9867, 9756, 14,208, 14,108 ppb of total aflatoxin were detected via LC-MS/MS accounting for 47%, 31%, 39%, and 58% recovery of aflatoxin from the starting material. The average of a 44% recovery is comparable to recovery of total mycotoxin reported by Bothast et al. [35].
The unrecovered aflatoxin may have ended up in the solubles, which were not analyzed in this study. Our study, like most others, showed that the mycotoxin remained intact in the wet distillers grains (WDG) or other fractions, which are usually combined to produce DDGS [26,35]. Since these fractions represent a smaller mass than the starting material the concentration of mycotoxins is typically higher in DDGS. The FDA published [54] that as a general rule mycotoxins concentrate 3-5 times in the DDGS. This assumption is based on empirical data. The dry mass of DDGS was approximately one-third that of the starting feedstock. Therefore, if aflatoxin degradation in negligible, a higher concentration (3×) would be expected. Previous studies [35,55,56] confirm this concentration effect. However, mycotoxin recovery is not always reported the same making it difficult to estimate the concentration effect. Several issues prevent a quantitative comparison of aflatoxin concentration. Often mycotoxin recovery is not reported as a concentration, but as a raw amount and is reported separately for the fraction, which are combined to make DDGS. Additionally, the moisture content for these fractions is not always reported and often differs for each fraction, and the final aflatoxin concentration is dependent on the fraction combination and amount of solubles included [26].
MTB-100®, an esterified glucomannan processed from yeast cell walls, was mixed in with contaminated DDGs (14,000 ppb), making up 16.7% of the total weight. After allowing the mixed DDGs and binders to sit for seven days, to allow for binder/DDGs interaction, analysis via LC-MS/MS showed a remarkable decrease in aflatoxin concentration. The binders were able to sequester large amounts of aflatoxin as demonstrated by the chromatogram in Figure 5, reducing aflatoxin concentration by 80% according to the ratio in peak’s heights when comparing the positive control with the contaminated samples containing the sorbent. These results agree with two thorough studies [44,48] investigating MTB-100® and several other possible sequestering agents on the reduction of aflatoxin in vitro and in vivo. Results showed that MTB-100® bound over 95% of aflatoxin B1 in vitro and reduced aflatoxin M1 contamination 59% in lactating Holstein cows when MTB-100® consisted 0.05% of the diet. For the present experiment, further testing would need to be done to determine how aflatoxin is associating with the binders, if it is covalently bounded or tightly interacted and how the binder-aflatoxin interaction affects the physiology of the animals.
Results showed that environmental variables can alter the binding efficiency of MTB-100® and aflatoxin. These results corroborate a study [57] that gauged the adsorption efficiency of 31 different binders that varied with concentration and constitution of mineral, beta-glucan and ash composition with aflatoxin B1. This study also gauged the efficiency of these adsorbents against environmental conditions such as pH values of 6.5, 3.0 and porcine gastric juices at a temperature of 37˚C. The study concluded that a pH of 6.5 had the highest adsorbent efficiency followed by 3.0 and porcine gastric juices having the lowest binding efficiency. The findings of the experiments presented in this paper seem to contradict a previous study gauging the binding capabilities of
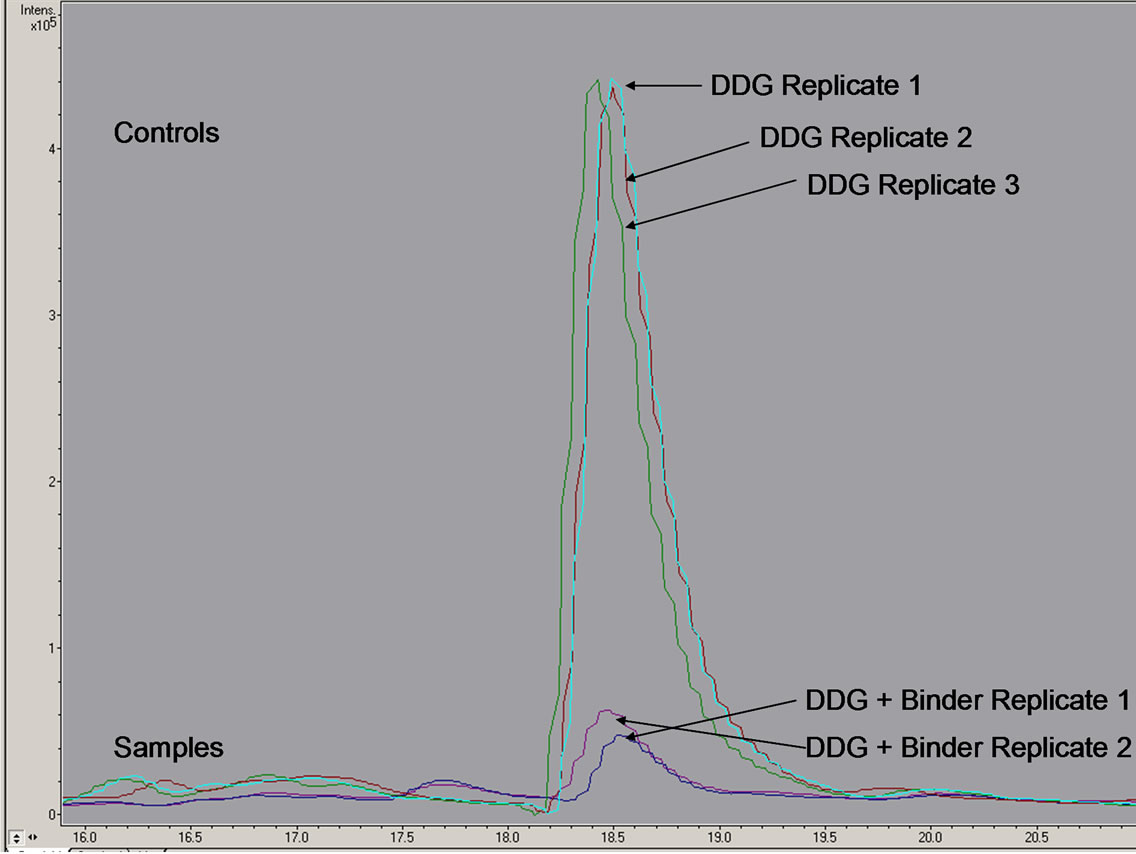
Figure 5. Chromatogram obtained from LC-MS/MS analysis showing positive controls using aflatoxin-contaminated DDGs (14,000 ppb total aflatoxin) and samples containing sorbents mixed in with contaminated DDGs.
MTB-100® at a similar pH range [44]. These differences could be due to the fact that our study utilized a higher concentration of organic solvent (70:30 MeOH:H2O vs. 10:90 MeOH:H2O) which could wash the aflatoxin from the adsorbent agent and the fact that our study had a readjustment to a neutral pH for analysis. This current study represents the first temperature and pH dependent study conducted on MTB-100®. Environmental conditions can pose significant issues when trying to utilize this binding agent industry wide seeing as DDGs and binders vary significantly throughout industry and even within brand [57] (coarseness, pH, environmental contaminants, ash and moisture content). The most pressing environmental variable that would prevent adequate binding would be cold temperature and extreme pH. Utilization of this binding agent would be optimal where extreme cold weather is minimal and a neutral pH in DDGs can be adhered. Also of note is the fact that the aflatoxin extraction efficiency decreases considerably at pH of 9 and 10. This could be due to the opening of the lactone ring similar to the ammoniation of aflatoxin which is reversible once the pH has been acidified [46].
5. Conclusions
Corn is a major crop affected by Aspergillus mold and hence aflatoxin contamination. With the growing need for alternative fuel sources, the demand for corn among ethanol production plants is increasing, therefore diverting corn from the consumer’s market and feed for cattle. The overwhelming competition for corn makes aflatoxin contamination a serious problem in the US Therefore, determining where aflatoxin is concentrated during ethanol fermentation process of contaminated corn is important in the effort to keep corn prices low, help in the sustainability of ethanol plants and for the health of animals consuming DDGs from the co-products of ethanol plants. In this study aflatoxin was not detected in the distilled ethanol. Most aflatoxin was recovered in the DCS, and was also detected in the fermented mash and stillage but at much lower levels. Binders may be a very easy and cost effective means for treating contaminated DDGs collected after fermentation. This current study investigated MTB-100® as a possible agent for sequestering aflatoxin in contaminated DDGs with results showing 80% reduction in total aflatoxin levels.
Environmental variables affecting binding capability is a concern with MTB-100®. With the majority of corn and ethanol production in the United States taking place in areas that routinely experience extreme cold weather, the binding capabilities of MTB-100® should be viewed with cautious optimism as it appears the MTB-100’s mycotoxins binding ability is considerably negatively altered by cold temperature conditions MTB-100® does seem like it would make an excellent candidate for the control of aflatoxin contaminated animal feed that is stored in an environment that is free from extreme cold conditions and animal feed that has a pH range in between 6 and 8.
REFERENCES
- J. W. Bennett and M. Klich, “Mycotoxins,” Clinical Microbiology Revies, Vol. 16, No. 3, 2003, pp. 497-516. doi:10.1128/CMR.16.3.497-516.2003
- G. A. Payne, “Epidemiology of Aflatoxin Formation by A. flavus. Aflatoxin and Aspergillus flavus in Corn,” Southern Cooperative Series Bulletin, Vol. 25, 1983, pp. 16- 19.
- M. A. Klich, L. S. Lee and H. E. Huizar, “The Occurrence of Aspergillus flavus in Vegetative Tissue of Cotton Plants and Its Relation to Seed Infection,” Mycopathologia, Vol. 95, No. 3, 1986, pp. 171-174. doi:10.1007/BF00437123
- H. S. Lillard, R. T. Hanlin and D. A. Lillard, “Aflatoxigenic Isolates of Aspergillus flavus from Pecans,” Applied Microbiology, Vol. 19, No. 1, 1970, pp. 128-130.
- W. D. Price, R. A. Lovell and D. G. McChesney, “Naturally Occurring Toxins in Feedstuffs: Center for Veterinary Medicine Perspective,” Journal of Animal Science, Vol. 71, No. 9, 1993, pp. 2556-2562.
- H. M. Martins, M. L. Martins and F. M. A. Bernardo, “Bacillaceae Spores, Fungi and Aflatoxin Determination in Honey,” RPCV (Revista Portuguesa De Ciências Veterinárias), Vol. 98, No. 546, 2003, pp. 85-88.
- C. Bircan, S. A. Barringer, U. Ulken and R. Pehlivan, “Increased Aflatoxin Contamination of Dried Figs in a Drought Year,” Food Additives and Contaminants, Part A, Vol. 25, No. 11, 2008, pp. 1400-1408.
- N. Delage, A. d’Harlingue, B. C. Ceccaldi and G. Bompeix, “Occurrence of Mycotoxins in Fruit Juices and Wine,” Food Control, Vol. 14, No. 4, 2008, pp. 225-227. doi:10.1016/S0956-7135(03)00010-0
- P. Rahimi, B. Sharifnabi and M. Bahar, “Detection of Aflatoxin in Aspergillus Species Isolated from Pistachio in Iran,” Journal of Phytopathology, Vol. 156, No. 1, 2008, pp. 15-20. doi:10.1111/j.1439-0434.2007.01312.x
- Council for Agricultural Science and Technology, “Mycotoxins, Economics and Health Risks,” Report No. 116, Ames, 1980.
- Council for Agricultural Science and Technology (CAST) “Aflatoxins and Other Mycotoxins, an Agricultural Perspective,” Report No. 80, Ames, 1979.
- International Agency for Research on Cancer, “Some Traditional Herbal Medicines, Some Mycotoxins, Napthalene and Styrene,” Vol. 82, IARC Monographs on the Evaluation of Carcinogenic Risks to Humans, World Health Organization, Geneva, 2002, pp. 171-175.
- W. P. Blount, “Turkey ‘X’ Disease,” Turkeys, Vol. 9, No. 7, 1961, pp. 52-61.
- D. L. Wei and S. C. Jong, “Production of Aflatoxins by Strains of the Aspergillus flavus Group Maintained at ATCC,” Mycopathologia, Vol. 93, No. 1, 1986, pp. 19-24. doi:10.1007/BF00437010
- M. A. Klich and J. I. Pitt, “Differentiation of Aspergillus flavus from A. parasiticus and Other Closely Related Species,” Fragments of Training Set Structures, Vol. 91, No. 1, 1988, pp. 99-108. doi:10.1016/S0007-1536(88)80010-X
- R. A. Squire, “Rating Animal Carcinogens: A Proposed Regulatory Approach,” Science, Vol. 214, No. 4523, 1981, pp. 877-880. doi:10.1126/science.7302565
- J. M. Cullen and P. M. Newberne, “Acute Hepatotoxicity of Aflatoxins,” In: D. L. Eaton and J. D Groopman, Eds., The Toxicology of Aflatoxins: Human Health, Veterinary, and Agricultural Significance, Academic Press, San Diego, 1994, pp. 3-26.
- H. P. van Egmond, “Aflatoxin M1: Occurrence, Toxicity, Regulation,” In: H. P. van Egmond, Ed., Mycotoxins in Dairy Products, Elsevier Applied Science, London, 1989, pp. 11-55.
- S. C. Pei, Y. Y. Zhang, S. A. Eremin and W. J. Lee, “Detection of Aflatoxin M1 in Milk Products from China by ELISA Using Monoclonal Antibodies,” Food Control, Vol. 20, No. 12, 2009, pp. 1080-1085. doi:10.1016/j.foodcont.2009.02.004
- M. A. Klich, “Biogeography of Aspergillus Species in Soil and Litter,” Mycologia, Vol. 94, No. 1, 2002, pp. 21-27. doi:10.2307/3761842
- M. A. Klich, “Aspergillus flavus: The Major Producer of Aflatoxin,” Molecular Plant Pathology, Vol. 8, No. 6, 2007, pp. 713-722. doi:10.1111/j.1364-3703.2007.00436.x
- H. P. van Edmond and M. A. Jonker, “Worldwide Regulations on Aflatoxins,” In: H. K. Abbas, Ed., Aflatoxin and Food Safety, Taylor and Francis, Boca Raton, 2005, pp. 77-93.
- “US Federal Drug Agency (FDA), Office of Regulatory Affairs (ORA) Compliance Policy Guides (CPG) 7126.33 Sec. 683.100—Action Levels for Aflatoxin in Animal Feeds, Issued Nov 21, 1979, Reissued Oct 1, 1980, Revised Aug 15, 1982, May 18, 1989, and Aug 28,” 1994. www.fda.gov/ora/compliance_ref/cpg
- S. D. Donner and C. J. Kucharik, “Corn-Based Ethanol Production Comprises Goal of Reducing Nitrogen Export by the Mississippi River,” Proceedings of the National Academy of Sciences, Vol. 18, No. 105, 2008, pp. 4513- 4518. doi:10.1073/pnas.0708300105
- S. A. Watson, “Structure and Composition” In: S. A. Watson and P. E. Ramstad, Eds., Corn: Chemistry and Technology, American Association of Cereal Chemists, Inc., St. Paul, 1987, pp. 53-82.
- F. Wu and G. P. Munkvold, “Mycotoxins in Ethanol Co-Products: Modeling Economic Impacts on the Livestock Industry and Management Strategies,” Journal of Agricultural and Food Chemistry, Vol. 56, No. 11, 2008, pp. 3900-3911. doi:10.1021/jf072697e
- M. J. Spiehs, M. H. Whitney and G. C. Shurson, “Nutrient Database for Distiller’s Dried Grains with Solubles Produced from New Ethanol Plants in Minnesota and South Dakota,” Journal of Animal Science, Vol. 80, No. 10, 2002, p. 2639
- D. J. Schingoethe, “Corn Co Products for Cattle,” Proceedings from 40th Eastern Nutrition Conference, Ottawa, 11-12 May 2004, pp. 30-47.
- B. S. Dien, R. B. Hespell, L. O. Ingram and R. J. Bothast, “Conversion of Corn Milling Fibrous Co-Products into Ethanol by Recombinant Escherichia Coli Strains K011 and SL40,” World Journal of Microbiology and Biotechnology, Vol. 13, No. 6, 1997, pp. 619-625. doi:10.1023/A:1018554417934
- B. C. Saha, B. S. Dien and R. J. Bothast, “Fuel Ethanol Production from Corn Fiber, Current Status and Technical Prospects,” Applied Biochemistry and Biotechnology, Vol. 70-72, No. 1, 1998, pp. 115-125. doi:10.1007/BF02920129
- Y. Kim, N. S. Mosier, R. Hendrickson, T. Ezeji, H. Blaschek, B. Dien, M. Cotta, B. Dale and M. R. Ladisch, “Composition of Corn Dry-Grind Ethanol By-Products: DDGS, Wet Cake, and Thin Stillage,” Bioresource Technology, Vol. 99, No. 12, 2008, pp. 5165-5176. doi:10.1016/j.biortech.2007.09.028
- F. S. Chu, C. C. Shang, S. H. Ashoor and N. Prentice, “Stability of Aflatoxin B1 and Ochratoxin A in Brewing,” Journal of Applied Microbiology, Vol. 29, No. 3, 1975, pp. 313-316.
- R. Dam, S. W. Tam and L. D. Satterlee, “Destruction of Aflatoxins during Fermentation and By-Product Isolation from Artificially Contaminated Grains,” Cereal Chemistry, Vol. 54, No. 3, 1977, pp. 705-714.
- E. B. Lillehoj, W. F. Maisch and A. Lagoda, “The Fate of Aflatoxin in Naturally Contaminated Corn during the Ethanol Fermentation,” Canadian Journal of Microbiology, Vol. 25, No. 8, 1979, pp. 911-914. doi:10.1139/m79-135
- R. J. Bothast, G. A. Bennett, J. E. Vancauwenberge and J. L. Richard, “Fate of Fumonisin B1 in Naturally Contaminated Corn during Ethanol Fermentation,” Applied and Environmental Microbiology, Vol. 58, No. 1, 1992, pp. 233-236.
- Z. S. C. Okoye, “Carryover of Aflatoxin B1 in Contaminated Substrate Corn in Nigerian Native Beer,” Bulletin of Environmental Contamination and Toxicology, Vol. 37, No. 1, 1986, pp. 482-489. doi:10.1007/BF01607792
- L. L. Southern and A. J. Clawson, “Ammoniation of Corn Contaminated with Aflatoxin and Its Effects on Growing Rats,” Journal of Animal Science, Vol. 50, No. 3, 1982, pp. 459-466.
- M. D. Buser and H. K. Abbas, “Effects of Extrusion Temperature and Dwell Time on Aflatoxin Levels in Cottonseed,” Journal of Agricultural and Food Chemistry, Vol. 50, No. 9, 2002, pp. 2556-2559. doi:10.1021/jf011479x
- J. A. Méndez-Albores, G. A. Villa, J. C. Del Rio-García and E. M. Martínez, “Aflatoxin-Detoxification Achieved with Mexican Traditional Nixtamalization Process (MTNP) Is Reversible,” Journal of the Science of Food and Agriculture, Vol. 84, No. 12, 2004, pp. 1611-1614. doi:10.1002/jsfa.1853
- I. Ghanem, M. Orfi and M. Shamma, “Effect of Gamma Radiation on the Inactivation of Aflatoxin B1 in Food and Feed Crops,” Brazilian Journal of Microbiology, Vol. 39, No. 4, 2008, pp. 787-791. doi:10.1590/S1517-83822008000400035
- S. Herzallah, K. Alshawabkeh and A. Al Fataftah, “Aflatoxin Decontamination of Artificially Contaminated Feeds by Sunlight, γ-Radiation, and Microwave Heating,” The Journal of Applied Poultry Research, Vol. 17, No. 4, 2008, pp. 515-521. doi:10.3382/japr.2007-00107
- The Code of Federal Regulations, “Title 21, Food and Drugs; Part 582, Substances Generally Recognized as Safe; Subpart c, Anticaking Agents; Section 582.2727, Sodium Aluminosilicate,” Federal Register, Vol. 77, 2011, p. 567.
- The Code of Federal Regulations, “Title 21, Food and Drugs; Part 582, Substances Generally Recognized as Safe; Subpart c, Anticaking Agents; Section 582.2729, Hydrated Sodium Calcium Aluminosilicate,” Federal Register, Vol. 77, 2011, p. 568.
- D. E. Diaz, W. M. Hagler Jr., B. A. Hopkins and L. W. Whitlow, “Aflatoxin Binders I: In Vitro Binding Assay for Aflatoxin B1 by Several Potential Sequestering Agents,” Mycopathologia, Vol. 156, No. 3, 2002, pp. 223-226. doi:10.1023/A:1023388321713
- J. C. R. Demythenaere, C. Dagher, P. Sandra, S. Kallithraka, R. Verhe and N. De Kimpe, “Flavour Analysis of Greek White Wine by Solid-Phase Microextraction-Capillary Gas Chromatography,” Journal of Chromatography A, Vol. 985, No. 1-2, 2003, pp.127-153.
- G. Piva, F. Galvano, A. Pietri and A. Piva, “Detoxification Methods of Aflatoxins: A Review,” Nutrition Research, Vol. 15, No. 5, 1995, pp. 767-776. doi:10.1016/0271-5317(95)00042-H
- M. Peraica, A. M. Domijan, Ž. Jurjević and B. Cvjetković, “Prevention of Exposure to Mycotoxins From Food and Feed,” Archives of Industrial Hygiene and Toxicology, Vol. 53, No. 3, 2002, pp. 229-237.
- D. E. Diaz, W. M. Hagler Jr., J. T. Blackwelder, J. A. Eve, B. A. Hopkins, K. L. Anderson, F. T. Jones and L. W. Whitlow, “Aflatoxin Binders II: Reduction of Aflatoxin M1 in Milk by Sequestering Agents of Cows Consuming Aflatoxin In Feed,” Mycopathologia, Vol. 157, No. 2, 2004, pp. 1-8.
- M. G. T. Arvide, I. Mulder, A. L. B. Velazquez and J. B. Dixon, “Smectite Clay Adsorption of Aflatoxin vs. Octahedral Composition as Indicated by FTIR,” Clays and Clay Minerals, Vol. 56, No. 5, 2008, pp. 571-578. doi:10.1346/CCMN.2008.0560510
- I. A. Samdal, J. A. B. Aasen, L. R. Briggs, E. Dahl and C. O. Miles, “Comparison of ELISA and LC-MS Analyses for Yessotoxins in Blue Mussels (Mytilus edulis),” Toxicon, Vol. 46, No. 1, 2005, pp. 7-15. doi:10.1016/j.toxicon.2005.02.003
- Z. Zheng, J. Hanneken, D. Houchins, R. S. King, P. Lee and J. L. Richard, “Validation of an ELISA Test Kit for the Detection of Ochratoxin A in Several Food Commodities by Comparison with HPLC,” Mycopathologia, Vol. 159, No. 2, 2005, p. 265. doi:10.1007/s11046-004-8663-3
- H. Colak, H. Hampikyan, B. Ulusoy and O. Ergun, “Comparison of Competitive ELISA with an HPLC Method for the Determination of Aflatoxin M1 in Turkish White, Kasar and Tulum cheeses,” European Food Research and Technology, Vol. 223, No. 6, 2006, pp. 719- 723. doi:10.1007/s00217-006-0258-4
- J. M. Faupel-Badger, B. J. Fuhrman, X. Xu, R. T. Falk, L. K. Keefer, T. D. Veenstra, R. N. Hoover and R. G. Ziegler, “Comparison of Liquid Chromatography-Tandem Mass Spectrometry, RIA, and ELISA Methods for Measurement of Urinary Estrogens,” Cancer Epidemiology, Biomarkers & Prevention, Vol. 19, No. 1, 2010, pp. 292-300. doi:10.1158/1055-9965.EPI-09-0643
- US Food and Drug Administration, Center for Veterinary Medicine, “Nationwide Survey of Distillers Grains for Aflatoxins,” 2006. http://www.fda.gov/cvm/aflatoxinassign
- G. S. Murthy, D. E. Townsend, G. L. Meerdink, G. L. Bargren, M. E. Tumbleson and V. Singh, “Effect of Aflatoxin B1 on the Dry-Grid Ethanol Process,” Cereal Chemistry, Vol. 82, No. 3, 2005, pp. 302-304. doi:10.1094/CC-82-0302
- G. A. Bennett, A. A. Lagoda, O. L. Shotwell and C. W. Hesseltine, “Utilization of Zearalenone-Contaminated Corn for Ethanol Production,” Journal of the American Oil Chemists’ Society, Vol. 58, No. 11, 1981, pp. 974-976. doi:10.1007/BF02659774
- S. Fruhauf, H. Schwartz, F. Ottner, R. Krska and E. Vekiru, “Yeast Cell Based Feed Additives: Studies on Aflatoxin B1 and Zearalenone,” Food additives & Contaminants, Vol. 29, No. 2, 2012, pp. 217-231. doi:10.1080/19440049.2011.630679