Modern Mechanical Engineering
Vol. 2 No. 4 (2012) , Article ID: 25135 , 6 pages DOI:10.4236/mme.2012.24020
Axial Tensile Testing of Single Fibres
Department of Aerospace Engineering, Indian Institute of Technology Kanpur, Kanpur Uttar Pradesh, India
Email: *mohite@iitk.ac.in
Received May 31, 2012; revised July 7, 2012; accepted July 21, 2012
Keywords: Single fibre; tensile test; axial modulus; strength; failure strain; carbon; glass fibre
ABSTRACT
The mechanical and damage properties of single fibres used in fibrous composite have gained tremendous importance in recent years. These properties are used in determination of effective properties of composites by micromechanics. These are also used in the micromechanical damage modeling. Further, these properties are used as an indicator of the excellence of product by manufacturers. In the present study the axial tensile modulus, ultimate strength and failure strain of single fibres are determined for carbon and glass fibres. ASTM D3379-75 standard is followed and a number of fibers are tested for statistical analysis. The axial tensile moduli measured are 246.7 GPa and 93.3 GPa, respectively and strength are 3031.6 MPa and 2035.9 MPa, respectively for carbon and glass fibres. Further, the respective axial tensile failure strains are 0.0137 and 0.0224. The error in the measurement of axial modulus is below 8% while for axial tensile strength is below 1%.
1. Introduction
Fibers are the principal load carrying component of a composite. The characteristics of the fiber significantly influence the effective mechanical and damage properties of the composite fabricated from it. The mechanical and damage properties of individual constituents, that is fibre and matrix, are essential in a micromechanical analysis of composites for effective properties and damage evaluation, for example see [1-3]. Since most of the high performance fibers are transversely isotropic, five mechanical constants are to be determined in order to characterize the fiber. There are several techniques available to determine these constants. In this work, simple experimental techniques are adopted to completely characterize the fiber. These experiments are conducted on single filaments. Carbon fiber, a transversely isotropic fiber and glass fiber, which, is isotropic in nature, are used to illustrate these experimental techniques.
In most of the micromechanical analysis the mean or average properties are used. However, the variation of properties can have significant effect on the final results. Hence, one needs statistical information about the individual constituent properties for detailed micromechanical analysis. In the present study another emphasis is given to create the statistical data for the behaviour of these fibres.
The experimental procedures to determine the axial Young’s modulus and ultimate axial tensile strength of single fibre have been explained in detail in this work. These properties are determined following ASTM D3379-75 standard as given in [4]. The other approaches can be seen in the works of [5-7]. Measuring the modulus and strength by conducting a tensile test on a strand of fibres is very popular in fibre manufacturing industry (for example, see [8]). The single fibre and strand tests have their own pros and cons. For example, the single fibre testing method is time consuming. The strand testing is simple and can be done quickly and it gives the average properties. However, there can be problems of aligning of all fibres in the strand with the load applied, the friction between the fibres, twisting of the fibres, etc.
A detailed study has been carried out by the authors in [8]. In this work various elastic and damage property measurements of the carbon and glass fibres have been attempted. However, in this article we present the measurement of axial tensile Young’s modulus, ultimate strength and failure strain of single carbon and glass fibres.
The present work is a step towards a complete experimental characterization of single fibres for mechanical and damage properties evaluation. These properties, in turn, will be used for micromechanics based damage modeling of indigenous fibrous composites in this organization, for example see 2, 3.
2. Measurement of Fibre Diameter
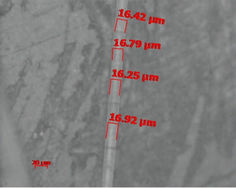
To study the scatter in diameter of fiber specimen, an advanced optical microscope (model ZIESS AXIO Imager, M1m, with maximum possible magnification up to 1000×) is used to measure diameter of carbon and glass fibers. Bundles of fibers are cut into very small pieces and mixed with few milliliters of methanol. This suspension is stirred completely in order to separate out single filaments. The suspension is then poured on a glass slide. The slide is placed undisturbed till all the methanol evaporated, leaving only single fibers on the slide. The slide is then observed under the optical microscope. Magnification of 200× is used to capture the fiber specimen pictures. The diameter is directly measured from the image obtained. The mean diameter is determined and used in all the calculations.
A total of five fibers of each type are measured. Four measuring points are taken along the length of each fiber specimen. The variation in the diameter along the length of the fiber is found to be negligible and so the mean diameter of each specimen is taken as the average of diameters at those two measuring points. A significant scatter in the diameter of different fiber specimens is observed for each fiber type.
3. Tensile Test on Single Fibre
The tensile test is performed on single filaments of carbon and glass in order to find their axial tensile modulus, ultimate strength and failure strain, according to ASTM D3379-75 [4]. An INSTRON 1195 machine is used, with a 100 g load cell. The cross-sectional area of a single fiber is calculated using the mean diameter determined by the procedure given in above section. The details of the stepwise experimental procedure are given in the following subsections.
3.1. Preparation of Specimens
The tab for mounting the specimen in the machine is prepared out of thick paper. A slot of length equal to the gage length is cut out in the middle of the tab as shown in Figure 1. A single filament is randomly chosen from the fiber bundle and pasted at both the ends of the slot in the paper tab using suitable adhesive. The actual gage length of the fiber is measured using a vernier caliper to the nearest 0.1 mm.
3.2. Testing of Specimens
The specimen to be tested is mounted on the INSTRON machine. Immense care is taken to ensure that the axis of the fiber is aligned in-line with the axis of the cross-head in order to simulate a uniform stress condition over the cross-section of the fiber. The full-scale load is set to 1 N and the cross-head and chart speeds are set to 0.2 mm/ min and 50 mm/min, respectively. Without disturbing the setup, both sides of the tabs are cut carefully at the mid-gage as shown in Figure 1. The specimen is then tensioned with the chart recording the test load and elongation till the specimen failed. A total of 12 carbon fiber filaments of mean diameter 6.82 μm and 10 glass fiber filaments of mean diameter 15.92 μm are tested. The optical micrographs of a sample carbon and glass fibres are shown in Figures 2(a) and (b), respectively.
3.3. Determination of System Compliance (Cs)
The machine is calibrated and the system compliance is determined before testing the specimens. Specimens of different gage lengths of 10, 20, 30 and 40 mm are prepared as described in Section 3.1 and tested as per Section 3.2. From the chart obtained for each specimen, I, the full-scale elongation of the specimen is calculated by extrapolating the initial straight line portion of the load displacement curve till the full-scale load, as shown in Figure 3. Using the full-scale elongation, the indicated
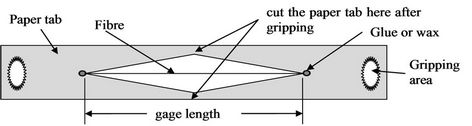
Figure 1. Single fibre specimen for axial tensile testing.
 (a)
(a)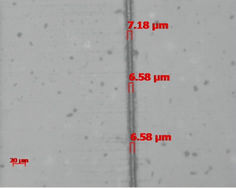 (b)
(b)
Figure 2. Optical micrographs of (a) carbon and (b) glass fibres under 200× magnification.
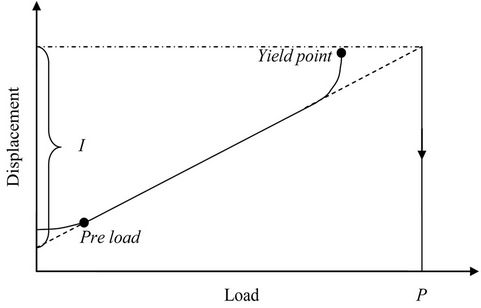
Figure 3. Typical load displacement curve showing pre-load, yield point, full scale load and elongation.
compliance is calculated. Now, the compliances of all the specimens are plotted against their gage lengths. A best fit line is drawn for these set of points. The Y-intercept of this line, which indicates the system compliance,  , is determined. The true compliance is determined by subtracting the system compliance from the indicated compliance as follows.
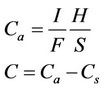 (1)
(1)
where,
 = full-scale elongation, mm;
 = full-scale load, N;
 = cross-head speed, mm/min;
 = chart speed, mm/min;
 = indicated compliance, mm/N;
 = system compliance, mm/N;
 = true compliance, mm/N.
3.4. Calculation of Axial Modulus and Ultimate Tensile Strength
The axial modulus of the specimen is calculated as
 (2)
(2)
where,  gage length of the specimen, mm,
  = average cross-sectional area of the specimen,
 ,
,  axial modulus of the specimen, GPa.
Also the load at failure is obtained from the chart and the ultimate tensile strength of the specimen is calculated
 (3)
(3)
where,
 and F = Load at failure The error or uncertainty in the measurements of axial modulus can be given using Equation (2) as follows:
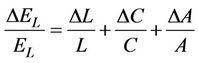 (4)
(4)
The error in the measurement of the compliance is combined error of indicated compliance and system compliance. However, we assume that these errors are of the same order as the system compliance is measured from indicated compliance. The error in the indicated compliance using Equation (1) is given as
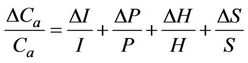 (5)
(5)
The error in the measurement of ultimate tensile strength is given from Equation (3) as
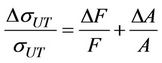 (6)
(6)
4. Results and Discussions
4.1. Measurement of Fibre Diameter
The diameters of carbon and glass fibres are determined as per the procedure given earlier. The mean diameters and standard deviations for these two fibres are reported in Table 1.
The scatter in the diameter of carbon fibers is less as compared to scatter in diameter of glass fibers. Though the scatter in the diameter of the fibers seems not to be significant (<10%), the effect of this scatter (if not considered) will be a resultant scatter of twice this magnitude (about 13% in this case) in the calculation of tensile strength and axial modulus. This is because the tensile strength and axial modulus are inversely proportional to the square of the diameter.
4.2. Measurement of System Compliance
The system compliance is obtained as per the procedure discussed in the Section 3.3. The specimens of different gage lengths in the range of 20 to 40 mm are prepared and tested under axial loading. The indicated compliance for these specimens is computed. These are then plotted as shown in Figure 4 for glass fibres. The best fit line is then drawn. The equation of this line is
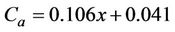 (7)
(7)
where, x represents the length in mm. The y-intercept, that is, 0.041 is the system compliance, . Similar procedure is carried out for carbon fibres.
4.3. Measurement of Axial Modulus and Ultimate Tensile Strength
The axial modulus and ultimate tensile strength of both carbon and glass fibres are measured for a gage length of 25 mm. The stress-strain curves for all the specimens of carbon and glass fibres are shown in Figures 5 and 6, respectively. The stress in the fibre at given load is calculated using mean diameters as given in Table 1. From these figures it can be seen that the stress-strain

Table 1. Mean and standard deviation for carbon and glass fibres diameter.
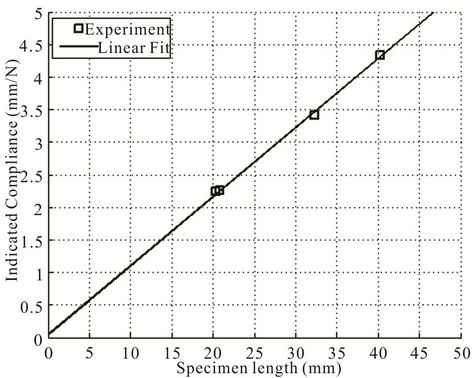
Figure 4. Determination of system compliance for glass fibres.
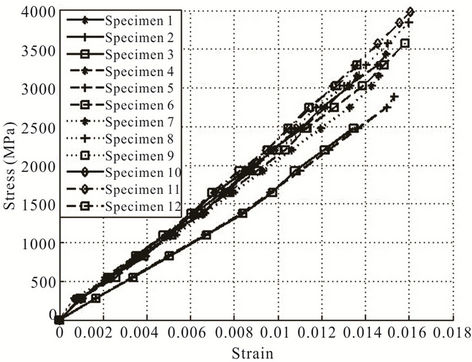
Figure 5. Stress-strain curves for carbon fibre specimens.
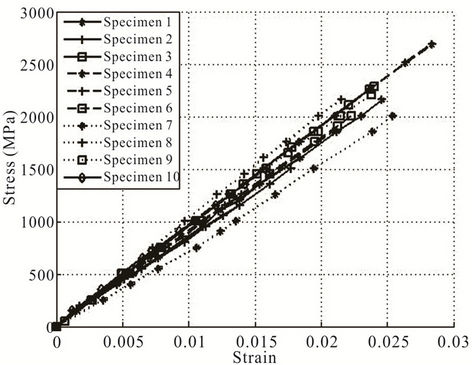
Figure 6. Stress-strain curves for glass fibre specimens.
curves are linear till final fracture for both carbon and glass fibres. This indicates that these fibres are brittle in nature. From these figures it can be seen that the curves overlap each other in the initial part for both carbon and glass fibres. However, there is a scatter in the axial modulus. The scatter in axial modulus is shown in Figures 7 and 8 for carbon and glass fibres, respectively. The mean and standard deviation for the axial modulus and ultimate tensile strength for these fibres have been reported in Table 2.
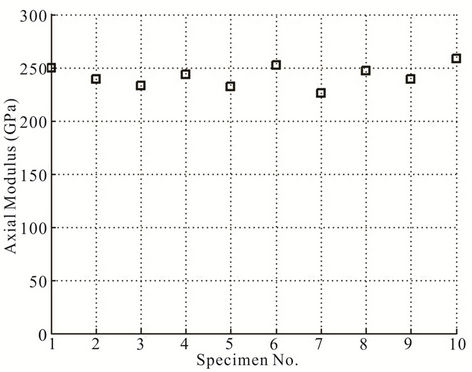
Figure 7. Scatter in axial modulus of carbon fibres.
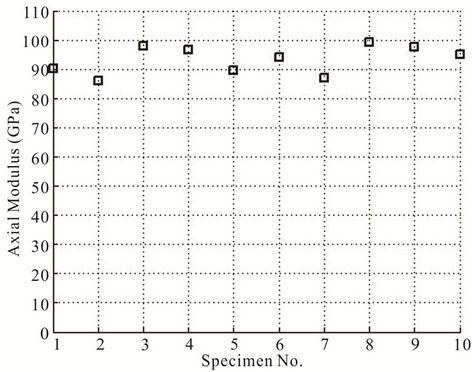
Figure 8. Scatter in axial modulus of glass fibres.
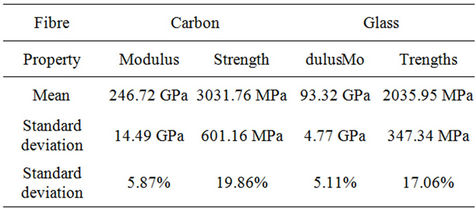
Table 2. Mean and standard deviation in axial Young’s modulus and tensile strength.
The fibres fail at different ultimate tensile loads. These can be seen from the Figures 5 and 6. The scatter in the ultimate tensile strength is shown in Figures 9 and 10 for carbon and glass fibres, respectively.
From Table 2 and the results reported in literature (for example, [9,10]) it can be seen that the axial tensile modulus and strength properties of the carbon and glass fibres studied are in good agreement. Further, the statistical data generated from this study will be used, as a sample data, for the study of effect on damage behaviour of unidirectional fibrous composites.
Remark: The exact specifications like pre-cursor material, fabrication type and name of the fibre and its manufacturer of the carbon and glass fibres tested here are not known to us. Hence, when comparing these properties we look at the range of the properties of the similar fibre.
4.4. Axial Strain at Failure
The strain values at the failure point for all the specimens

Figure 9. Scatter in axial tensile strength of carbon fibres.
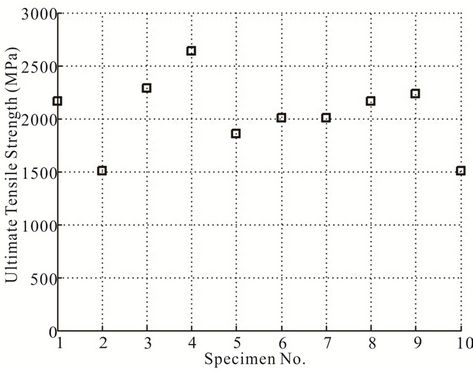
Figure 10. Scatter in axial tensile strength for glass fibres.
are known. The mean values and the standard deviation of the failure strains are reported in Table 3. The mean failure strains reported here are in good agreement with the results reported in literature [9,10].
4.5. Error in Measurement of Axial Young’s Modulus and Tensile Strength
The error in the measurement of axial Young’s modulus is calculated using Equation (4) as follows:
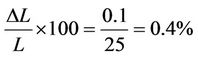
The error in the measurement of length of the specimen for a length of 25 mm in percent is
 . Similarly, the error for the measurement of cross sectional area of the fibre is
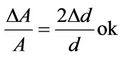 . Here,
  is the mean diameter of the fibre. For carbon fibre this error in percentage is
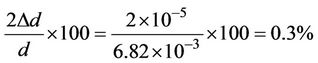 and for glass fibre it is 0.2%.
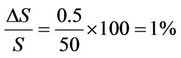
The error in the measurement of system compliance is calculated using Equation (5). Thus, putting the values we calculate the percentage errors in
![]() in carbon fibre and 0.16% for glass fibre,
in carbon fibre and 0.16% for glass fibre, ![]() for carbon fibre and 0.16% for glass fibre,
for carbon fibre and 0.16% for glass fibre, 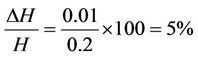 ,
, .
.
The percentage error in the measurement of ultimate load is of the order 0.6% for carbon fibre and 0.16% for glass fibre.
Thus, the error in the measurement of axial modulus is less than 8%. Further, the error in the axial tensile strength is less than 1%.
5. Conclusions
The axial tensile modulus, ultimate strength and failure of single carbon and glass fibres have been determined using ASTM D3379-75 standard. The mean axial tensile modulus of the carbon and glass fibres is 246.7 GPa and 93.3 GPa, respectively. The standard deviation in these
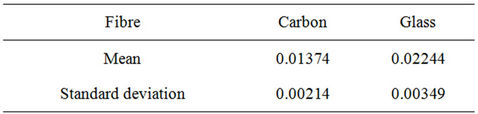
Table 3. Axial failure strains for carbon and glass fibres.
moduli is 14.5 GPa and 4.8 GPa, respectively. The mean axial tensile strength of the carbon and glass fibres is 3031.6 MPa and 2035.9 MPa, respectively. The standard deviation in these strength values is 601.16 MPa and 347.3 MPa, respectively. The mean axial tensile failure strains of these fibres are 0.0137 and 0.0224, respectively. The error in the measurement of axial Young’s modulus for both fibres is less than 8%. Further, the error in the measurement of axial tensile strength is less than 1%. The measured values of axial tensile modulus, ultimate strength and failure strains are in good agreement with the values reported in literature. The carbon fibre tested here is an intermediate modulus carbon fibre whereas the glass fibre is a high modulus glass fibre.
The scatter in the measured values of the axial modulus, strength and failure strain is important information for the statistical modeling of damage in the unidirectional fibrous composite. Further, this methodology is a stepping stone for measurement of axial compressive strength of these fibres using tensile recoil test, which is an interest of another article.
REFERENCES
- A. Jain, C. S. Upadhyay and P. M. Mohite, “Fibre Breaking Damage Model for Unidirectional Fibrous Composites Using Micromechanics,” 16th National Seminar on Aerospace Structures (NASAS), IIT Bombay, 2009.
- V. Murari, “Micromechanics Based Continuum Damage Model for Ply Failure in Unidirectional Composites,” Ph.D. Thesis, Department of Aerospace Engineering, Indian Institute of Technology Kanpur, Kanpur Uttar Pradesh, 2010.
- S. Biswas, “Micromechanics Based Damage Mesomodel for Unidirectional Fibrous Laminated Composite,” M. Tech. Thesis, Department of Aerospace Engineering, Indian Institute of Technology Kanpur, Kanpur Uttar Pradesh, 2011.
- ASTM D3379-75, “Standard Test Method for Tensile Strength and Young’s Modulus for High Modulus Single Filament Fibers,” ASTM Standards, 1975.
- Y. Yamashita, S. Kawabata, S. Okada and A. Tanaka, “Mechanical Characteristics of PBO Single Fiber,” 2003. www.mat.usp.ac.jp/polymer-composite/253.PDF
- D. Sinclair, “A Bending Method for Measurement of the Tensile Strength and Young’s Modulus of Glass Fibers,” Journal of Applied Physics, Vol. 21, No. 5, 1950, pp. 380-386. doi:+10.1063/1.1699670
- “Torayca Carbon Fibres Technical Information,” http://www.torayca.com/en/index.html
- I. P. Kumar, “Mechanical and Damage Characterization of Single Carbon and Glass Fibres,” M. Tech. Thesis, Department of Aerospace Engineering, Indian Institute of Technology Kanpur, Kanpur Uttar Pradesh, 2010.
- D. Hartman, D. M. Miller and M. E. Greenwood, “High Strength Glass Fibers,” Moving Forward with 50 Years of Leadership in Advanced Materials, Vol. 39, 1994, pp. 415-426.
- P. D. Soden, M. J. Hinton and A. S. Kaddour, “Lamina Properties, Lay-Up Configurations and Loading Conditions for a Range of Fibre-Reinforced Composite Laminates,” Composite Science and Technology, Vol. 58, No. 7, 1998, pp. 1011-1022. doi:10.1016/S0266-3538(98)00078-5
NOTES
*Corresponding author.